
|
|||||
|
 | |
| |
| |
| |
| |
| |
|
Gene: APOC2 |
Gene summary for APOC2 |
| Gene information | Species | Human | Gene symbol | APOC2 | Gene ID | 344 |
| Gene name | apolipoprotein C2 | |
| Gene Alias | APO-CII | |
| Cytomap | 19q13.32 | |
| Gene Type | protein-coding | GO ID | GO:0006082 | UniProtAcc | A0A024R0T9 |
Top |
Malignant transformation analysis |
| Identification of the aberrant gene expression in precancerous and cancerous lesions by comparing the gene expression of stem-like cells in diseased tissues with normal stem cells |
| Entrez ID | Symbol | Replicates | Species | Organ | Tissue | Adj P-value | Log2FC | Malignancy |
| 344 | APOC2 | S41 | Human | Liver | Cirrhotic | 1.20e-18 | 1.03e+00 | -0.0343 |
| 344 | APOC2 | S42 | Human | Liver | HCC | 7.74e-18 | 1.59e+00 | -0.0103 |
| 344 | APOC2 | S43 | Human | Liver | Cirrhotic | 9.88e-49 | 1.43e+00 | -0.0187 |
| 344 | APOC2 | S44 | Human | Liver | HCC | 4.21e-25 | 1.88e+00 | -0.0083 |
| 344 | APOC2 | HCC1_Meng | Human | Liver | HCC | 3.99e-85 | 4.82e-01 | 0.0246 |
| 344 | APOC2 | Pt13.a | Human | Liver | HCC | 9.28e-23 | 4.82e-01 | 0.021 |
| 344 | APOC2 | Pt13.b | Human | Liver | HCC | 2.38e-37 | 5.63e-01 | 0.0251 |
| 344 | APOC2 | Pt13.c | Human | Liver | HCC | 3.24e-06 | 4.50e-01 | 0.0076 |
| 344 | APOC2 | Pt14.a | Human | Liver | HCC | 1.80e-13 | 5.20e-01 | 0.0169 |
| 344 | APOC2 | Pt14.b | Human | Liver | HCC | 1.26e-14 | 5.69e-01 | 0.018 |
| 344 | APOC2 | Pt14.d | Human | Liver | HCC | 1.92e-15 | 4.22e-01 | 0.0143 |
| 344 | APOC2 | S014 | Human | Liver | HCC | 1.59e-44 | 1.71e+00 | 0.2254 |
| 344 | APOC2 | S015 | Human | Liver | HCC | 2.45e-40 | 1.83e+00 | 0.2375 |
| 344 | APOC2 | S016 | Human | Liver | HCC | 2.48e-51 | 1.76e+00 | 0.2243 |
| 344 | APOC2 | S027 | Human | Liver | HCC | 3.21e-31 | 2.75e+00 | 0.2446 |
| 344 | APOC2 | S028 | Human | Liver | HCC | 8.97e-60 | 2.42e+00 | 0.2503 |
| 344 | APOC2 | S029 | Human | Liver | HCC | 9.21e-70 | 3.46e+00 | 0.2581 |
| Page: 1 |
| Tissue | Expression Dynamics | Abbreviation |
| Liver | 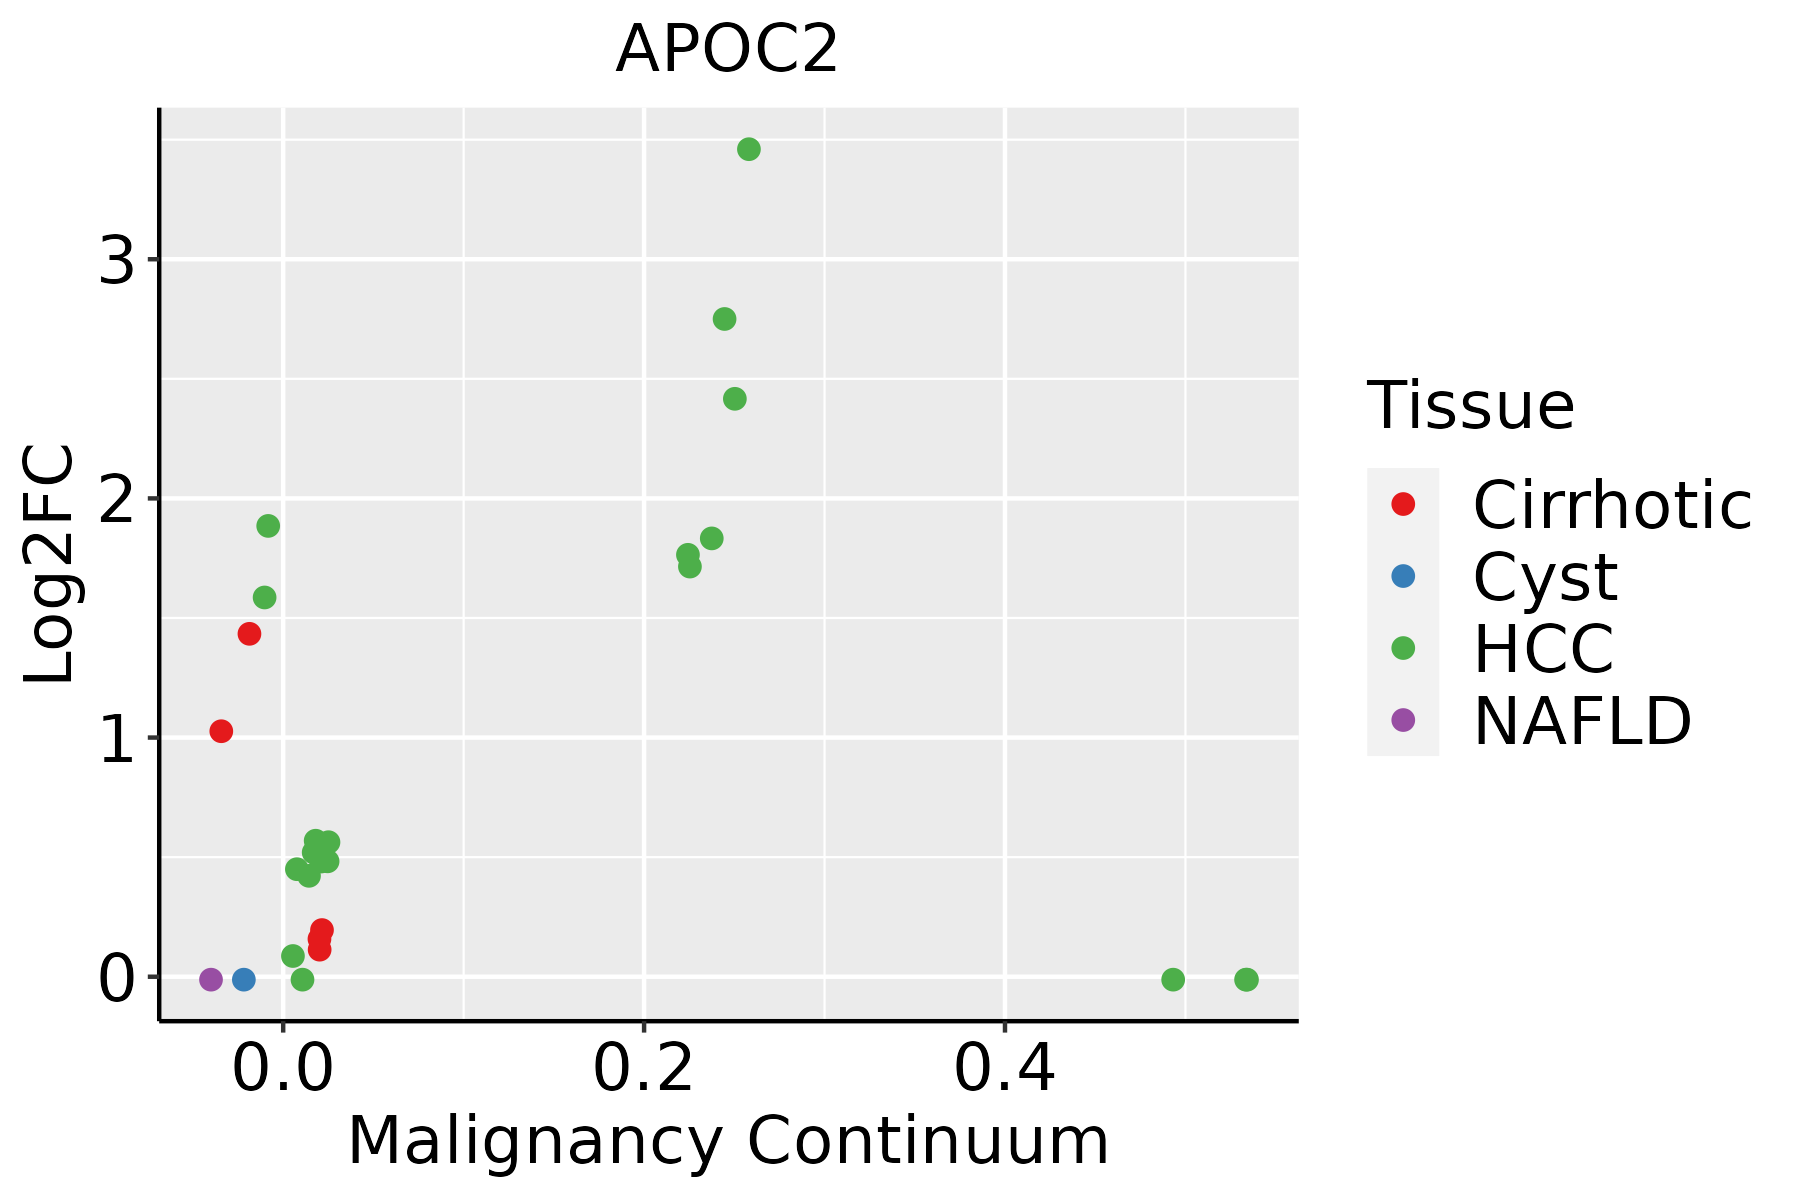 | HCC: Hepatocellular carcinoma |
| NAFLD: Non-alcoholic fatty liver disease |
| ∗log2FC in expression of this searched gene in stem-like cells from each diseased tissue sample relative to stem-like cells in normal samples in each tissue plotted against the malignancy continuum. Samples are colored based on if they are from different disease stage. |
Top |
Malignant transformation related pathway analysis |
| Find out the enriched GO biological processes and KEGG pathways involved in transition from healthy to precancer to cancer |
| Tissue | Disease Stage | Enriched GO biological Processes |
| Colorectum | AD |  |
| Colorectum | SER |  |
| Colorectum | MSS |  |
| Colorectum | MSI-H |  |
| Colorectum | FAP |  |
| ∗Top 15 enriched GO BP terms are showed in the bar plot of each disease state in each tissue. Each row represents a significant GO biological process which is colored according to the -log10(p.adjust). |
| Page: 1 2 3 4 5 6 7 8 9 |
| GO ID | Tissue | Disease Stage | Description | Gene Ratio | Bg Ratio | pvalue | p.adjust | Count |
| GO:000989612 | Liver | Cirrhotic | positive regulation of catabolic process | 215/4634 | 492/18723 | 1.13e-20 | 3.56e-18 | 215 |
| GO:003133112 | Liver | Cirrhotic | positive regulation of cellular catabolic process | 190/4634 | 427/18723 | 1.94e-19 | 4.18e-17 | 190 |
| GO:000663112 | Liver | Cirrhotic | fatty acid metabolic process | 165/4634 | 390/18723 | 1.29e-14 | 1.26e-12 | 165 |
| GO:001605312 | Liver | Cirrhotic | organic acid biosynthetic process | 139/4634 | 316/18723 | 4.28e-14 | 3.83e-12 | 139 |
| GO:004639412 | Liver | Cirrhotic | carboxylic acid biosynthetic process | 137/4634 | 314/18723 | 1.40e-13 | 1.14e-11 | 137 |
| GO:007233011 | Liver | Cirrhotic | monocarboxylic acid biosynthetic process | 93/4634 | 214/18723 | 1.43e-09 | 6.16e-08 | 93 |
| GO:005508811 | Liver | Cirrhotic | lipid homeostasis | 74/4634 | 167/18723 | 2.46e-08 | 8.51e-07 | 74 |
| GO:000663311 | Liver | Cirrhotic | fatty acid biosynthetic process | 70/4634 | 163/18723 | 2.57e-07 | 6.41e-06 | 70 |
| GO:006201212 | Liver | Cirrhotic | regulation of small molecule metabolic process | 124/4634 | 334/18723 | 2.74e-07 | 6.79e-06 | 124 |
| GO:004263211 | Liver | Cirrhotic | cholesterol homeostasis | 46/4634 | 96/18723 | 7.15e-07 | 1.52e-05 | 46 |
| GO:005509211 | Liver | Cirrhotic | sterol homeostasis | 46/4634 | 97/18723 | 1.04e-06 | 2.13e-05 | 46 |
| GO:001921611 | Liver | Cirrhotic | regulation of lipid metabolic process | 119/4634 | 331/18723 | 3.05e-06 | 5.39e-05 | 119 |
| GO:004424212 | Liver | Cirrhotic | cellular lipid catabolic process | 82/4634 | 214/18723 | 6.91e-06 | 1.08e-04 | 82 |
| GO:000689811 | Liver | Cirrhotic | receptor-mediated endocytosis | 91/4634 | 244/18723 | 8.13e-06 | 1.22e-04 | 91 |
| GO:004218011 | Liver | Cirrhotic | cellular ketone metabolic process | 80/4634 | 211/18723 | 1.40e-05 | 1.95e-04 | 80 |
| GO:004689011 | Liver | Cirrhotic | regulation of lipid biosynthetic process | 67/4634 | 171/18723 | 2.00e-05 | 2.65e-04 | 67 |
| GO:001604212 | Liver | Cirrhotic | lipid catabolic process | 112/4634 | 320/18723 | 2.31e-05 | 3.03e-04 | 112 |
| GO:001087611 | Liver | Cirrhotic | lipid localization | 147/4634 | 448/18723 | 6.24e-05 | 7.12e-04 | 147 |
| GO:000686911 | Liver | Cirrhotic | lipid transport | 128/4634 | 398/18723 | 4.54e-04 | 3.69e-03 | 128 |
| GO:003010011 | Liver | Cirrhotic | regulation of endocytosis | 74/4634 | 211/18723 | 4.86e-04 | 3.90e-03 | 74 |
| Page: 1 2 3 4 |
| Pathway ID | Tissue | Disease Stage | Description | Gene Ratio | Bg Ratio | pvalue | p.adjust | qvalue | Count |
| hsa049792 | Liver | Cirrhotic | Cholesterol metabolism | 30/2530 | 51/8465 | 1.59e-05 | 1.39e-04 | 8.60e-05 | 30 |
| hsa049793 | Liver | Cirrhotic | Cholesterol metabolism | 30/2530 | 51/8465 | 1.59e-05 | 1.39e-04 | 8.60e-05 | 30 |
| hsa049794 | Liver | HCC | Cholesterol metabolism | 41/4020 | 51/8465 | 1.33e-06 | 1.35e-05 | 7.49e-06 | 41 |
| hsa049795 | Liver | HCC | Cholesterol metabolism | 41/4020 | 51/8465 | 1.33e-06 | 1.35e-05 | 7.49e-06 | 41 |
| Page: 1 |
Top |
Cell-cell communication analysis |
| Identification of potential cell-cell interactions between two cell types and their ligand-receptor pairs for different disease states |
| Ligand | Receptor | LRpair | Pathway | Tissue | Disease Stage |
| Page: 1 |
Top |
Single-cell gene regulatory network inference analysis |
| Find out the significant the regulons (TFs) and the target genes of each regulon across cell types for different disease states |
| TF | Cell Type | Tissue | Disease Stage | Target Gene | RSS | Regulon Activity |
| ∗The dot plots of a searched regulon are shown for all cell subpopulations in each disease state of each tissue based on the regulon specific score inferred using pySCENIC and by calculating the average expression. |
| Page: 1 |
Top |
Somatic mutation of malignant transformation related genes |
| Annotation of somatic variants for genes involved in malignant transformation |
| Hugo Symbol | Variant Class | Variant Classification | dbSNP RS | HGVSc | HGVSp | HGVSp Short | SWISSPROT | BIOTYPE | SIFT | PolyPhen | Tumor Sample Barcode | Tissue | Histology | Sex | Age | Stage | Therapy Types | Drugs | Outcome |
| APOC2 | SNV | Missense_Mutation | novel | c.130N>G | p.Leu44Val | p.L44V | P02655 | protein_coding | tolerated(0.06) | possibly_damaging(0.822) | TCGA-5L-AAT1-01 | Breast | breast invasive carcinoma | Female | <65 | III/IV | Hormone Therapy | letrozol | SD |
| APOC2 | SNV | Missense_Mutation | rs750370010 | c.163N>A | p.Ala55Thr | p.A55T | P02655 | protein_coding | tolerated(0.09) | probably_damaging(0.991) | TCGA-AA-3510-01 | Colorectum | colon adenocarcinoma | Male | >=65 | I/II | Unknown | Unknown | SD |
| APOC2 | SNV | Missense_Mutation | novel | c.197C>A | p.Ala66Asp | p.A66D | P02655 | protein_coding | tolerated(0.31) | benign(0.172) | TCGA-A5-A0G2-01 | Endometrium | uterine corpus endometrioid carcinoma | Female | <65 | III/IV | Unknown | Unknown | SD |
| APOC2 | SNV | Missense_Mutation | novel | c.265T>C | p.Phe89Leu | p.F89L | P02655 | protein_coding | tolerated(0.55) | benign(0.001) | TCGA-BK-A6W3-01 | Endometrium | uterine corpus endometrioid carcinoma | Female | <65 | I/II | Unknown | Unknown | SD |
| APOC2 | SNV | Missense_Mutation | novel | c.253N>C | p.Tyr85His | p.Y85H | P02655 | protein_coding | deleterious(0) | probably_damaging(0.988) | TCGA-FI-A2D5-01 | Endometrium | uterine corpus endometrioid carcinoma | Female | <65 | III/IV | Chemotherapy | carboplatinum | PD |
| APOC2 | SNV | Missense_Mutation | c.100C>G | p.Pro34Ala | p.P34A | P02655 | protein_coding | tolerated(0.12) | benign(0.096) | TCGA-95-A4VN-01 | Lung | lung adenocarcinoma | Female | <65 | I/II | Unknown | Unknown | SD | |
| APOC2 | SNV | Missense_Mutation | c.128C>G | p.Ser43Cys | p.S43C | P02655 | protein_coding | deleterious(0) | probably_damaging(0.971) | TCGA-60-2721-01 | Lung | lung squamous cell carcinoma | Male | >=65 | I/II | Unknown | Unknown | SD |
| Page: 1 |
Top |
Related drugs of malignant transformation related genes |
| Identification of chemicals and drugs interact with genes involved in malignant transfromation |
| (DGIdb 4.0) |
| Entrez ID | Symbol | Category | Interaction Types | Drug Claim Name | Drug Name | PMIDs |
| Page: 1 |

Copyright 2023-Present -The University of Texas Health Science Center at Houston |