
|
|||||
|
 | |
| |
| |
| |
| |
| |
|
Gene: APOC1 |
Gene summary for APOC1 |
| Gene information | Species | Human | Gene symbol | APOC1 | Gene ID | 341 |
| Gene name | apolipoprotein C1 | |
| Gene Alias | Apo-CI | |
| Cytomap | 19q13.32 | |
| Gene Type | protein-coding | GO ID | GO:0006082 | UniProtAcc | A0A024R0T8 |
Top |
Malignant transformation analysis |
| Identification of the aberrant gene expression in precancerous and cancerous lesions by comparing the gene expression of stem-like cells in diseased tissues with normal stem cells |
| Entrez ID | Symbol | Replicates | Species | Organ | Tissue | Adj P-value | Log2FC | Malignancy |
| 341 | APOC1 | GSM4909299 | Human | Breast | IDC | 2.52e-05 | 2.81e-01 | 0.035 |
| 341 | APOC1 | GSM4909312 | Human | Breast | IDC | 1.48e-02 | -1.11e-01 | 0.1552 |
| 341 | APOC1 | GSM4909319 | Human | Breast | IDC | 3.70e-03 | -5.44e-02 | 0.1563 |
| 341 | APOC1 | NCCBC14 | Human | Breast | DCIS | 6.92e-23 | 1.05e+00 | 0.2021 |
| 341 | APOC1 | NCCBC2 | Human | Breast | DCIS | 4.75e-02 | 4.26e-01 | 0.1554 |
| 341 | APOC1 | NCCBC3 | Human | Breast | DCIS | 2.68e-34 | 9.19e-01 | 0.1198 |
| 341 | APOC1 | NCCBC5 | Human | Breast | DCIS | 1.67e-25 | 1.02e+00 | 0.2046 |
| 341 | APOC1 | P1 | Human | Breast | IDC | 1.81e-03 | 2.74e-01 | 0.1527 |
| 341 | APOC1 | DCIS2 | Human | Breast | DCIS | 1.39e-07 | -4.99e-02 | 0.0085 |
| 341 | APOC1 | LZE21T | Human | Esophagus | ESCC | 6.52e-07 | 2.62e-01 | 0.0655 |
| 341 | APOC1 | LZE6T | Human | Esophagus | ESCC | 1.04e-04 | 5.54e-01 | 0.0845 |
| 341 | APOC1 | P2T-E | Human | Esophagus | ESCC | 5.91e-04 | 8.41e-02 | 0.1177 |
| 341 | APOC1 | P4T-E | Human | Esophagus | ESCC | 4.19e-14 | 5.17e-01 | 0.1323 |
| 341 | APOC1 | P5T-E | Human | Esophagus | ESCC | 2.85e-10 | 2.42e-01 | 0.1327 |
| 341 | APOC1 | P8T-E | Human | Esophagus | ESCC | 1.48e-05 | 1.50e-01 | 0.0889 |
| 341 | APOC1 | P10T-E | Human | Esophagus | ESCC | 2.04e-34 | 7.39e-01 | 0.116 |
| 341 | APOC1 | P12T-E | Human | Esophagus | ESCC | 4.14e-16 | 3.75e-01 | 0.1122 |
| 341 | APOC1 | P15T-E | Human | Esophagus | ESCC | 2.35e-02 | 1.03e-01 | 0.1149 |
| 341 | APOC1 | P22T-E | Human | Esophagus | ESCC | 1.83e-18 | 3.73e-01 | 0.1236 |
| 341 | APOC1 | P24T-E | Human | Esophagus | ESCC | 2.25e-03 | 1.35e-01 | 0.1287 |
| Page: 1 2 3 4 5 |
| Tissue | Expression Dynamics | Abbreviation |
| Breast |  | IDC: Invasive ductal carcinoma |
| DCIS: Ductal carcinoma in situ | ||
| Precancer(BRCA1-mut): Precancerous lesion from BRCA1 mutation carriers | ||
| Esophagus | 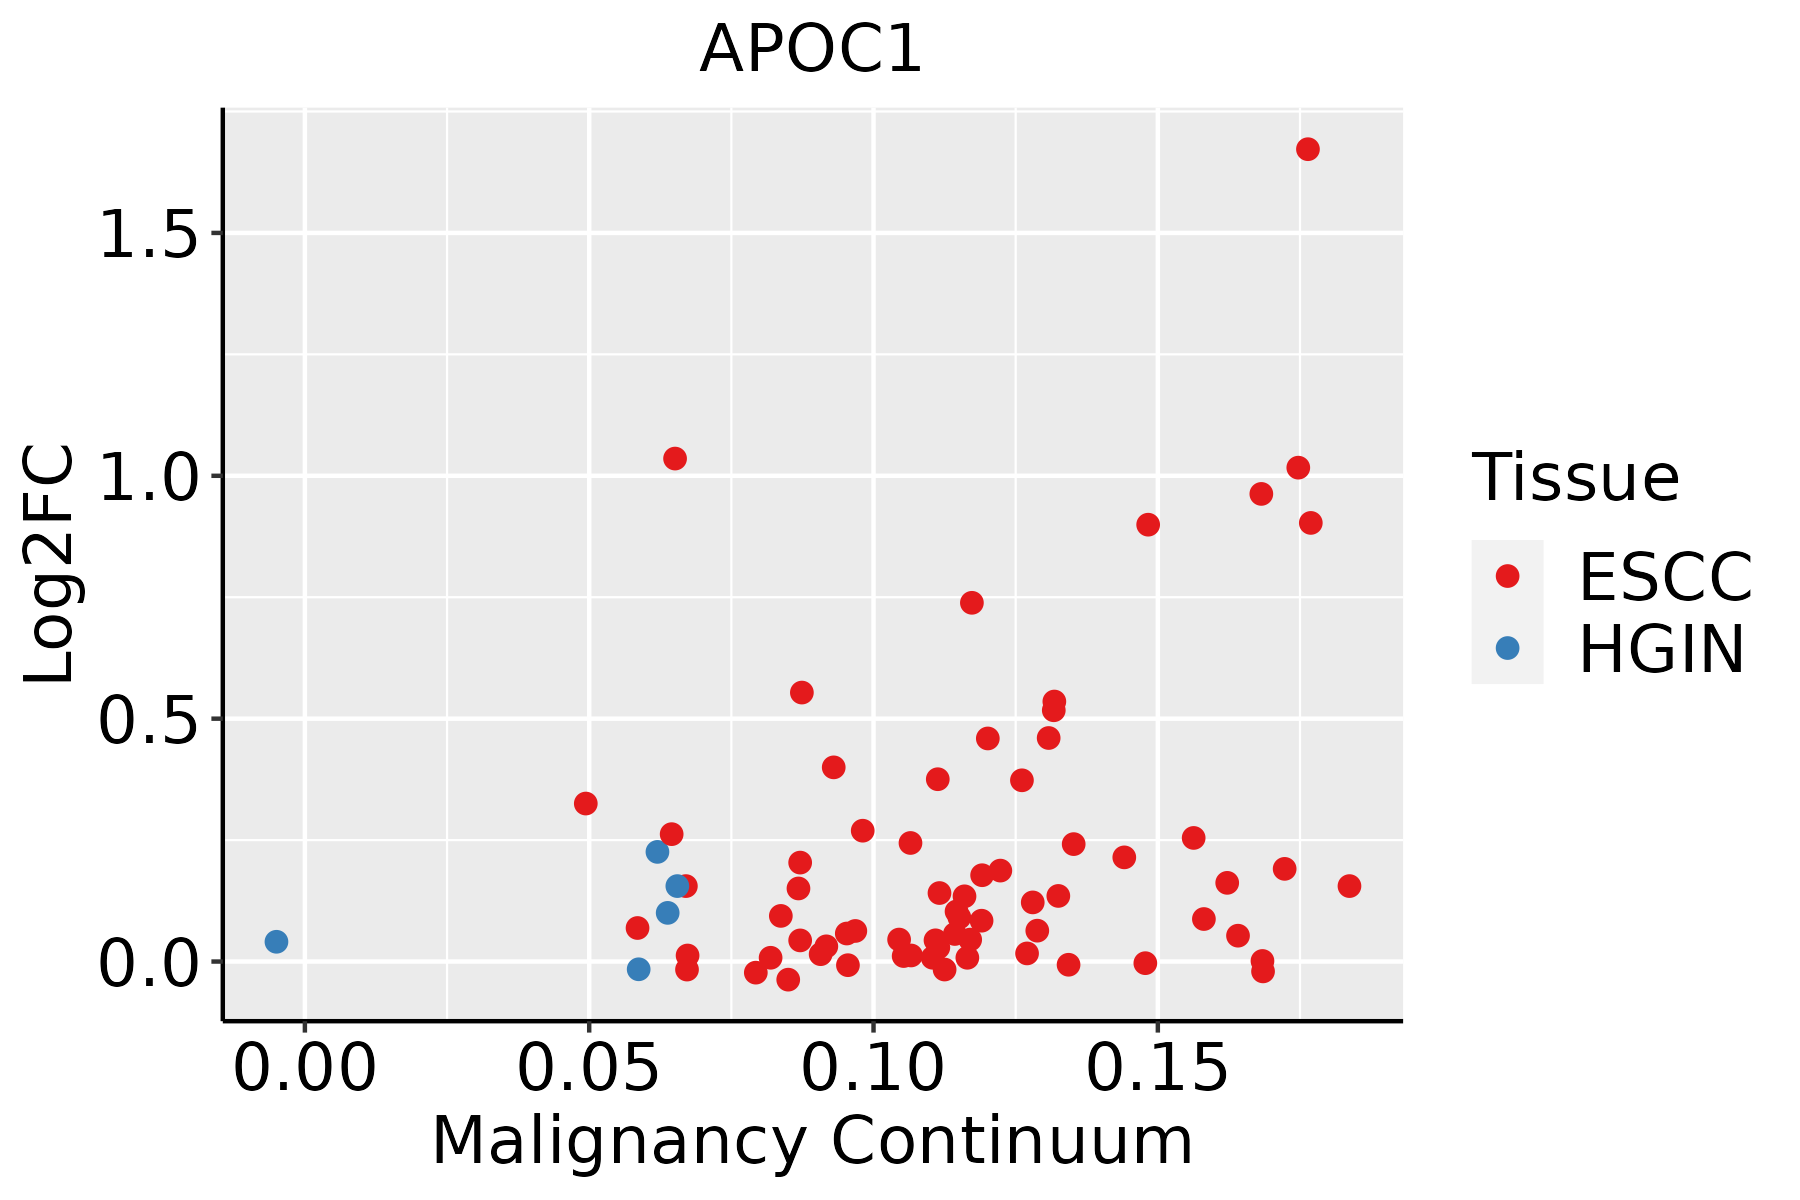 | ESCC: Esophageal squamous cell carcinoma |
| HGIN: High-grade intraepithelial neoplasias | ||
| LGIN: Low-grade intraepithelial neoplasias | ||
| Liver | 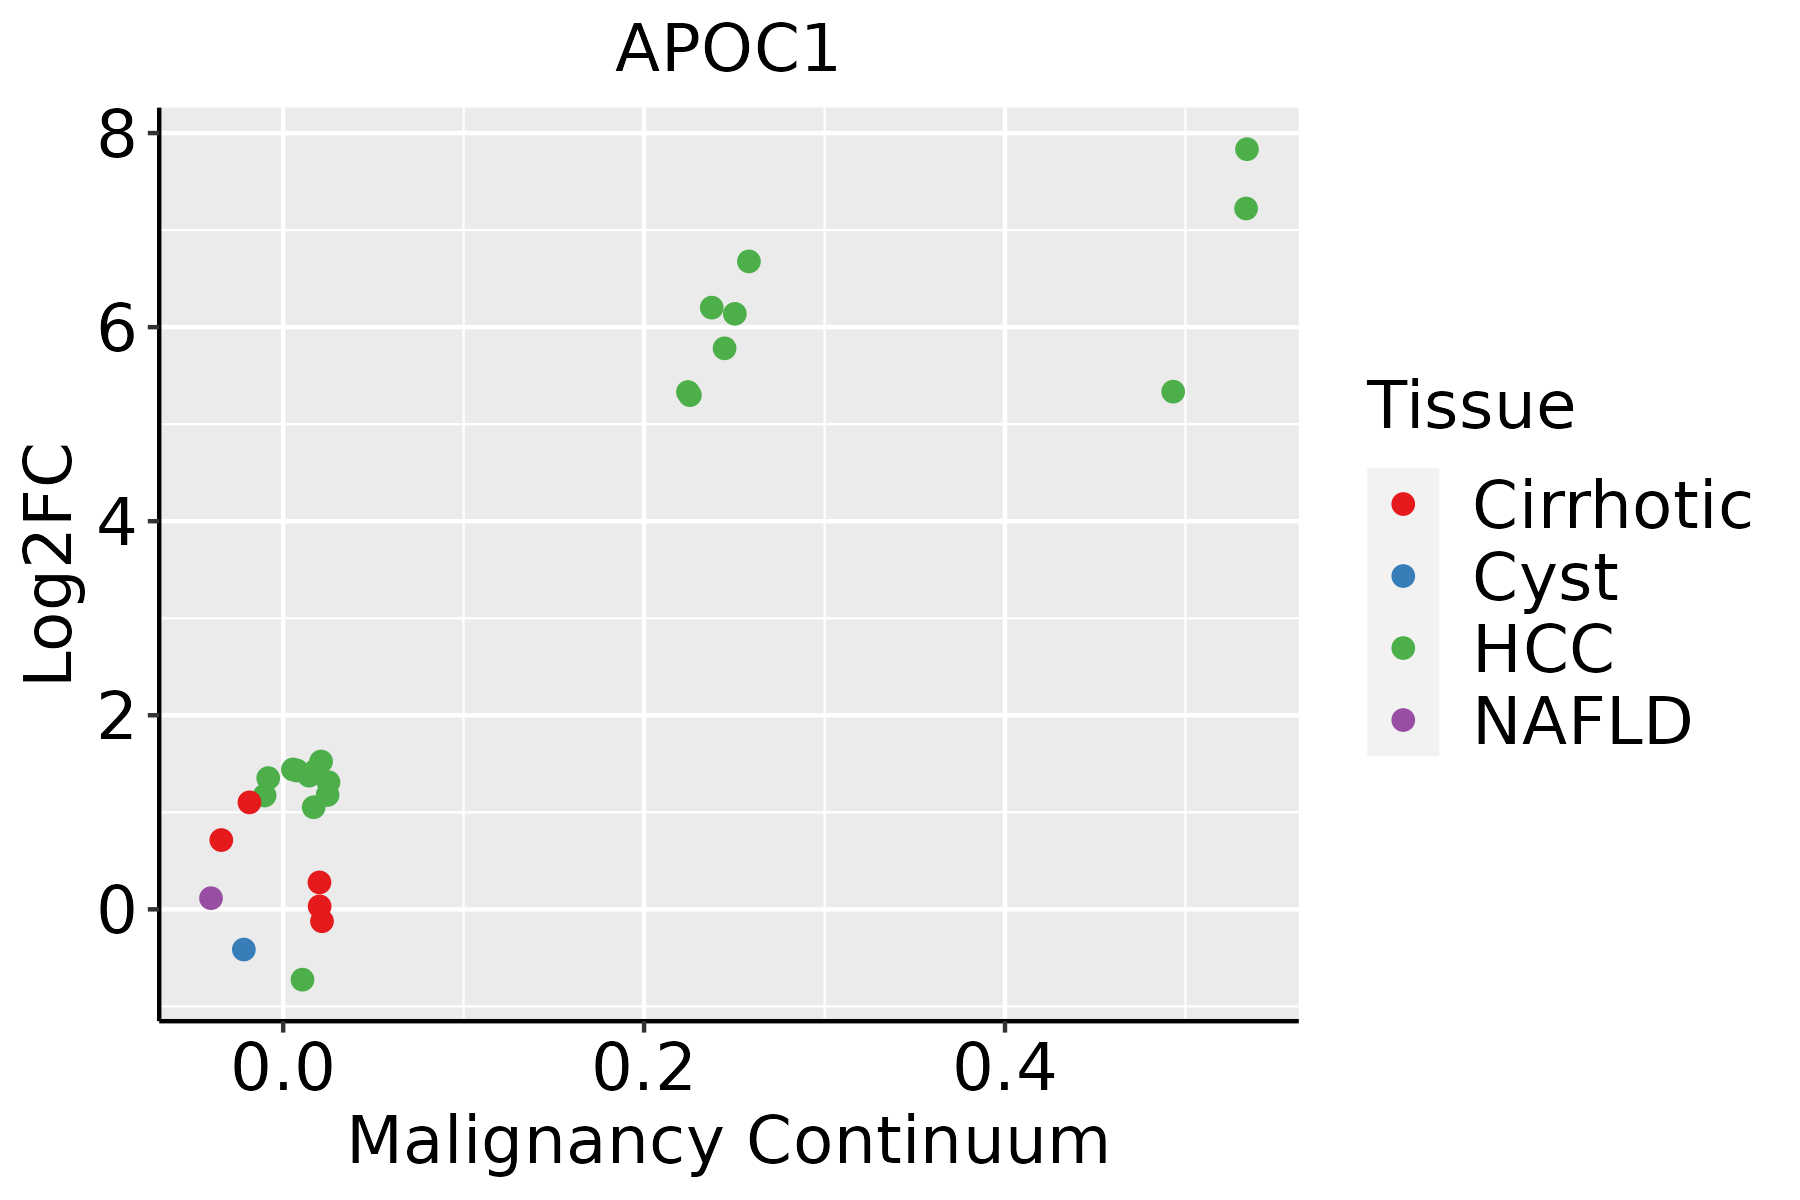 | HCC: Hepatocellular carcinoma |
| NAFLD: Non-alcoholic fatty liver disease | ||
| Oral Cavity | 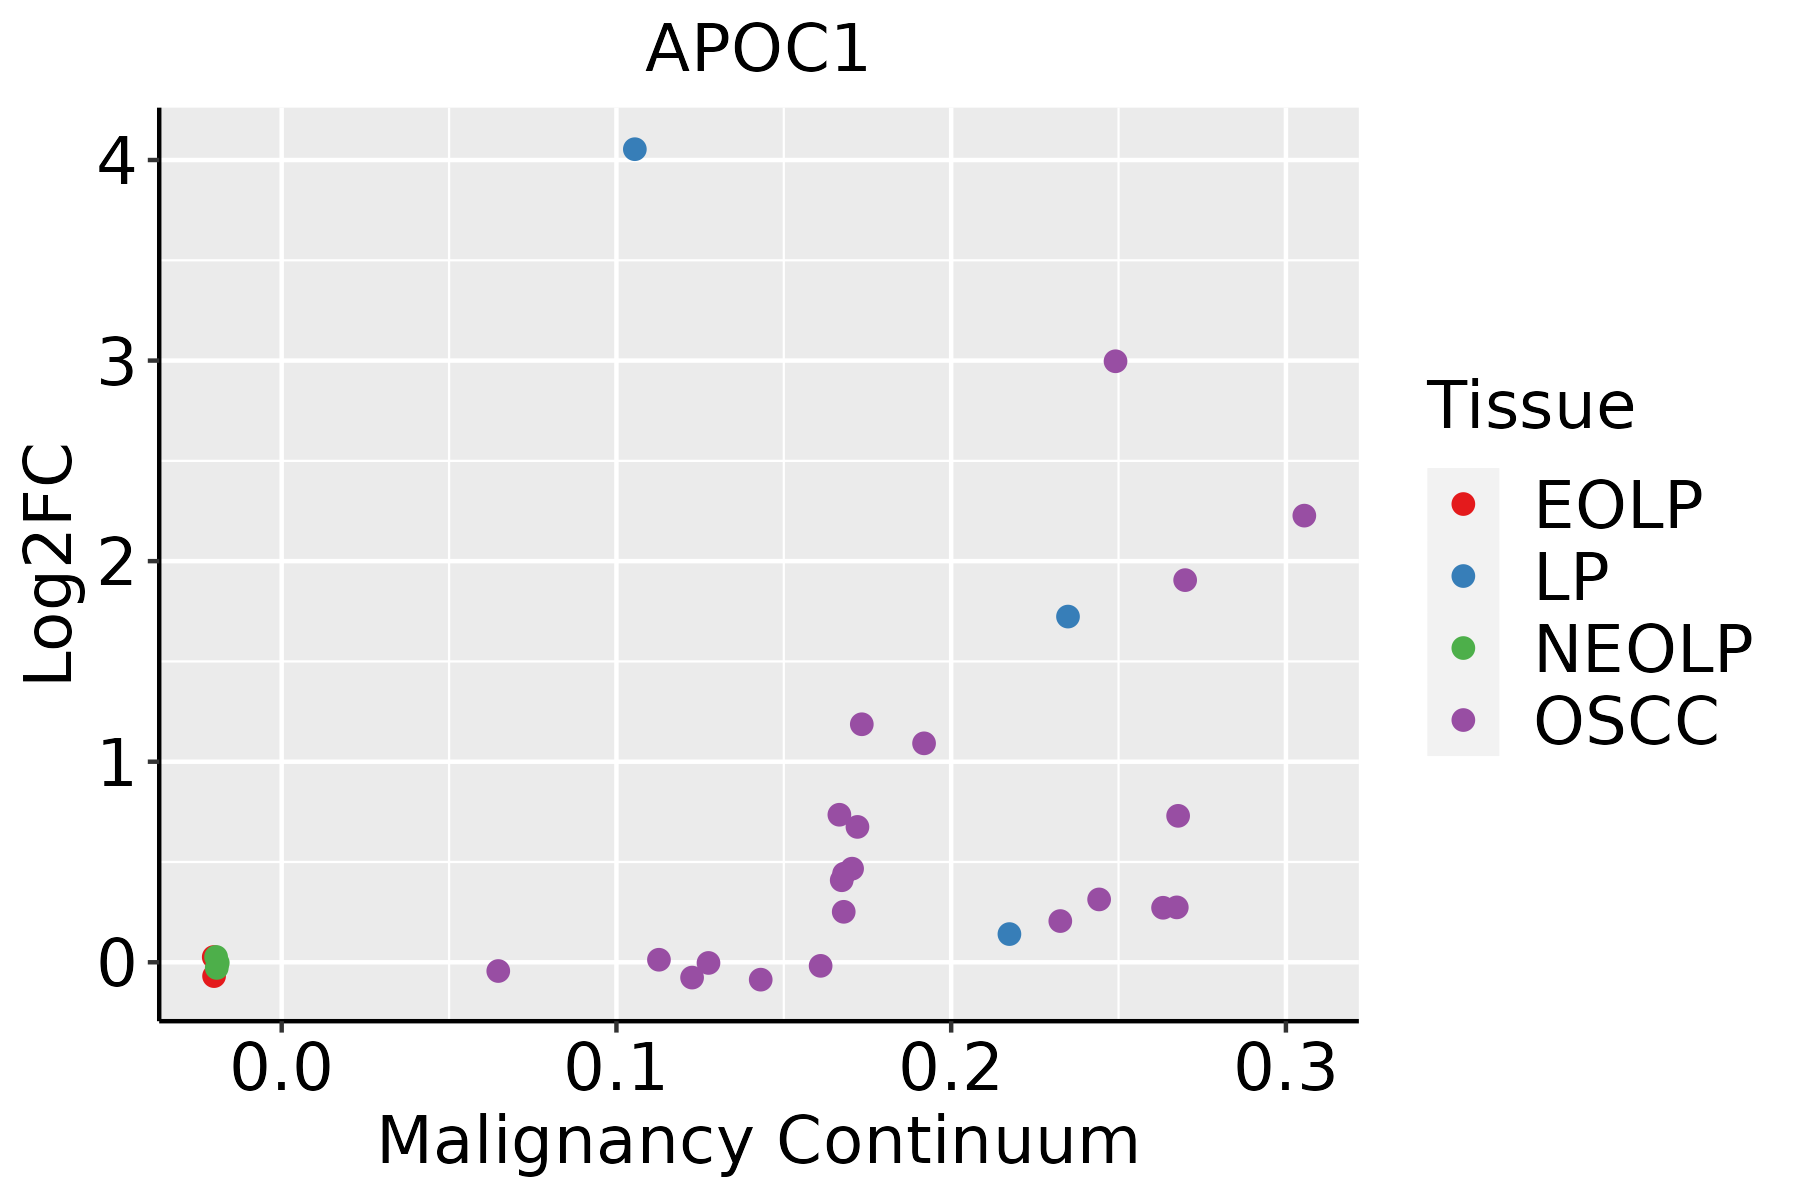 | EOLP: Erosive Oral lichen planus |
| LP: leukoplakia | ||
| NEOLP: Non-erosive oral lichen planus | ||
| OSCC: Oral squamous cell carcinoma | ||
| Skin | 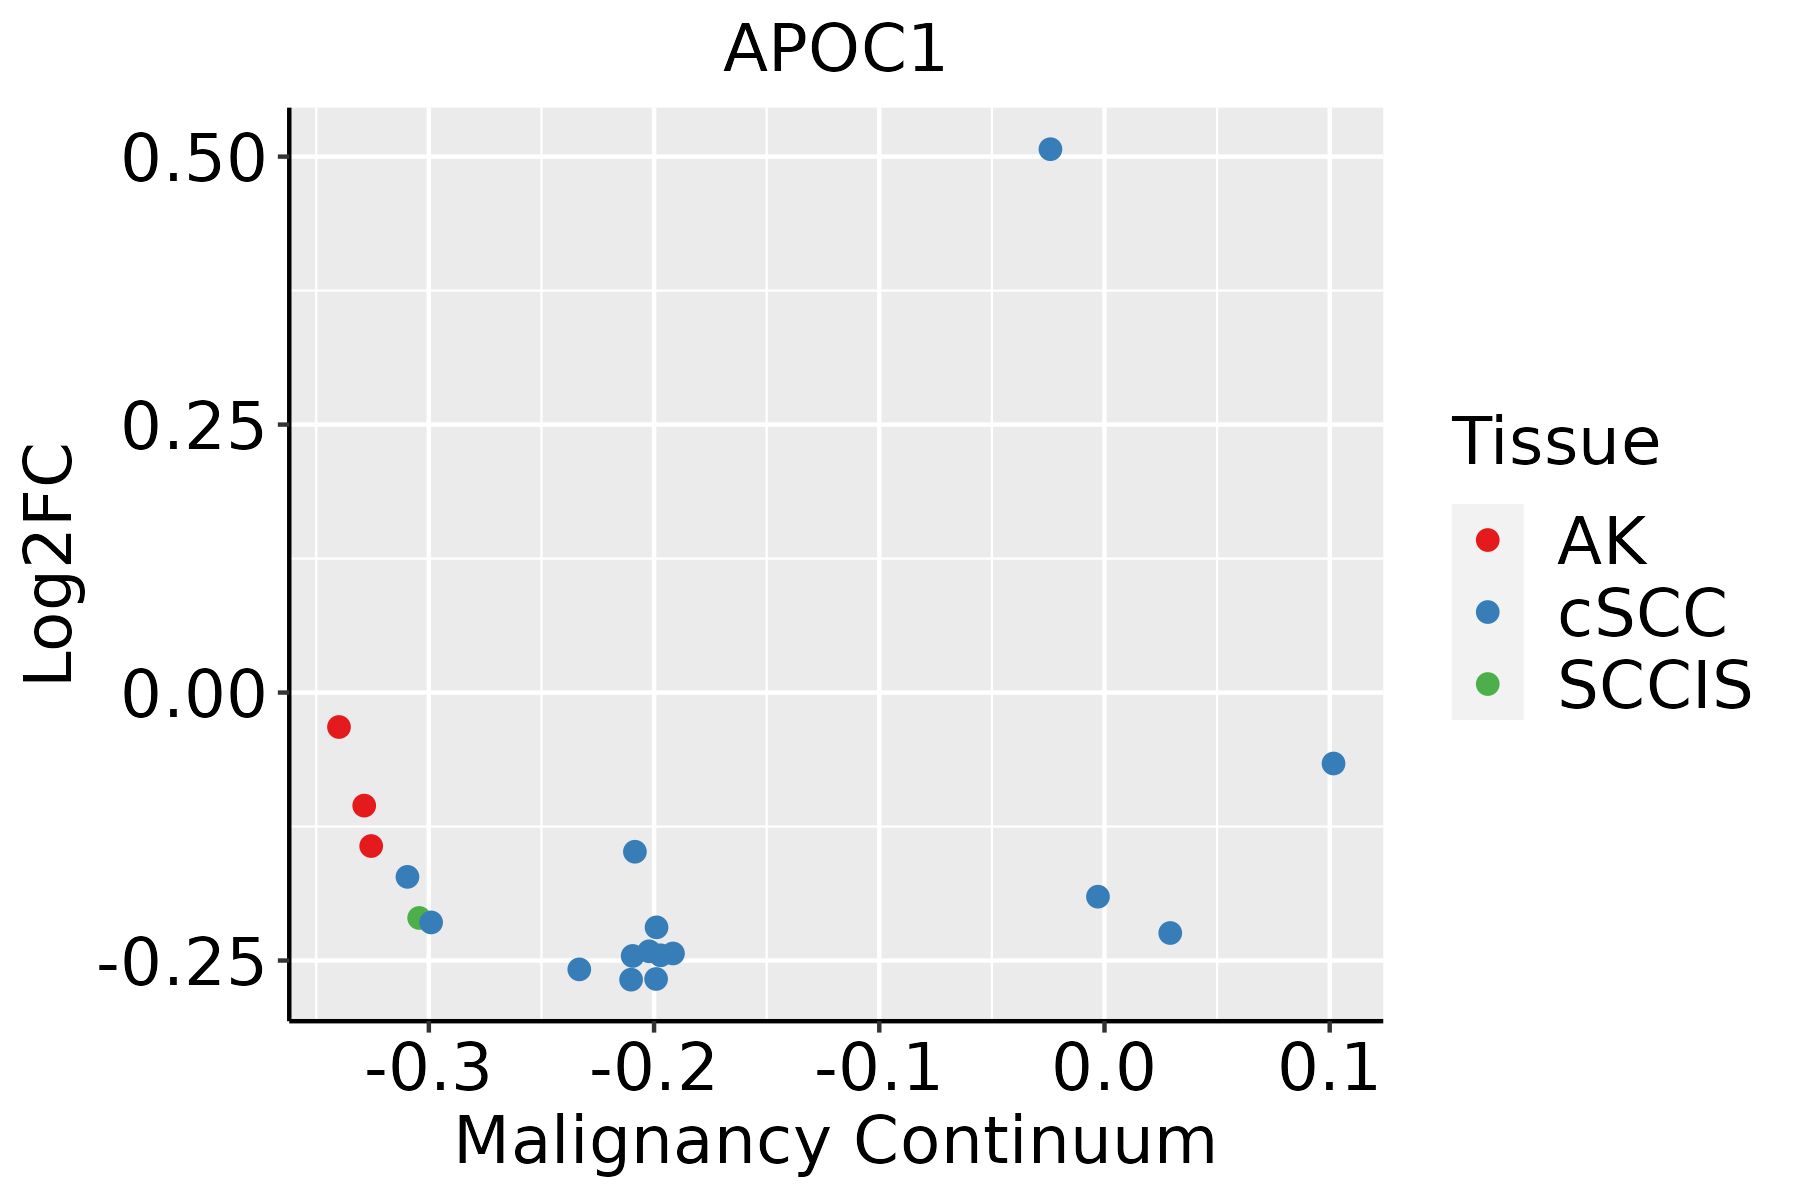 | AK: Actinic keratosis |
| cSCC: Cutaneous squamous cell carcinoma | ||
| SCCIS:squamous cell carcinoma in situ | ||
| Thyroid | 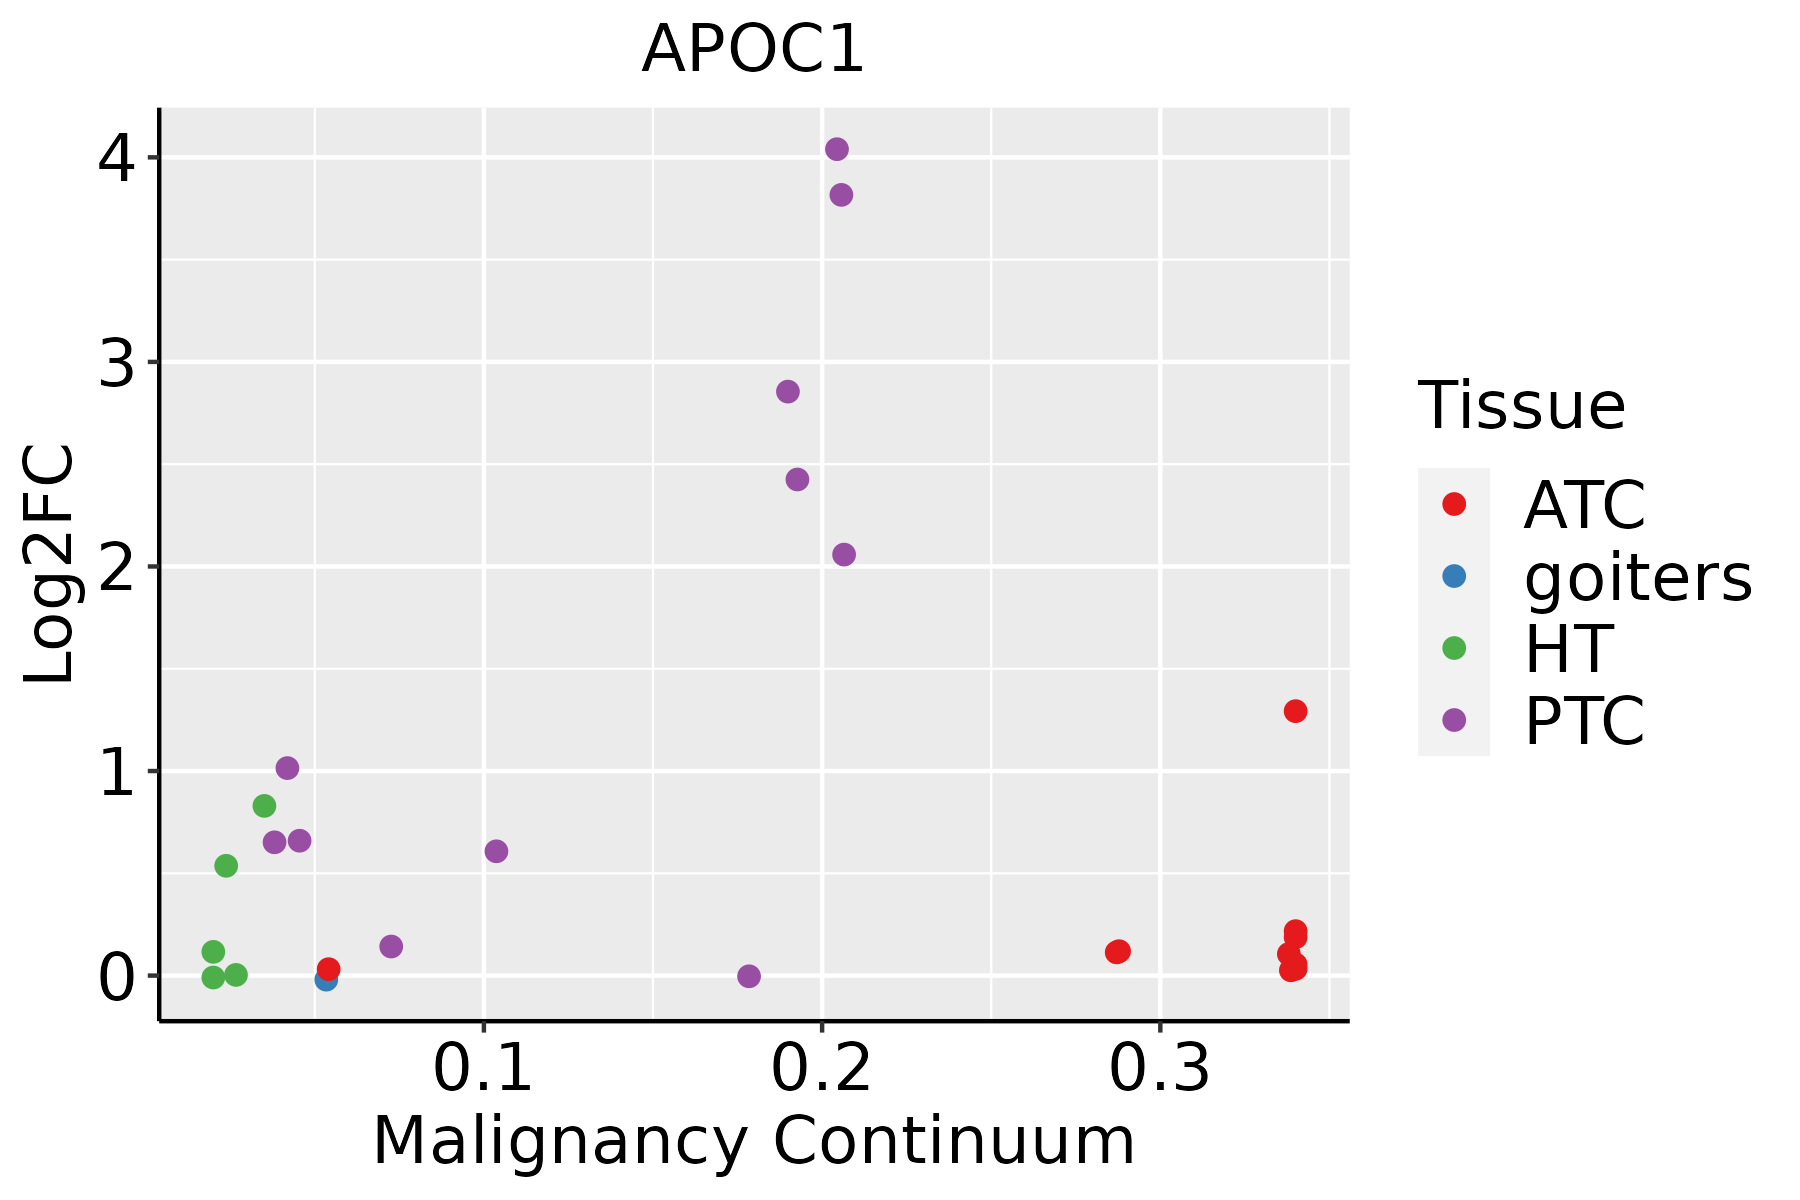 | ATC: Anaplastic thyroid cancer |
| HT: Hashimoto's thyroiditis | ||
| PTC: Papillary thyroid cancer |
| ∗log2FC in expression of this searched gene in stem-like cells from each diseased tissue sample relative to stem-like cells in normal samples in each tissue plotted against the malignancy continuum. Samples are colored based on if they are from different disease stage. |
Top |
Malignant transformation related pathway analysis |
| Find out the enriched GO biological processes and KEGG pathways involved in transition from healthy to precancer to cancer |
| Tissue | Disease Stage | Enriched GO biological Processes |
| Colorectum | AD |  |
| Colorectum | SER |  |
| Colorectum | MSS |  |
| Colorectum | MSI-H |  |
| Colorectum | FAP |  |
| ∗Top 15 enriched GO BP terms are showed in the bar plot of each disease state in each tissue. Each row represents a significant GO biological process which is colored according to the -log10(p.adjust). |
| Page: 1 2 3 4 5 6 7 8 9 |
| GO ID | Tissue | Disease Stage | Description | Gene Ratio | Bg Ratio | pvalue | p.adjust | Count |
| GO:005134613 | Breast | IDC | negative regulation of hydrolase activity | 71/1434 | 379/18723 | 1.33e-12 | 2.90e-10 | 71 |
| GO:001921612 | Breast | IDC | regulation of lipid metabolic process | 45/1434 | 331/18723 | 1.21e-04 | 2.24e-03 | 45 |
| GO:003133014 | Breast | IDC | negative regulation of cellular catabolic process | 37/1434 | 262/18723 | 2.20e-04 | 3.52e-03 | 37 |
| GO:000689813 | Breast | IDC | receptor-mediated endocytosis | 35/1434 | 244/18723 | 2.38e-04 | 3.75e-03 | 35 |
| GO:00192184 | Breast | IDC | regulation of steroid metabolic process | 18/1434 | 100/18723 | 5.40e-04 | 6.96e-03 | 18 |
| GO:00468904 | Breast | IDC | regulation of lipid biosynthetic process | 26/1434 | 171/18723 | 5.92e-04 | 7.50e-03 | 26 |
| GO:00459369 | Breast | IDC | negative regulation of phosphate metabolic process | 53/1434 | 441/18723 | 7.21e-04 | 8.79e-03 | 53 |
| GO:00105639 | Breast | IDC | negative regulation of phosphorus metabolic process | 53/1434 | 442/18723 | 7.60e-04 | 9.25e-03 | 53 |
| GO:000989514 | Breast | IDC | negative regulation of catabolic process | 40/1434 | 320/18723 | 1.49e-03 | 1.50e-02 | 40 |
| GO:007233012 | Breast | IDC | monocarboxylic acid biosynthetic process | 29/1434 | 214/18723 | 1.91e-03 | 1.83e-02 | 29 |
| GO:001605313 | Breast | IDC | organic acid biosynthetic process | 39/1434 | 316/18723 | 2.13e-03 | 1.99e-02 | 39 |
| GO:000663312 | Breast | IDC | fatty acid biosynthetic process | 23/1434 | 163/18723 | 3.21e-03 | 2.70e-02 | 23 |
| GO:004639413 | Breast | IDC | carboxylic acid biosynthetic process | 38/1434 | 314/18723 | 3.39e-03 | 2.83e-02 | 38 |
| GO:004230411 | Breast | IDC | regulation of fatty acid biosynthetic process | 10/1434 | 49/18723 | 3.51e-03 | 2.90e-02 | 10 |
| GO:00301007 | Breast | IDC | regulation of endocytosis | 27/1434 | 211/18723 | 5.92e-03 | 4.26e-02 | 27 |
| GO:005134623 | Breast | DCIS | negative regulation of hydrolase activity | 64/1390 | 379/18723 | 4.32e-10 | 4.80e-08 | 64 |
| GO:003133024 | Breast | DCIS | negative regulation of cellular catabolic process | 37/1390 | 262/18723 | 1.18e-04 | 2.07e-03 | 37 |
| GO:000689823 | Breast | DCIS | receptor-mediated endocytosis | 35/1390 | 244/18723 | 1.31e-04 | 2.25e-03 | 35 |
| GO:001921621 | Breast | DCIS | regulation of lipid metabolic process | 43/1390 | 331/18723 | 2.37e-04 | 3.71e-03 | 43 |
| GO:004593614 | Breast | DCIS | negative regulation of phosphate metabolic process | 53/1390 | 441/18723 | 3.48e-04 | 4.96e-03 | 53 |
| Page: 1 2 3 4 5 6 7 8 9 10 11 |
| Pathway ID | Tissue | Disease Stage | Description | Gene Ratio | Bg Ratio | pvalue | p.adjust | qvalue | Count |
| hsa049792 | Liver | Cirrhotic | Cholesterol metabolism | 30/2530 | 51/8465 | 1.59e-05 | 1.39e-04 | 8.60e-05 | 30 |
| hsa049793 | Liver | Cirrhotic | Cholesterol metabolism | 30/2530 | 51/8465 | 1.59e-05 | 1.39e-04 | 8.60e-05 | 30 |
| hsa049794 | Liver | HCC | Cholesterol metabolism | 41/4020 | 51/8465 | 1.33e-06 | 1.35e-05 | 7.49e-06 | 41 |
| hsa049795 | Liver | HCC | Cholesterol metabolism | 41/4020 | 51/8465 | 1.33e-06 | 1.35e-05 | 7.49e-06 | 41 |
| Page: 1 |
Top |
Cell-cell communication analysis |
| Identification of potential cell-cell interactions between two cell types and their ligand-receptor pairs for different disease states |
| Ligand | Receptor | LRpair | Pathway | Tissue | Disease Stage |
| Page: 1 |
Top |
Single-cell gene regulatory network inference analysis |
| Find out the significant the regulons (TFs) and the target genes of each regulon across cell types for different disease states |
| TF | Cell Type | Tissue | Disease Stage | Target Gene | RSS | Regulon Activity |
| ∗The dot plots of a searched regulon are shown for all cell subpopulations in each disease state of each tissue based on the regulon specific score inferred using pySCENIC and by calculating the average expression. |
| Page: 1 |
Top |
Somatic mutation of malignant transformation related genes |
| Annotation of somatic variants for genes involved in malignant transformation |
| Hugo Symbol | Variant Class | Variant Classification | dbSNP RS | HGVSc | HGVSp | HGVSp Short | SWISSPROT | BIOTYPE | SIFT | PolyPhen | Tumor Sample Barcode | Tissue | Histology | Sex | Age | Stage | Therapy Types | Drugs | Outcome |
| APOC1 | insertion | Frame_Shift_Ins | novel | c.172_194+17dupAGTGAACTTTCTGCCAAGATGCGGTTAGAACCCTTCCCAG | P02654 | protein_coding | TCGA-VS-A94X-01 | Cervix | cervical & endocervical cancer | Female | <65 | I/II | Chemotherapy | cisplatin | PD | ||||
| APOC1 | SNV | Missense_Mutation | rs369438021 | c.161G>A | p.Arg54His | p.R54H | P02654 | protein_coding | tolerated(0.63) | benign(0) | TCGA-AP-A0LM-01 | Endometrium | uterine corpus endometrioid carcinoma | Female | <65 | III/IV | Chemotherapy | cisplatin | SD |
| APOC1 | SNV | Missense_Mutation | c.224N>C | p.Val75Ala | p.V75A | P02654 | protein_coding | deleterious(0.01) | benign(0.031) | TCGA-BS-A0UJ-01 | Endometrium | uterine corpus endometrioid carcinoma | Female | >=65 | I/II | Unknown | Unknown | SD | |
| APOC1 | SNV | Missense_Mutation | c.205N>C | p.Ser69Pro | p.S69P | P02654 | protein_coding | deleterious(0.01) | benign(0.005) | TCGA-D1-A16X-01 | Endometrium | uterine corpus endometrioid carcinoma | Female | <65 | I/II | Unknown | Unknown | SD | |
| APOC1 | SNV | Missense_Mutation | novel | c.86N>G | p.Asp29Gly | p.D29G | P02654 | protein_coding | deleterious(0.04) | benign(0.076) | TCGA-XR-A8TD-01 | Liver | liver hepatocellular carcinoma | Female | <65 | III/IV | Unknown | Unknown | SD |
| APOC1 | SNV | Missense_Mutation | novel | c.194G>T | p.Arg65Leu | p.R65L | P02654 | protein_coding | deleterious(0.01) | possibly_damaging(0.689) | TCGA-55-7907-01 | Lung | lung adenocarcinoma | Male | >=65 | I/II | Unknown | Unknown | PD |
| APOC1 | SNV | Missense_Mutation | novel | c.113A>G | p.Lys38Arg | p.K38R | P02654 | protein_coding | deleterious(0.03) | probably_damaging(0.969) | TCGA-95-7567-01 | Lung | lung adenocarcinoma | Male | <65 | I/II | Chemotherapy | cisplatin | SD |
| APOC1 | SNV | Missense_Mutation | rs760666016 | c.156N>G | p.Ile52Met | p.I52M | P02654 | protein_coding | deleterious(0.01) | possibly_damaging(0.546) | TCGA-CR-7394-01 | Oral cavity | head & neck squamous cell carcinoma | Male | >=65 | I/II | Unknown | Unknown | SD |
| APOC1 | SNV | Missense_Mutation | novel | c.114G>T | p.Lys38Asn | p.K38N | P02654 | protein_coding | deleterious(0.01) | probably_damaging(0.99) | TCGA-XK-AAIW-01 | Prostate | prostate adenocarcinoma | Male | >=65 | 9 | Unknown | Unknown | PD |
| Page: 1 |
Top |
Related drugs of malignant transformation related genes |
| Identification of chemicals and drugs interact with genes involved in malignant transfromation |
| (DGIdb 4.0) |
| Entrez ID | Symbol | Category | Interaction Types | Drug Claim Name | Drug Name | PMIDs |
| Page: 1 |

Copyright 2023-Present -The University of Texas Health Science Center at Houston |