
|
|||||
|
 | |
| |
| |
| |
| |
| |
|
Gene: APOBEC3G |
Gene summary for APOBEC3G |
| Gene information | Species | Human | Gene symbol | APOBEC3G | Gene ID | 60489 |
| Gene name | apolipoprotein B mRNA editing enzyme catalytic subunit 3G | |
| Gene Alias | A3G | |
| Cytomap | 22q13.1 | |
| Gene Type | protein-coding | GO ID | GO:0002230 | UniProtAcc | Q9HC16 |
Top |
Malignant transformation analysis |
| Identification of the aberrant gene expression in precancerous and cancerous lesions by comparing the gene expression of stem-like cells in diseased tissues with normal stem cells |
| Entrez ID | Symbol | Replicates | Species | Organ | Tissue | Adj P-value | Log2FC | Malignancy |
| 60489 | APOBEC3G | LZE4T | Human | Esophagus | ESCC | 8.84e-09 | 3.12e-01 | 0.0811 |
| 60489 | APOBEC3G | LZE7T | Human | Esophagus | ESCC | 5.28e-03 | 3.10e-01 | 0.0667 |
| 60489 | APOBEC3G | LZE8T | Human | Esophagus | ESCC | 5.10e-04 | 2.09e-01 | 0.067 |
| 60489 | APOBEC3G | LZE20T | Human | Esophagus | ESCC | 2.72e-03 | 1.40e-01 | 0.0662 |
| 60489 | APOBEC3G | LZE6T | Human | Esophagus | ESCC | 1.13e-13 | 7.49e-01 | 0.0845 |
| 60489 | APOBEC3G | P2T-E | Human | Esophagus | ESCC | 2.75e-18 | 3.53e-01 | 0.1177 |
| 60489 | APOBEC3G | P4T-E | Human | Esophagus | ESCC | 2.23e-15 | 2.36e-01 | 0.1323 |
| 60489 | APOBEC3G | P5T-E | Human | Esophagus | ESCC | 1.55e-08 | 2.04e-01 | 0.1327 |
| 60489 | APOBEC3G | P8T-E | Human | Esophagus | ESCC | 2.17e-11 | 1.49e-01 | 0.0889 |
| 60489 | APOBEC3G | P9T-E | Human | Esophagus | ESCC | 4.61e-06 | 1.38e-01 | 0.1131 |
| 60489 | APOBEC3G | P11T-E | Human | Esophagus | ESCC | 3.76e-11 | 3.65e-01 | 0.1426 |
| 60489 | APOBEC3G | P12T-E | Human | Esophagus | ESCC | 2.77e-15 | 2.53e-01 | 0.1122 |
| 60489 | APOBEC3G | P15T-E | Human | Esophagus | ESCC | 7.07e-13 | 2.81e-01 | 0.1149 |
| 60489 | APOBEC3G | P16T-E | Human | Esophagus | ESCC | 2.88e-13 | 2.81e-01 | 0.1153 |
| 60489 | APOBEC3G | P17T-E | Human | Esophagus | ESCC | 6.08e-03 | 1.50e-01 | 0.1278 |
| 60489 | APOBEC3G | P20T-E | Human | Esophagus | ESCC | 8.90e-03 | 6.42e-02 | 0.1124 |
| 60489 | APOBEC3G | P21T-E | Human | Esophagus | ESCC | 1.76e-18 | 3.64e-01 | 0.1617 |
| 60489 | APOBEC3G | P22T-E | Human | Esophagus | ESCC | 1.90e-08 | 1.70e-01 | 0.1236 |
| 60489 | APOBEC3G | P23T-E | Human | Esophagus | ESCC | 1.10e-10 | 3.13e-01 | 0.108 |
| 60489 | APOBEC3G | P24T-E | Human | Esophagus | ESCC | 1.67e-05 | 1.42e-01 | 0.1287 |
| Page: 1 2 3 |
| Tissue | Expression Dynamics | Abbreviation |
| Esophagus | 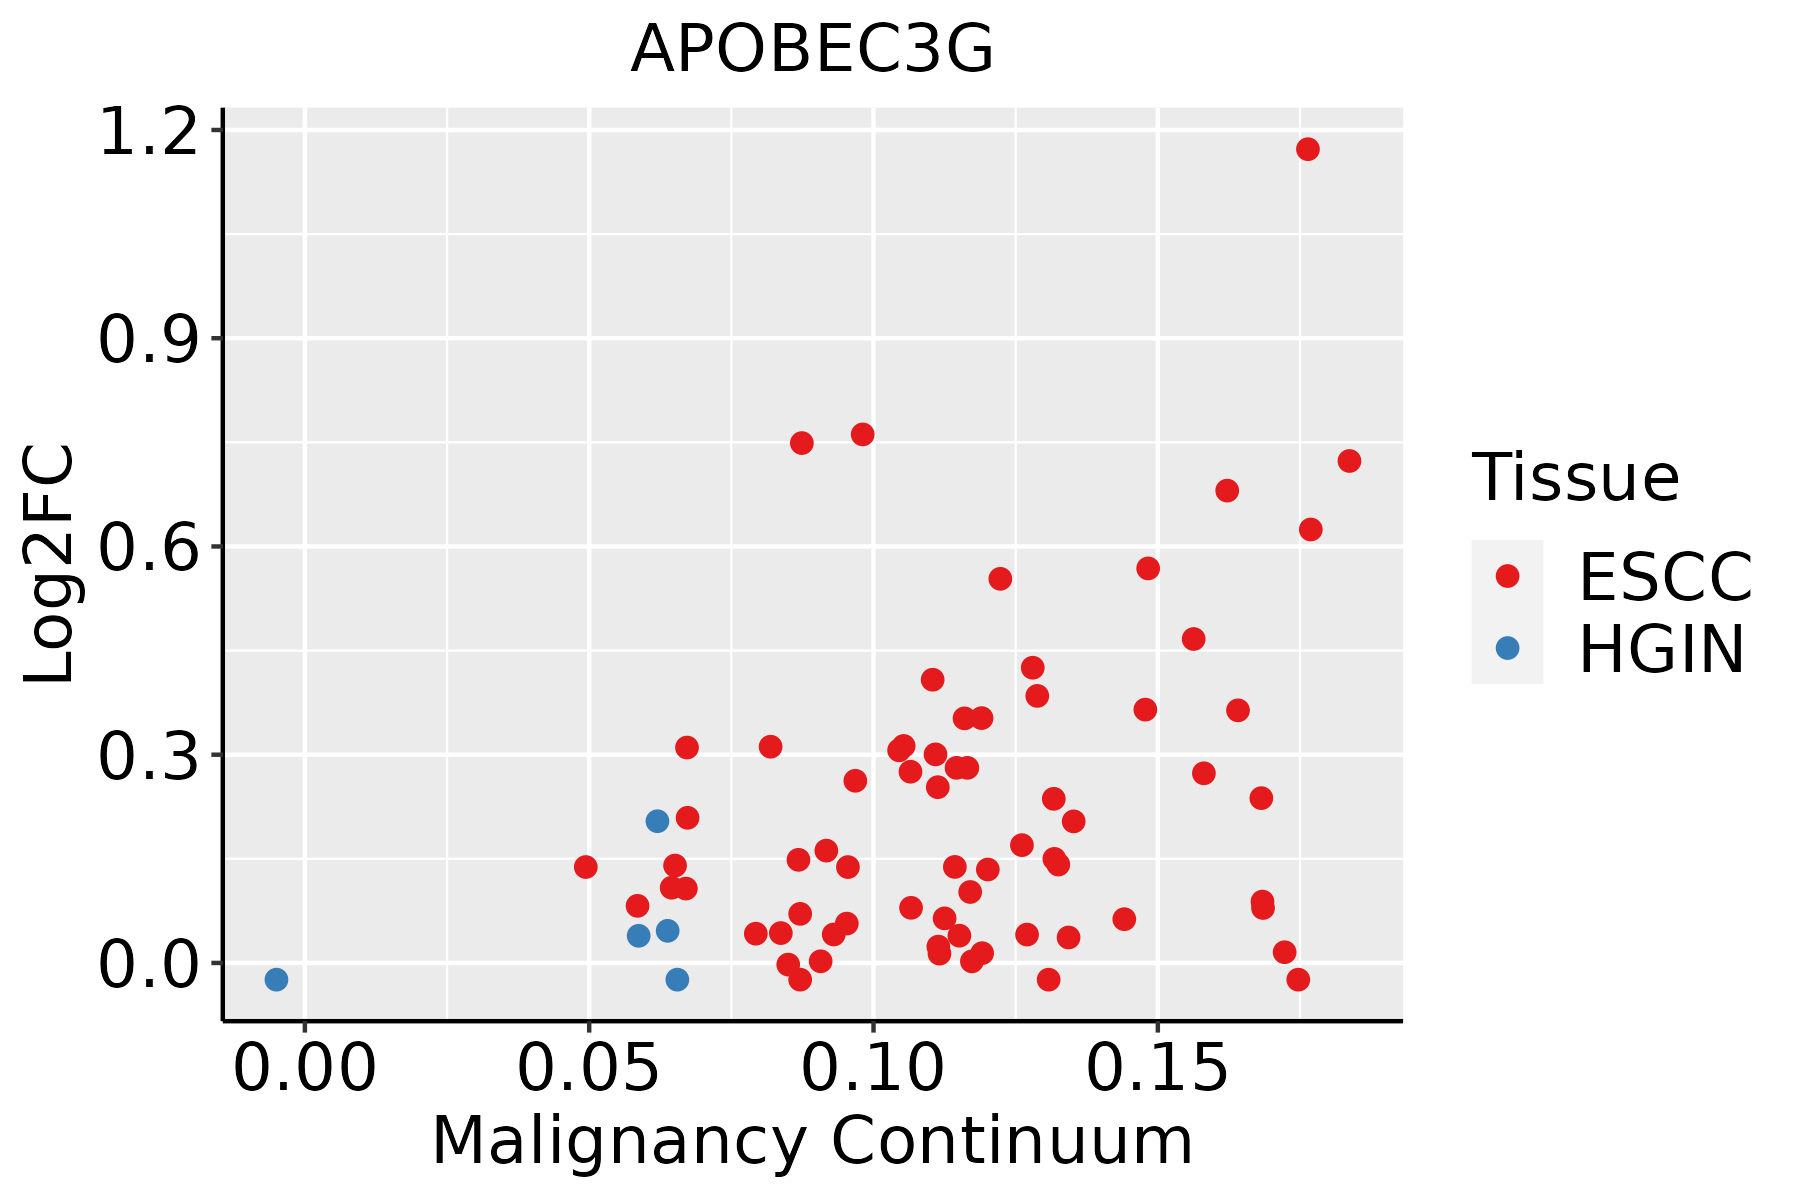 | ESCC: Esophageal squamous cell carcinoma |
| HGIN: High-grade intraepithelial neoplasias | ||
| LGIN: Low-grade intraepithelial neoplasias | ||
| Oral Cavity | 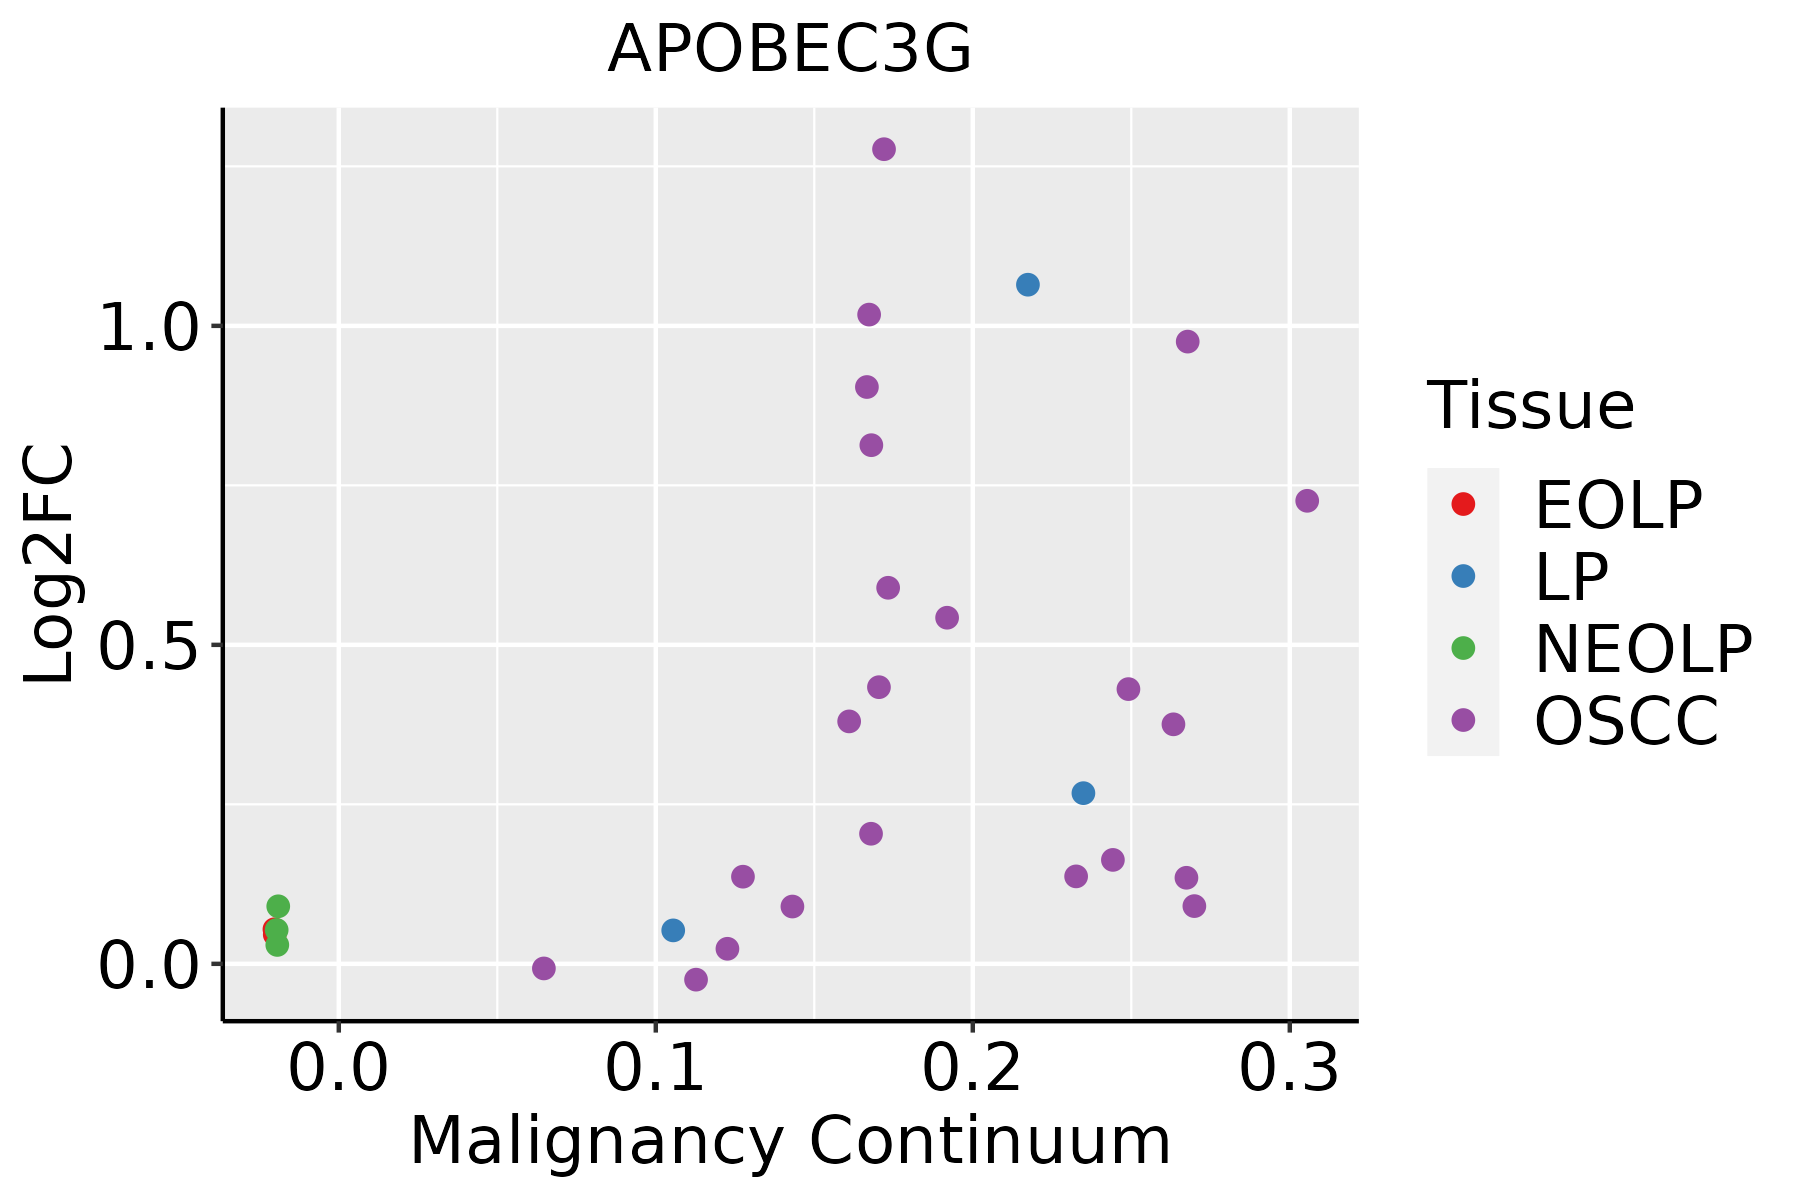 | EOLP: Erosive Oral lichen planus |
| LP: leukoplakia | ||
| NEOLP: Non-erosive oral lichen planus | ||
| OSCC: Oral squamous cell carcinoma |
| ∗log2FC in expression of this searched gene in stem-like cells from each diseased tissue sample relative to stem-like cells in normal samples in each tissue plotted against the malignancy continuum. Samples are colored based on if they are from different disease stage. |
Top |
Malignant transformation related pathway analysis |
| Find out the enriched GO biological processes and KEGG pathways involved in transition from healthy to precancer to cancer |
| Tissue | Disease Stage | Enriched GO biological Processes |
| Colorectum | AD |  |
| Colorectum | SER |  |
| Colorectum | MSS |  |
| Colorectum | MSI-H |  |
| Colorectum | FAP |  |
| ∗Top 15 enriched GO BP terms are showed in the bar plot of each disease state in each tissue. Each row represents a significant GO biological process which is colored according to the -log10(p.adjust). |
| Page: 1 2 3 4 5 6 7 8 9 |
| GO ID | Tissue | Disease Stage | Description | Gene Ratio | Bg Ratio | pvalue | p.adjust | Count |
| GO:0016032111 | Esophagus | ESCC | viral process | 301/8552 | 415/18723 | 3.34e-29 | 1.32e-26 | 301 |
| GO:0019058111 | Esophagus | ESCC | viral life cycle | 226/8552 | 317/18723 | 1.17e-20 | 1.76e-18 | 226 |
| GO:0034655110 | Esophagus | ESCC | nucleobase-containing compound catabolic process | 272/8552 | 407/18723 | 2.92e-18 | 2.90e-16 | 272 |
| GO:004670018 | Esophagus | ESCC | heterocycle catabolic process | 286/8552 | 445/18723 | 1.12e-15 | 7.47e-14 | 286 |
| GO:004427019 | Esophagus | ESCC | cellular nitrogen compound catabolic process | 288/8552 | 451/18723 | 3.03e-15 | 1.79e-13 | 288 |
| GO:001943918 | Esophagus | ESCC | aromatic compound catabolic process | 295/8552 | 467/18723 | 1.09e-14 | 5.98e-13 | 295 |
| GO:0019079111 | Esophagus | ESCC | viral genome replication | 102/8552 | 131/18723 | 4.31e-14 | 2.19e-12 | 102 |
| GO:000961518 | Esophagus | ESCC | response to virus | 238/8552 | 367/18723 | 6.65e-14 | 3.32e-12 | 238 |
| GO:190136118 | Esophagus | ESCC | organic cyclic compound catabolic process | 307/8552 | 495/18723 | 9.99e-14 | 4.80e-12 | 307 |
| GO:0050792111 | Esophagus | ESCC | regulation of viral process | 119/8552 | 164/18723 | 2.19e-12 | 9.03e-11 | 119 |
| GO:1903900111 | Esophagus | ESCC | regulation of viral life cycle | 106/8552 | 148/18723 | 1.26e-10 | 3.72e-09 | 106 |
| GO:0045069110 | Esophagus | ESCC | regulation of viral genome replication | 67/8552 | 85/18723 | 3.81e-10 | 1.04e-08 | 67 |
| GO:00516075 | Esophagus | ESCC | defense response to virus | 171/8552 | 265/18723 | 3.91e-10 | 1.05e-08 | 171 |
| GO:01405465 | Esophagus | ESCC | defense response to symbiont | 171/8552 | 265/18723 | 3.91e-10 | 1.05e-08 | 171 |
| GO:00094512 | Esophagus | ESCC | RNA modification | 114/8552 | 167/18723 | 2.76e-09 | 6.04e-08 | 114 |
| GO:004852516 | Esophagus | ESCC | negative regulation of viral process | 66/8552 | 92/18723 | 3.49e-07 | 4.88e-06 | 66 |
| GO:004507114 | Esophagus | ESCC | negative regulation of viral genome replication | 44/8552 | 56/18723 | 4.84e-07 | 6.50e-06 | 44 |
| GO:00028318 | Esophagus | ESCC | regulation of response to biotic stimulus | 191/8552 | 327/18723 | 2.12e-06 | 2.45e-05 | 191 |
| GO:003969411 | Esophagus | ESCC | viral RNA genome replication | 27/8552 | 35/18723 | 1.48e-04 | 9.88e-04 | 27 |
| GO:19016574 | Esophagus | ESCC | glycosyl compound metabolic process | 57/8552 | 88/18723 | 2.32e-04 | 1.44e-03 | 57 |
| Page: 1 2 3 4 |
| Pathway ID | Tissue | Disease Stage | Description | Gene Ratio | Bg Ratio | pvalue | p.adjust | qvalue | Count |
| hsa032509 | Esophagus | ESCC | Viral life cycle - HIV-1 | 54/4205 | 63/8465 | 2.01e-09 | 2.17e-08 | 1.11e-08 | 54 |
| hsa05170210 | Esophagus | ESCC | Human immunodeficiency virus 1 infection | 147/4205 | 212/8465 | 3.37e-09 | 3.53e-08 | 1.81e-08 | 147 |
| hsa0325014 | Esophagus | ESCC | Viral life cycle - HIV-1 | 54/4205 | 63/8465 | 2.01e-09 | 2.17e-08 | 1.11e-08 | 54 |
| hsa0517038 | Esophagus | ESCC | Human immunodeficiency virus 1 infection | 147/4205 | 212/8465 | 3.37e-09 | 3.53e-08 | 1.81e-08 | 147 |
| hsa0517027 | Oral cavity | OSCC | Human immunodeficiency virus 1 infection | 133/3704 | 212/8465 | 1.42e-08 | 1.40e-07 | 7.12e-08 | 133 |
| hsa032508 | Oral cavity | OSCC | Viral life cycle - HIV-1 | 45/3704 | 63/8465 | 7.62e-06 | 3.59e-05 | 1.83e-05 | 45 |
| hsa05170111 | Oral cavity | OSCC | Human immunodeficiency virus 1 infection | 133/3704 | 212/8465 | 1.42e-08 | 1.40e-07 | 7.12e-08 | 133 |
| hsa0325013 | Oral cavity | OSCC | Viral life cycle - HIV-1 | 45/3704 | 63/8465 | 7.62e-06 | 3.59e-05 | 1.83e-05 | 45 |
| hsa0517028 | Oral cavity | LP | Human immunodeficiency virus 1 infection | 92/2418 | 212/8465 | 2.18e-06 | 2.20e-05 | 1.42e-05 | 92 |
| hsa0325022 | Oral cavity | LP | Viral life cycle - HIV-1 | 32/2418 | 63/8465 | 1.55e-04 | 9.08e-04 | 5.86e-04 | 32 |
| hsa0517037 | Oral cavity | LP | Human immunodeficiency virus 1 infection | 92/2418 | 212/8465 | 2.18e-06 | 2.20e-05 | 1.42e-05 | 92 |
| hsa0325031 | Oral cavity | LP | Viral life cycle - HIV-1 | 32/2418 | 63/8465 | 1.55e-04 | 9.08e-04 | 5.86e-04 | 32 |
| Page: 1 |
Top |
Cell-cell communication analysis |
| Identification of potential cell-cell interactions between two cell types and their ligand-receptor pairs for different disease states |
| Ligand | Receptor | LRpair | Pathway | Tissue | Disease Stage |
| Page: 1 |
Top |
Single-cell gene regulatory network inference analysis |
| Find out the significant the regulons (TFs) and the target genes of each regulon across cell types for different disease states |
| TF | Cell Type | Tissue | Disease Stage | Target Gene | RSS | Regulon Activity |
| ∗The dot plots of a searched regulon are shown for all cell subpopulations in each disease state of each tissue based on the regulon specific score inferred using pySCENIC and by calculating the average expression. |
| Page: 1 |
Top |
Somatic mutation of malignant transformation related genes |
| Annotation of somatic variants for genes involved in malignant transformation |
| Hugo Symbol | Variant Class | Variant Classification | dbSNP RS | HGVSc | HGVSp | HGVSp Short | SWISSPROT | BIOTYPE | SIFT | PolyPhen | Tumor Sample Barcode | Tissue | Histology | Sex | Age | Stage | Therapy Types | Drugs | Outcome |
| APOBEC3G | SNV | Missense_Mutation | novel | c.51C>A | p.Phe17Leu | p.F17L | Q9HC16 | protein_coding | deleterious(0) | benign(0.083) | TCGA-AN-A046-01 | Breast | breast invasive carcinoma | Female | >=65 | I/II | Unknown | Unknown | SD |
| APOBEC3G | SNV | Missense_Mutation | novel | c.377T>G | p.Phe126Cys | p.F126C | Q9HC16 | protein_coding | deleterious(0) | probably_damaging(0.987) | TCGA-AN-A046-01 | Breast | breast invasive carcinoma | Female | >=65 | I/II | Unknown | Unknown | SD |
| APOBEC3G | SNV | Missense_Mutation | rs770983495 | c.86N>A | p.Arg29His | p.R29H | Q9HC16 | protein_coding | tolerated(0.2) | benign(0.007) | TCGA-BH-A18L-01 | Breast | breast invasive carcinoma | Female | <65 | III/IV | Unknown | Unknown | SD |
| APOBEC3G | SNV | Missense_Mutation | c.926N>C | p.Ile309Thr | p.I309T | Q9HC16 | protein_coding | deleterious(0) | probably_damaging(1) | TCGA-EW-A1IZ-01 | Breast | breast invasive carcinoma | Female | <65 | III/IV | Chemotherapy | taxotere | SD | |
| APOBEC3G | SNV | Missense_Mutation | novel | c.382N>A | p.Asp128Asn | p.D128N | Q9HC16 | protein_coding | tolerated(0.33) | benign(0.3) | TCGA-C5-A1BL-01 | Cervix | cervical & endocervical cancer | Female | <65 | I/II | Unknown | Unknown | SD |
| APOBEC3G | SNV | Missense_Mutation | rs746526466 | c.997G>T | p.Ala333Ser | p.A333S | Q9HC16 | protein_coding | deleterious(0) | possibly_damaging(0.876) | TCGA-C5-A2M1-01 | Cervix | cervical & endocervical cancer | Female | <65 | I/II | Unknown | Unknown | SD |
| APOBEC3G | SNV | Missense_Mutation | novel | c.919C>A | p.Leu307Met | p.L307M | Q9HC16 | protein_coding | deleterious(0) | probably_damaging(1) | TCGA-EA-A410-01 | Cervix | cervical & endocervical cancer | Female | <65 | I/II | Unknown | Unknown | SD |
| APOBEC3G | SNV | Missense_Mutation | rs142694979 | c.406N>T | p.Arg136Cys | p.R136C | Q9HC16 | protein_coding | tolerated(0.15) | probably_damaging(0.969) | TCGA-JX-A3PZ-01 | Cervix | cervical & endocervical cancer | Female | <65 | I/II | Unknown | Unknown | PD |
| APOBEC3G | SNV | Missense_Mutation | c.638N>C | p.Arg213Thr | p.R213T | Q9HC16 | protein_coding | tolerated(0.38) | benign(0.072) | TCGA-Q1-A73O-01 | Cervix | cervical & endocervical cancer | Female | <65 | I/II | Chemotherapy | cisplatin | CR | |
| APOBEC3G | SNV | Missense_Mutation | rs754997505 | c.358G>A | p.Val120Ile | p.V120I | Q9HC16 | protein_coding | tolerated(0.21) | possibly_damaging(0.717) | TCGA-VS-A9UP-01 | Cervix | cervical & endocervical cancer | Female | <65 | I/II | Chemotherapy | cisplatin | PD |
| Page: 1 2 3 4 5 |
Top |
Related drugs of malignant transformation related genes |
| Identification of chemicals and drugs interact with genes involved in malignant transfromation |
| (DGIdb 4.0) |
| Entrez ID | Symbol | Category | Interaction Types | Drug Claim Name | Drug Name | PMIDs |
| 60489 | APOBEC3G | ENZYME, DRUGGABLE GENOME | NSC-50690 | CHEMBL1388703 | ||
| 60489 | APOBEC3G | ENZYME, DRUGGABLE GENOME | SCOULERINE | SCOULERINE | ||
| 60489 | APOBEC3G | ENZYME, DRUGGABLE GENOME | NSC-8186 | CHEMBL122355 | ||
| 60489 | APOBEC3G | ENZYME, DRUGGABLE GENOME | GNF-PF-4612 | CHEMBL601550 | ||
| 60489 | APOBEC3G | ENZYME, DRUGGABLE GENOME | CID 3237815 | CHEMBL410484 | ||
| 60489 | APOBEC3G | ENZYME, DRUGGABLE GENOME | CID 100335 | CHEMBL1520346 | ||
| 60489 | APOBEC3G | ENZYME, DRUGGABLE GENOME | CID 4970947 | CHEMBL1451921 | ||
| 60489 | APOBEC3G | ENZYME, DRUGGABLE GENOME | GNF-PF-4798 | CHEMBL584635 | ||
| 60489 | APOBEC3G | ENZYME, DRUGGABLE GENOME | CEFOTETAN | CEFOTETAN | ||
| 60489 | APOBEC3G | ENZYME, DRUGGABLE GENOME | TCMDC-124266 | CHEMBL124006 |
| Page: 1 2 3 4 5 6 |

Copyright 2023-Present -The University of Texas Health Science Center at Houston |