| Tissue | Expression Dynamics | Abbreviation |
| Colorectum (GSE201348) |  | FAP: Familial adenomatous polyposis |
| CRC: Colorectal cancer |
| Colorectum (HTA11) |  | AD: Adenomas |
| SER: Sessile serrated lesions |
| MSI-H: Microsatellite-high colorectal cancer |
| MSS: Microsatellite stable colorectal cancer |
| Esophagus | 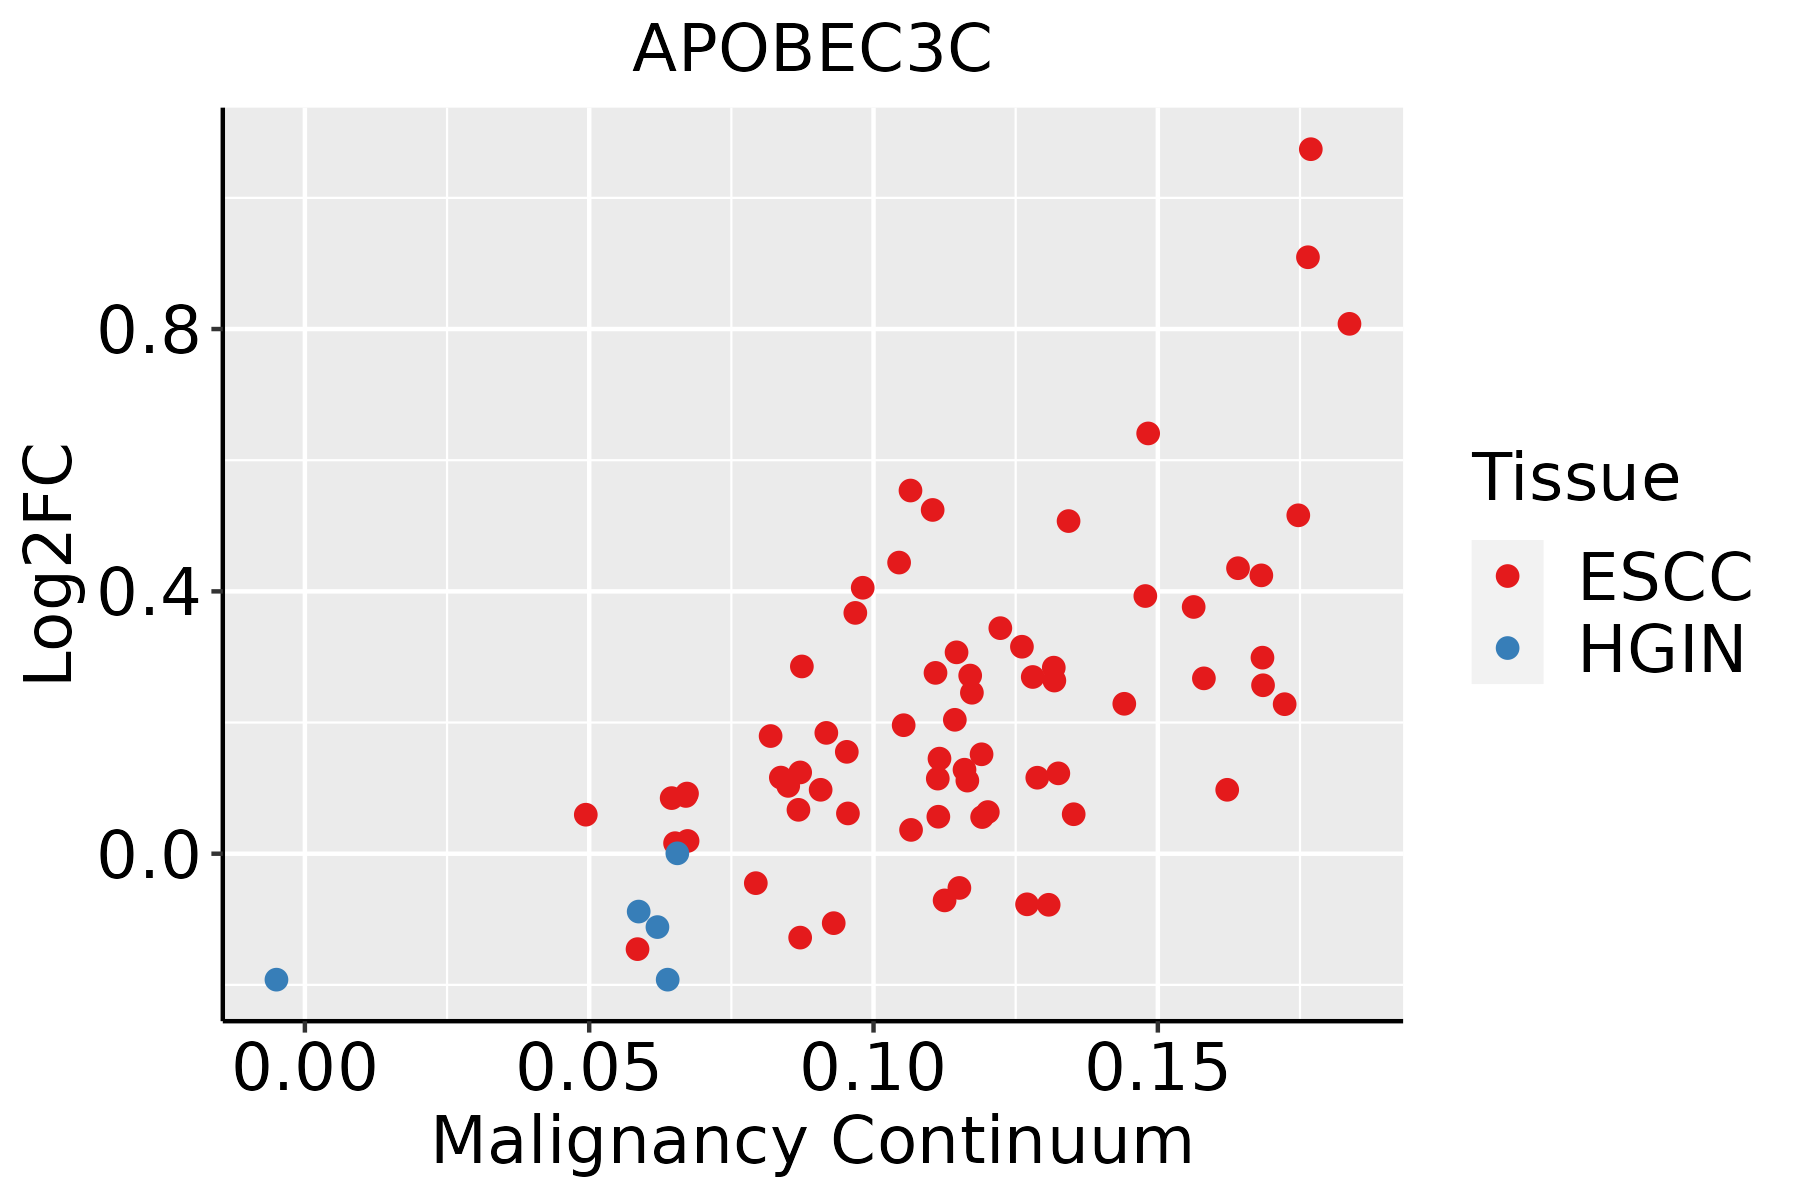 | ESCC: Esophageal squamous cell carcinoma |
| HGIN: High-grade intraepithelial neoplasias |
| LGIN: Low-grade intraepithelial neoplasias |
| Oral Cavity |  | EOLP: Erosive Oral lichen planus |
| LP: leukoplakia |
| NEOLP: Non-erosive oral lichen planus |
| OSCC: Oral squamous cell carcinoma |
| Skin | 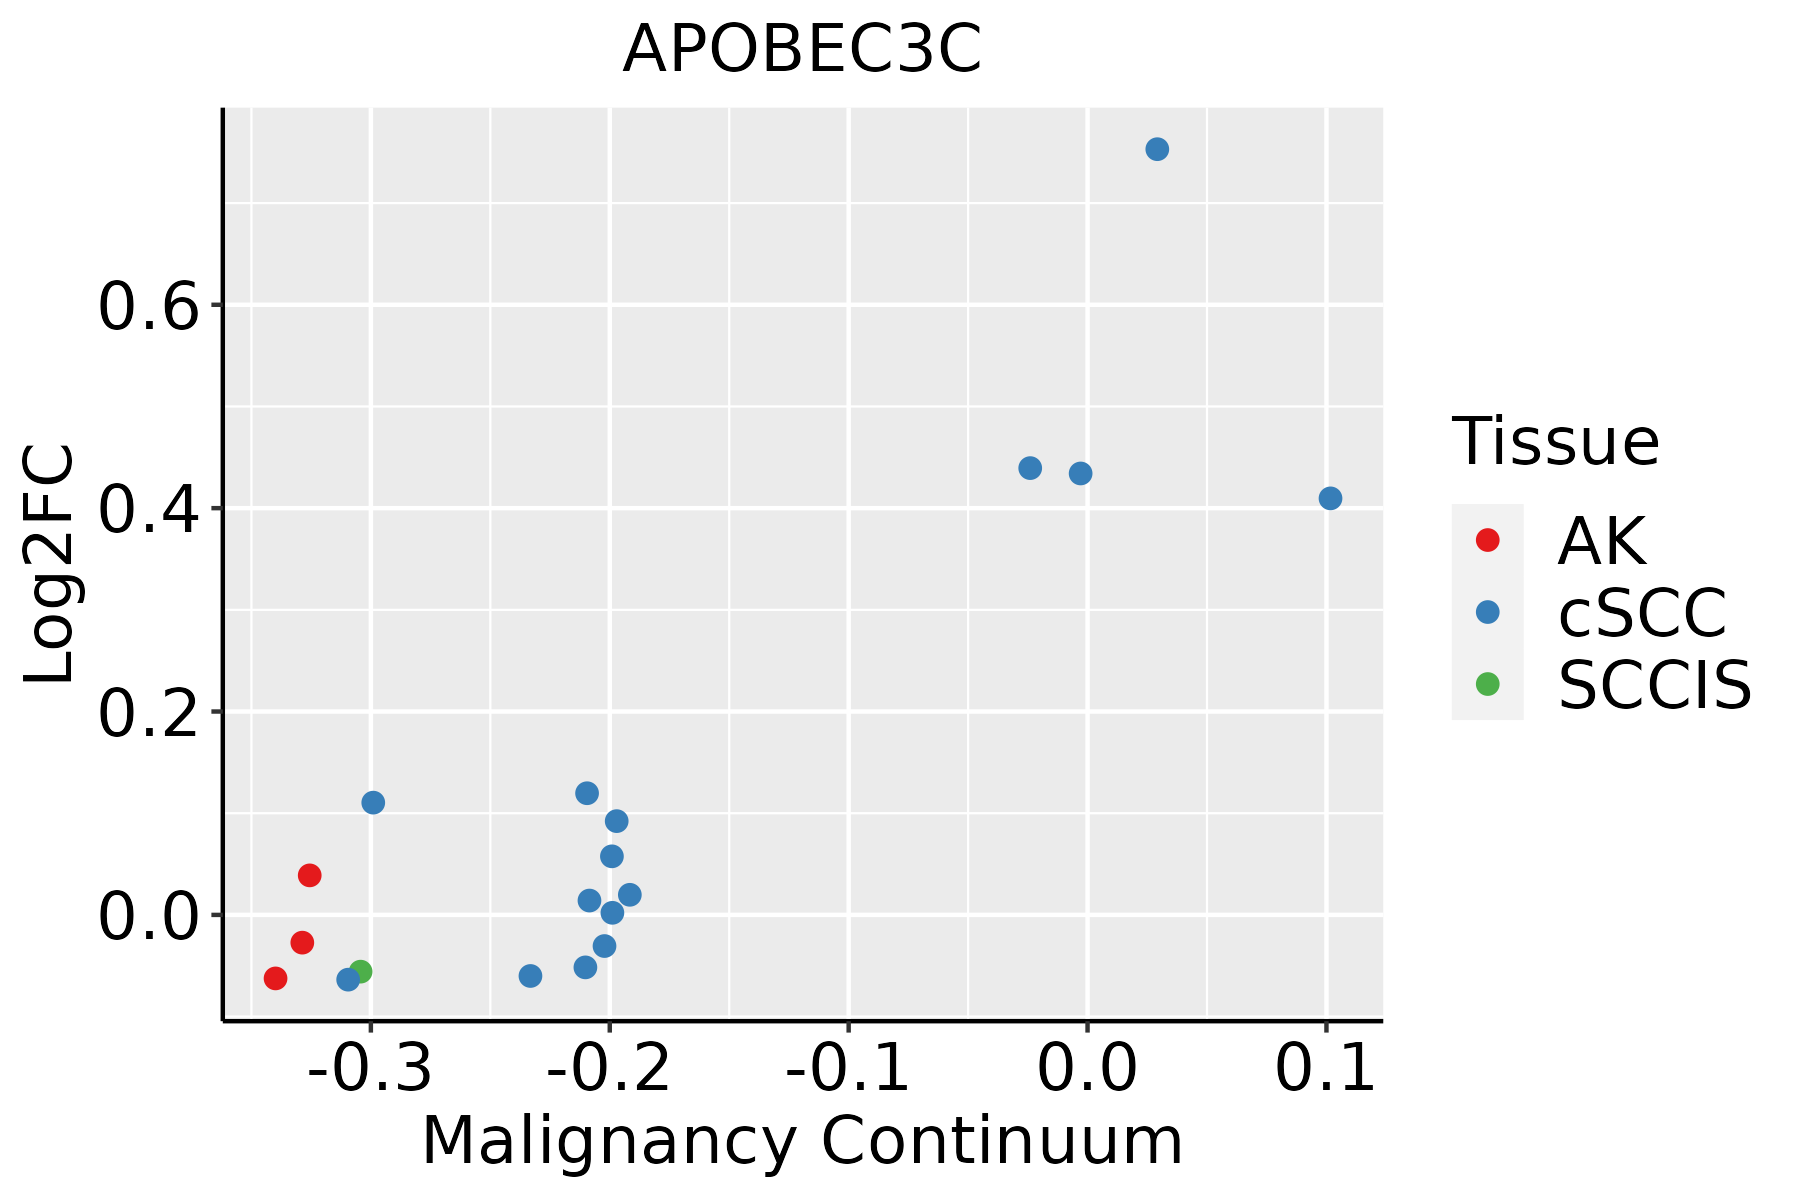 | AK: Actinic keratosis |
| cSCC: Cutaneous squamous cell carcinoma |
| SCCIS:squamous cell carcinoma in situ |
| GO ID | Tissue | Disease Stage | Description | Gene Ratio | Bg Ratio | pvalue | p.adjust | Count |
| GO:0016032 | Colorectum | AD | viral process | 168/3918 | 415/18723 | 4.67e-20 | 3.66e-17 | 168 |
| GO:0019058 | Colorectum | AD | viral life cycle | 119/3918 | 317/18723 | 6.18e-12 | 8.23e-10 | 119 |
| GO:0044270 | Colorectum | AD | cellular nitrogen compound catabolic process | 147/3918 | 451/18723 | 3.35e-09 | 2.23e-07 | 147 |
| GO:0046700 | Colorectum | AD | heterocycle catabolic process | 145/3918 | 445/18723 | 4.37e-09 | 2.84e-07 | 145 |
| GO:0034655 | Colorectum | AD | nucleobase-containing compound catabolic process | 133/3918 | 407/18723 | 1.56e-08 | 9.12e-07 | 133 |
| GO:0019439 | Colorectum | AD | aromatic compound catabolic process | 146/3918 | 467/18723 | 7.48e-08 | 3.84e-06 | 146 |
| GO:1901361 | Colorectum | AD | organic cyclic compound catabolic process | 153/3918 | 495/18723 | 8.23e-08 | 4.18e-06 | 153 |
| GO:0044282 | Colorectum | AD | small molecule catabolic process | 118/3918 | 376/18723 | 1.05e-06 | 3.55e-05 | 118 |
| GO:0019079 | Colorectum | AD | viral genome replication | 51/3918 | 131/18723 | 1.83e-06 | 5.51e-05 | 51 |
| GO:0050792 | Colorectum | AD | regulation of viral process | 59/3918 | 164/18723 | 5.95e-06 | 1.52e-04 | 59 |
| GO:1903900 | Colorectum | AD | regulation of viral life cycle | 51/3918 | 148/18723 | 9.01e-05 | 1.38e-03 | 51 |
| GO:0045069 | Colorectum | AD | regulation of viral genome replication | 32/3918 | 85/18723 | 2.97e-04 | 3.60e-03 | 32 |
| GO:00160321 | Colorectum | SER | viral process | 118/2897 | 415/18723 | 8.36e-12 | 1.65e-09 | 118 |
| GO:00190581 | Colorectum | SER | viral life cycle | 87/2897 | 317/18723 | 2.82e-08 | 1.94e-06 | 87 |
| GO:00442821 | Colorectum | SER | small molecule catabolic process | 87/2897 | 376/18723 | 5.31e-05 | 1.27e-03 | 87 |
| GO:00190791 | Colorectum | SER | viral genome replication | 37/2897 | 131/18723 | 1.36e-04 | 2.72e-03 | 37 |
| GO:00442701 | Colorectum | SER | cellular nitrogen compound catabolic process | 99/2897 | 451/18723 | 1.46e-04 | 2.86e-03 | 99 |
| GO:00467001 | Colorectum | SER | heterocycle catabolic process | 97/2897 | 445/18723 | 2.20e-04 | 3.89e-03 | 97 |
| GO:00507921 | Colorectum | SER | regulation of viral process | 43/2897 | 164/18723 | 2.57e-04 | 4.31e-03 | 43 |
| GO:19013611 | Colorectum | SER | organic cyclic compound catabolic process | 104/2897 | 495/18723 | 5.46e-04 | 7.63e-03 | 104 |
| Pathway ID | Tissue | Disease Stage | Description | Gene Ratio | Bg Ratio | pvalue | p.adjust | qvalue | Count |
| hsa05170 | Colorectum | AD | Human immunodeficiency virus 1 infection | 72/2092 | 212/8465 | 1.40e-03 | 8.46e-03 | 5.39e-03 | 72 |
| hsa051701 | Colorectum | AD | Human immunodeficiency virus 1 infection | 72/2092 | 212/8465 | 1.40e-03 | 8.46e-03 | 5.39e-03 | 72 |
| hsa051702 | Colorectum | SER | Human immunodeficiency virus 1 infection | 58/1580 | 212/8465 | 1.08e-03 | 8.56e-03 | 6.21e-03 | 58 |
| hsa051703 | Colorectum | SER | Human immunodeficiency virus 1 infection | 58/1580 | 212/8465 | 1.08e-03 | 8.56e-03 | 6.21e-03 | 58 |
| hsa051704 | Colorectum | MSS | Human immunodeficiency virus 1 infection | 69/1875 | 212/8465 | 2.66e-04 | 1.98e-03 | 1.21e-03 | 69 |
| hsa051705 | Colorectum | MSS | Human immunodeficiency virus 1 infection | 69/1875 | 212/8465 | 2.66e-04 | 1.98e-03 | 1.21e-03 | 69 |
| hsa032509 | Esophagus | ESCC | Viral life cycle - HIV-1 | 54/4205 | 63/8465 | 2.01e-09 | 2.17e-08 | 1.11e-08 | 54 |
| hsa05170210 | Esophagus | ESCC | Human immunodeficiency virus 1 infection | 147/4205 | 212/8465 | 3.37e-09 | 3.53e-08 | 1.81e-08 | 147 |
| hsa0325014 | Esophagus | ESCC | Viral life cycle - HIV-1 | 54/4205 | 63/8465 | 2.01e-09 | 2.17e-08 | 1.11e-08 | 54 |
| hsa0517038 | Esophagus | ESCC | Human immunodeficiency virus 1 infection | 147/4205 | 212/8465 | 3.37e-09 | 3.53e-08 | 1.81e-08 | 147 |
| hsa0517027 | Oral cavity | OSCC | Human immunodeficiency virus 1 infection | 133/3704 | 212/8465 | 1.42e-08 | 1.40e-07 | 7.12e-08 | 133 |
| hsa032508 | Oral cavity | OSCC | Viral life cycle - HIV-1 | 45/3704 | 63/8465 | 7.62e-06 | 3.59e-05 | 1.83e-05 | 45 |
| hsa05170111 | Oral cavity | OSCC | Human immunodeficiency virus 1 infection | 133/3704 | 212/8465 | 1.42e-08 | 1.40e-07 | 7.12e-08 | 133 |
| hsa0325013 | Oral cavity | OSCC | Viral life cycle - HIV-1 | 45/3704 | 63/8465 | 7.62e-06 | 3.59e-05 | 1.83e-05 | 45 |
| hsa0517028 | Oral cavity | LP | Human immunodeficiency virus 1 infection | 92/2418 | 212/8465 | 2.18e-06 | 2.20e-05 | 1.42e-05 | 92 |
| hsa0517037 | Oral cavity | LP | Human immunodeficiency virus 1 infection | 92/2418 | 212/8465 | 2.18e-06 | 2.20e-05 | 1.42e-05 | 92 |
| Hugo Symbol | Variant Class | Variant Classification | dbSNP RS | HGVSc | HGVSp | HGVSp Short | SWISSPROT | BIOTYPE | SIFT | PolyPhen | Tumor Sample Barcode | Tissue | Histology | Sex | Age | Stage | Therapy Types | Drugs | Outcome |
| APOBEC3C | SNV | Missense_Mutation | rs200673371 | c.131G>A | p.Arg44His | p.R44H | Q9NRW3 | protein_coding | tolerated(0.93) | benign(0) | TCGA-AQ-A04J-01 | Breast | breast invasive carcinoma | Female | <65 | I/II | Chemotherapy | cytoxan | SD |
| APOBEC3C | SNV | Missense_Mutation | | c.472N>A | p.Glu158Lys | p.E158K | Q9NRW3 | protein_coding | tolerated(0.3) | benign(0.012) | TCGA-D8-A1XT-01 | Breast | breast invasive carcinoma | Female | <65 | I/II | Chemotherapy | adriamycin+cyclophosphamide | SD |
| APOBEC3C | insertion | In_Frame_Ins | novel | c.120_121insATTCTCAGGGCTGTGGAGGGATGGGGGAGGCCCAGAGCCCAG | p.Glu40_Gly41insIleLeuArgAlaValGluGlyTrpGlyArgProArgAlaGln | p.E40_G41insILRAVEGWGRPRAQ | Q9NRW3 | protein_coding | | | TCGA-AN-A04D-01 | Breast | breast invasive carcinoma | Female | <65 | I/II | Unknown | Unknown | SD |
| APOBEC3C | insertion | In_Frame_Ins | novel | c.132_133insATT | p.Arg44_Arg45insIle | p.R44_R45insI | Q9NRW3 | protein_coding | | | TCGA-AQ-A04J-01 | Breast | breast invasive carcinoma | Female | <65 | I/II | Chemotherapy | cytoxan | SD |
| APOBEC3C | insertion | Frame_Shift_Ins | novel | c.136_137insGTTTCACATTTTCTTGGTCCACACGGAAC | p.Ser46CysfsTer79 | p.S46Cfs*79 | Q9NRW3 | protein_coding | | | TCGA-B6-A0IA-01 | Breast | breast invasive carcinoma | Female | <65 | I/II | Unknown | Unknown | SD |
| APOBEC3C | SNV | Missense_Mutation | rs376538641 | c.134N>A | p.Arg45His | p.R45H | Q9NRW3 | protein_coding | tolerated(0.23) | benign(0.001) | TCGA-2W-A8YY-01 | Cervix | cervical & endocervical cancer | Female | <65 | I/II | Chemotherapy | cisplatin | CR |
| APOBEC3C | SNV | Missense_Mutation | | c.130N>T | p.Arg44Cys | p.R44C | Q9NRW3 | protein_coding | tolerated(0.19) | benign(0) | TCGA-EA-A3HS-01 | Cervix | cervical & endocervical cancer | Female | <65 | I/II | Unknown | Unknown | SD |
| APOBEC3C | SNV | Missense_Mutation | rs756657821 | c.160G>A | p.Val54Ile | p.V54I | Q9NRW3 | protein_coding | tolerated(0.45) | benign(0.353) | TCGA-EA-A410-01 | Cervix | cervical & endocervical cancer | Female | <65 | I/II | Unknown | Unknown | SD |
| APOBEC3C | SNV | Missense_Mutation | | c.365G>A | p.Arg122His | p.R122H | Q9NRW3 | protein_coding | deleterious(0.03) | probably_damaging(0.948) | TCGA-AA-A01R-01 | Colorectum | colon adenocarcinoma | Male | <65 | III/IV | Chemotherapy | 5-fluorouracil | PD |
| APOBEC3C | SNV | Missense_Mutation | novel | c.403N>T | p.Leu135Phe | p.L135F | Q9NRW3 | protein_coding | deleterious(0) | probably_damaging(0.989) | TCGA-AZ-4315-01 | Colorectum | colon adenocarcinoma | Male | <65 | I/II | Unknown | Unknown | SD |


