
|
|||||
|
 | |
| |
| |
| |
| |
| |
|
Gene: APOBEC3B |
Gene summary for APOBEC3B |
| Gene information | Species | Human | Gene symbol | APOBEC3B | Gene ID | 9582 |
| Gene name | apolipoprotein B mRNA editing enzyme catalytic subunit 3B | |
| Gene Alias | A3B | |
| Cytomap | 22q13.1 | |
| Gene Type | protein-coding | GO ID | GO:0002376 | UniProtAcc | Q9UH17 |
Top |
Malignant transformation analysis |
| Identification of the aberrant gene expression in precancerous and cancerous lesions by comparing the gene expression of stem-like cells in diseased tissues with normal stem cells |
| Entrez ID | Symbol | Replicates | Species | Organ | Tissue | Adj P-value | Log2FC | Malignancy |
| 9582 | APOBEC3B | LZE2T | Human | Esophagus | ESCC | 3.94e-07 | 5.56e-01 | 0.082 |
| 9582 | APOBEC3B | LZE4T | Human | Esophagus | ESCC | 8.35e-06 | 2.56e-01 | 0.0811 |
| 9582 | APOBEC3B | LZE7T | Human | Esophagus | ESCC | 3.90e-02 | 1.53e-01 | 0.0667 |
| 9582 | APOBEC3B | LZE21T | Human | Esophagus | ESCC | 6.52e-03 | 3.60e-01 | 0.0655 |
| 9582 | APOBEC3B | P2T-E | Human | Esophagus | ESCC | 1.76e-12 | 2.73e-01 | 0.1177 |
| 9582 | APOBEC3B | P4T-E | Human | Esophagus | ESCC | 4.90e-05 | 1.38e-01 | 0.1323 |
| 9582 | APOBEC3B | P5T-E | Human | Esophagus | ESCC | 7.98e-13 | 2.65e-01 | 0.1327 |
| 9582 | APOBEC3B | P8T-E | Human | Esophagus | ESCC | 3.75e-03 | 1.07e-01 | 0.0889 |
| 9582 | APOBEC3B | P15T-E | Human | Esophagus | ESCC | 1.35e-04 | 1.64e-01 | 0.1149 |
| 9582 | APOBEC3B | P17T-E | Human | Esophagus | ESCC | 9.15e-12 | 6.63e-01 | 0.1278 |
| 9582 | APOBEC3B | P21T-E | Human | Esophagus | ESCC | 9.53e-09 | 2.11e-01 | 0.1617 |
| 9582 | APOBEC3B | P22T-E | Human | Esophagus | ESCC | 4.44e-08 | 2.28e-01 | 0.1236 |
| 9582 | APOBEC3B | P23T-E | Human | Esophagus | ESCC | 2.13e-09 | 3.05e-01 | 0.108 |
| 9582 | APOBEC3B | P26T-E | Human | Esophagus | ESCC | 1.97e-10 | 2.30e-01 | 0.1276 |
| 9582 | APOBEC3B | P27T-E | Human | Esophagus | ESCC | 4.17e-05 | 1.48e-01 | 0.1055 |
| 9582 | APOBEC3B | P28T-E | Human | Esophagus | ESCC | 9.56e-08 | 2.58e-01 | 0.1149 |
| 9582 | APOBEC3B | P30T-E | Human | Esophagus | ESCC | 3.85e-06 | 3.01e-01 | 0.137 |
| 9582 | APOBEC3B | P32T-E | Human | Esophagus | ESCC | 7.31e-14 | 3.53e-01 | 0.1666 |
| 9582 | APOBEC3B | P37T-E | Human | Esophagus | ESCC | 1.93e-09 | 2.56e-01 | 0.1371 |
| 9582 | APOBEC3B | P38T-E | Human | Esophagus | ESCC | 6.95e-06 | 2.58e-01 | 0.127 |
| Page: 1 2 |
| Tissue | Expression Dynamics | Abbreviation |
| Esophagus | 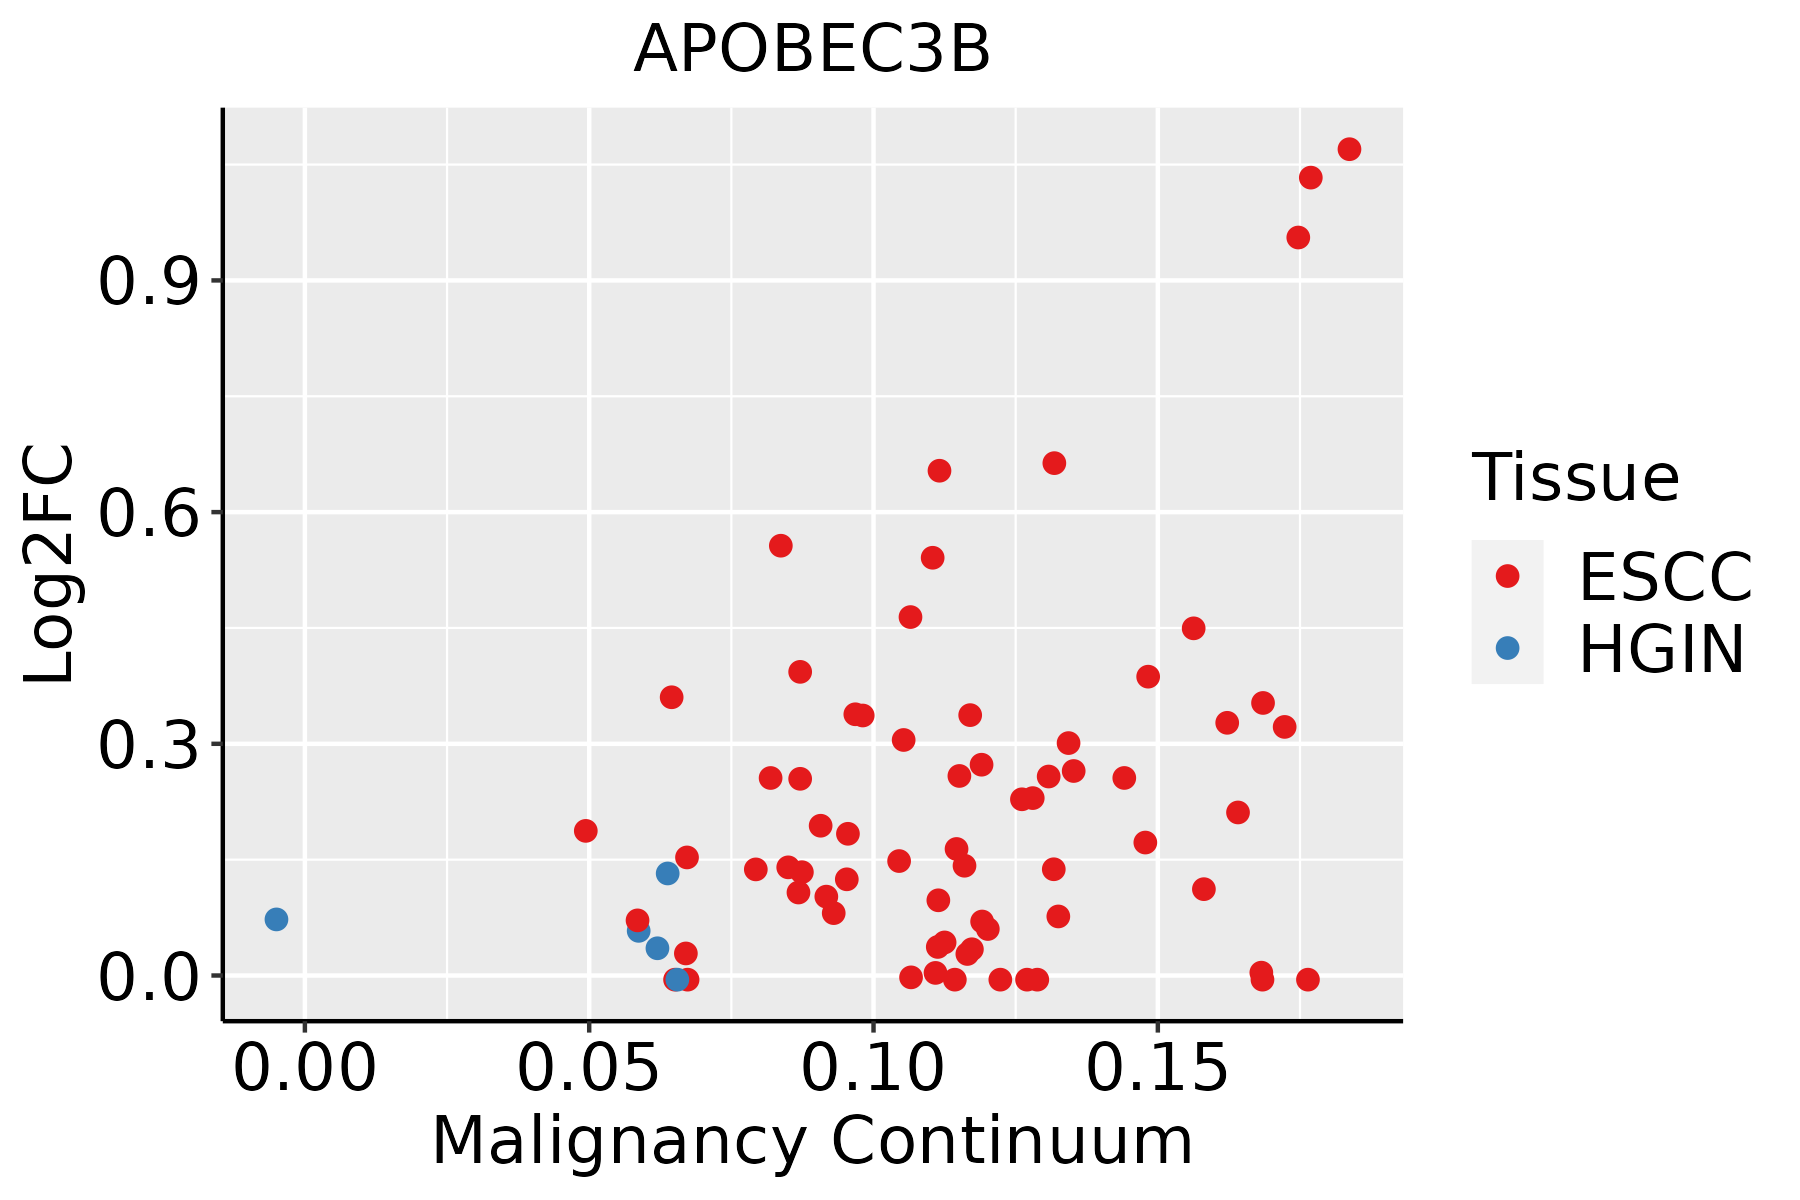 | ESCC: Esophageal squamous cell carcinoma |
| HGIN: High-grade intraepithelial neoplasias | ||
| LGIN: Low-grade intraepithelial neoplasias |
| ∗log2FC in expression of this searched gene in stem-like cells from each diseased tissue sample relative to stem-like cells in normal samples in each tissue plotted against the malignancy continuum. Samples are colored based on if they are from different disease stage. |
Top |
Malignant transformation related pathway analysis |
| Find out the enriched GO biological processes and KEGG pathways involved in transition from healthy to precancer to cancer |
| Tissue | Disease Stage | Enriched GO biological Processes |
| Colorectum | AD |  |
| Colorectum | SER |  |
| Colorectum | MSS |  |
| Colorectum | MSI-H |  |
| Colorectum | FAP |  |
| ∗Top 15 enriched GO BP terms are showed in the bar plot of each disease state in each tissue. Each row represents a significant GO biological process which is colored according to the -log10(p.adjust). |
| Page: 1 2 3 4 5 6 7 8 9 |
| GO ID | Tissue | Disease Stage | Description | Gene Ratio | Bg Ratio | pvalue | p.adjust | Count |
| GO:0016032111 | Esophagus | ESCC | viral process | 301/8552 | 415/18723 | 3.34e-29 | 1.32e-26 | 301 |
| GO:0019058111 | Esophagus | ESCC | viral life cycle | 226/8552 | 317/18723 | 1.17e-20 | 1.76e-18 | 226 |
| GO:0034655110 | Esophagus | ESCC | nucleobase-containing compound catabolic process | 272/8552 | 407/18723 | 2.92e-18 | 2.90e-16 | 272 |
| GO:004670018 | Esophagus | ESCC | heterocycle catabolic process | 286/8552 | 445/18723 | 1.12e-15 | 7.47e-14 | 286 |
| GO:004427019 | Esophagus | ESCC | cellular nitrogen compound catabolic process | 288/8552 | 451/18723 | 3.03e-15 | 1.79e-13 | 288 |
| GO:001943918 | Esophagus | ESCC | aromatic compound catabolic process | 295/8552 | 467/18723 | 1.09e-14 | 5.98e-13 | 295 |
| GO:0019079111 | Esophagus | ESCC | viral genome replication | 102/8552 | 131/18723 | 4.31e-14 | 2.19e-12 | 102 |
| GO:000961518 | Esophagus | ESCC | response to virus | 238/8552 | 367/18723 | 6.65e-14 | 3.32e-12 | 238 |
| GO:190136118 | Esophagus | ESCC | organic cyclic compound catabolic process | 307/8552 | 495/18723 | 9.99e-14 | 4.80e-12 | 307 |
| GO:0050792111 | Esophagus | ESCC | regulation of viral process | 119/8552 | 164/18723 | 2.19e-12 | 9.03e-11 | 119 |
| GO:1903900111 | Esophagus | ESCC | regulation of viral life cycle | 106/8552 | 148/18723 | 1.26e-10 | 3.72e-09 | 106 |
| GO:0045069110 | Esophagus | ESCC | regulation of viral genome replication | 67/8552 | 85/18723 | 3.81e-10 | 1.04e-08 | 67 |
| GO:00516075 | Esophagus | ESCC | defense response to virus | 171/8552 | 265/18723 | 3.91e-10 | 1.05e-08 | 171 |
| GO:01405465 | Esophagus | ESCC | defense response to symbiont | 171/8552 | 265/18723 | 3.91e-10 | 1.05e-08 | 171 |
| GO:00094512 | Esophagus | ESCC | RNA modification | 114/8552 | 167/18723 | 2.76e-09 | 6.04e-08 | 114 |
| GO:004852516 | Esophagus | ESCC | negative regulation of viral process | 66/8552 | 92/18723 | 3.49e-07 | 4.88e-06 | 66 |
| GO:004507114 | Esophagus | ESCC | negative regulation of viral genome replication | 44/8552 | 56/18723 | 4.84e-07 | 6.50e-06 | 44 |
| GO:003969411 | Esophagus | ESCC | viral RNA genome replication | 27/8552 | 35/18723 | 1.48e-04 | 9.88e-04 | 27 |
| GO:19016574 | Esophagus | ESCC | glycosyl compound metabolic process | 57/8552 | 88/18723 | 2.32e-04 | 1.44e-03 | 57 |
| GO:00725273 | Esophagus | ESCC | pyrimidine-containing compound metabolic process | 52/8552 | 82/18723 | 9.03e-04 | 4.61e-03 | 52 |
| Page: 1 2 |
| Pathway ID | Tissue | Disease Stage | Description | Gene Ratio | Bg Ratio | pvalue | p.adjust | qvalue | Count |
| hsa032509 | Esophagus | ESCC | Viral life cycle - HIV-1 | 54/4205 | 63/8465 | 2.01e-09 | 2.17e-08 | 1.11e-08 | 54 |
| hsa05170210 | Esophagus | ESCC | Human immunodeficiency virus 1 infection | 147/4205 | 212/8465 | 3.37e-09 | 3.53e-08 | 1.81e-08 | 147 |
| hsa0325014 | Esophagus | ESCC | Viral life cycle - HIV-1 | 54/4205 | 63/8465 | 2.01e-09 | 2.17e-08 | 1.11e-08 | 54 |
| hsa0517038 | Esophagus | ESCC | Human immunodeficiency virus 1 infection | 147/4205 | 212/8465 | 3.37e-09 | 3.53e-08 | 1.81e-08 | 147 |
| Page: 1 |
Top |
Cell-cell communication analysis |
| Identification of potential cell-cell interactions between two cell types and their ligand-receptor pairs for different disease states |
| Ligand | Receptor | LRpair | Pathway | Tissue | Disease Stage |
| Page: 1 |
Top |
Single-cell gene regulatory network inference analysis |
| Find out the significant the regulons (TFs) and the target genes of each regulon across cell types for different disease states |
| TF | Cell Type | Tissue | Disease Stage | Target Gene | RSS | Regulon Activity |
| ∗The dot plots of a searched regulon are shown for all cell subpopulations in each disease state of each tissue based on the regulon specific score inferred using pySCENIC and by calculating the average expression. |
| Page: 1 |
Top |
Somatic mutation of malignant transformation related genes |
| Annotation of somatic variants for genes involved in malignant transformation |
| Hugo Symbol | Variant Class | Variant Classification | dbSNP RS | HGVSc | HGVSp | HGVSp Short | SWISSPROT | BIOTYPE | SIFT | PolyPhen | Tumor Sample Barcode | Tissue | Histology | Sex | Age | Stage | Therapy Types | Drugs | Outcome |
| APOBEC3B | SNV | Missense_Mutation | rs377377948 | c.932G>A | p.Arg311His | p.R311H | Q9UH17 | protein_coding | deleterious(0.04) | benign(0.233) | TCGA-AN-A046-01 | Breast | breast invasive carcinoma | Female | >=65 | I/II | Unknown | Unknown | SD |
| APOBEC3B | SNV | Missense_Mutation | rs766117548 | c.395G>A | p.Arg132Gln | p.R132Q | Q9UH17 | protein_coding | tolerated(1) | benign(0.011) | TCGA-BH-A0BP-01 | Breast | breast invasive carcinoma | Female | >=65 | I/II | Unknown | Unknown | SD |
| APOBEC3B | SNV | Missense_Mutation | c.196N>T | p.His66Tyr | p.H66Y | Q9UH17 | protein_coding | deleterious(0.03) | probably_damaging(0.988) | TCGA-DR-A0ZM-01 | Cervix | cervical & endocervical cancer | Female | <65 | III/IV | Unspecific | Cisplatin | SD | |
| APOBEC3B | SNV | Missense_Mutation | rs749965333 | c.629N>A | p.Arg210Gln | p.R210Q | Q9UH17 | protein_coding | deleterious(0.02) | benign(0.007) | TCGA-AA-3510-01 | Colorectum | colon adenocarcinoma | Male | >=65 | I/II | Unknown | Unknown | SD |
| APOBEC3B | SNV | Missense_Mutation | novel | c.897N>T | p.Glu299Asp | p.E299D | Q9UH17 | protein_coding | tolerated(0.22) | benign(0.097) | TCGA-AZ-4315-01 | Colorectum | colon adenocarcinoma | Male | <65 | I/II | Unknown | Unknown | SD |
| APOBEC3B | SNV | Missense_Mutation | rs747995529 | c.1121N>A | p.Arg374Gln | p.R374Q | Q9UH17 | protein_coding | tolerated(0.97) | benign(0) | TCGA-AZ-6601-01 | Colorectum | colon adenocarcinoma | Male | >=65 | I/II | Unknown | Unknown | PD |
| APOBEC3B | SNV | Missense_Mutation | c.970C>A | p.Gln324Lys | p.Q324K | Q9UH17 | protein_coding | tolerated(0.53) | benign(0.012) | TCGA-CA-5254-01 | Colorectum | colon adenocarcinoma | Female | <65 | I/II | Chemotherapy | oxaliplatin | CR | |
| APOBEC3B | SNV | Missense_Mutation | rs747498277 | c.916C>T | p.Arg306Cys | p.R306C | Q9UH17 | protein_coding | tolerated(0.15) | benign(0.014) | TCGA-CK-5912-01 | Colorectum | colon adenocarcinoma | Male | >=65 | I/II | Unknown | Unknown | SD |
| APOBEC3B | SNV | Missense_Mutation | rs772434543 | c.907G>A | p.Val303Met | p.V303M | Q9UH17 | protein_coding | deleterious(0.02) | benign(0.264) | TCGA-G4-6320-01 | Colorectum | colon adenocarcinoma | Male | >=65 | III/IV | Chemotherapy | oxaliplatin | SD |
| APOBEC3B | insertion | Nonsense_Mutation | novel | c.573_574insTGAGGCA | p.Leu192Ter | p.L192* | Q9UH17 | protein_coding | TCGA-AM-5820-01 | Colorectum | colon adenocarcinoma | Female | <65 | I/II | Unknown | Unknown | SD |
| Page: 1 2 3 4 5 |
Top |
Related drugs of malignant transformation related genes |
| Identification of chemicals and drugs interact with genes involved in malignant transfromation |
| (DGIdb 4.0) |
| Entrez ID | Symbol | Category | Interaction Types | Drug Claim Name | Drug Name | PMIDs |
| 9582 | APOBEC3B | ENZYME | corticosteroids | 30697902 |
| Page: 1 |

Copyright 2023-Present -The University of Texas Health Science Center at Houston |