Schematic overview of the cellular and molecular mechanisms involved in the cancer progression, including the proposed cellular and molecular mechanisms in cancer cells trajectory. AT1: alveolar type 1 cells; AT2: alveolar type 2 cells; AAH: atypical adenomatous hyperplasia; AIS: adenocarcinoma in situ; MIA: minimally invasive adenocarcinoma; IA: invasive adenocarcinoma; EMT: epithelial-mesenchymal transition

Home

Download

Statistics

Help

Contact

Center for Computational Systems Medicine
leaf

Gene summary

leaf

Malignant transformation analysis

leaf

Malignant transformation related pathway analysis

leaf

Cell-cell communication analysis

leaf

Single-cell gene regulatory network inference analysis

leaf

Somatic mutation of malignant transformation related genes

leaf

Related drugs of malignant transformation related genes

Gene: APLP2

Gene summary for APLP2

check button Gene summary.

Gene informationSpeciesHuman
Gene symbol

APLP2

Gene ID

334

Gene nameamyloid beta precursor like protein 2
Gene AliasAPLP-2
Cytomap11q24.3
Gene Typeprotein-coding
GO ID

GO:0006508

UniProtAcc

A0A140VJE9


Top

Malignant transformation analysis

check button Identification of the aberrant gene expression in precancerous and cancerous lesions by comparing the gene expression of stem-like cells in diseased tissues with normal stem cells
check button Malignant transformation involving gene list.
Entrez IDSymbolReplicatesSpeciesOrganTissueAdj P-valueLog2FCMalignancy
334APLP2HTA11_2487_2000001011HumanColorectumSER3.08e-159.75e-01-0.1808
334APLP2HTA11_1938_2000001011HumanColorectumAD2.71e-201.18e+00-0.0811
334APLP2HTA11_78_2000001011HumanColorectumAD5.42e-149.54e-01-0.1088
334APLP2HTA11_347_2000001011HumanColorectumAD2.87e-501.44e+00-0.1954
334APLP2HTA11_411_2000001011HumanColorectumSER5.90e-141.78e+00-0.2602
334APLP2HTA11_83_2000001011HumanColorectumSER2.94e-191.31e+00-0.1526
334APLP2HTA11_696_2000001011HumanColorectumAD2.52e-228.38e-01-0.1464
334APLP2HTA11_866_2000001011HumanColorectumAD3.63e-136.47e-01-0.1001
334APLP2HTA11_1391_2000001011HumanColorectumAD4.30e-148.96e-01-0.059
334APLP2HTA11_2992_2000001011HumanColorectumSER2.50e-027.99e-01-0.1706
334APLP2HTA11_5212_2000001011HumanColorectumAD3.49e-101.02e+00-0.2061
334APLP2HTA11_7862_2000001011HumanColorectumAD2.00e-035.97e-01-0.0179
334APLP2HTA11_866_3004761011HumanColorectumAD4.64e-136.52e-010.096
334APLP2HTA11_6801_2000001011HumanColorectumSER1.25e-027.31e-010.0171
334APLP2HTA11_7696_3000711011HumanColorectumAD4.35e-043.59e-010.0674
334APLP2HTA11_7469_2000001011HumanColorectumAD5.39e-071.07e+00-0.0124
334APLP2HTA11_99999970781_79442HumanColorectumMSS1.63e-054.52e-010.294
334APLP2HTA11_99999965062_69753HumanColorectumMSI-H1.89e-071.37e+000.3487
334APLP2HTA11_99999965104_69814HumanColorectumMSS3.36e-023.62e-010.281
334APLP2HTA11_99999971662_82457HumanColorectumMSS6.26e-291.33e+000.3859
Page: 1 2 3 4 5 6 7 8 9 10 11 12 13 

check button Transcriptomic changes along malignancy continuum.
TissueExpression DynamicsAbbreviation
Colorectum (GSE201348)The image shows the transcriptomic changes along malignancy continuum.log2FC in expression of this searched gene in stem-like cells from each diseased tissue sample relative to stem-like cells in normal samples in each tissue plotted against the malignancy continuum. Samples are colored based on if they are from different disease stage.FAP: Familial adenomatous polyposis
CRC: Colorectal cancer
Colorectum (HTA11)The image shows the transcriptomic changes along malignancy continuum.log2FC in expression of this searched gene in stem-like cells from each diseased tissue sample relative to stem-like cells in normal samples in each tissue plotted against the malignancy continuum. Samples are colored based on if they are from different disease stage.AD: Adenomas
SER: Sessile serrated lesions
MSI-H: Microsatellite-high colorectal cancer
MSS: Microsatellite stable colorectal cancer
EndometriumThe image shows the transcriptomic changes along malignancy continuum.log2FC in expression of this searched gene in stem-like cells from each diseased tissue sample relative to stem-like cells in normal samples in each tissue plotted against the malignancy continuum. Samples are colored based on if they are from different disease stage.AEH: Atypical endometrial hyperplasia
EEC: Endometrioid Cancer
EsophagusThe image shows the transcriptomic changes along malignancy continuum.log2FC in expression of this searched gene in stem-like cells from each diseased tissue sample relative to stem-like cells in normal samples in each tissue plotted against the malignancy continuum. Samples are colored based on if they are from different disease stage.ESCC: Esophageal squamous cell carcinoma
HGIN: High-grade intraepithelial neoplasias
LGIN: Low-grade intraepithelial neoplasias
GCThe image shows the transcriptomic changes along malignancy continuum.log2FC in expression of this searched gene in stem-like cells from each diseased tissue sample relative to stem-like cells in normal samples in each tissue plotted against the malignancy continuum. Samples are colored based on if they are from different disease stage.
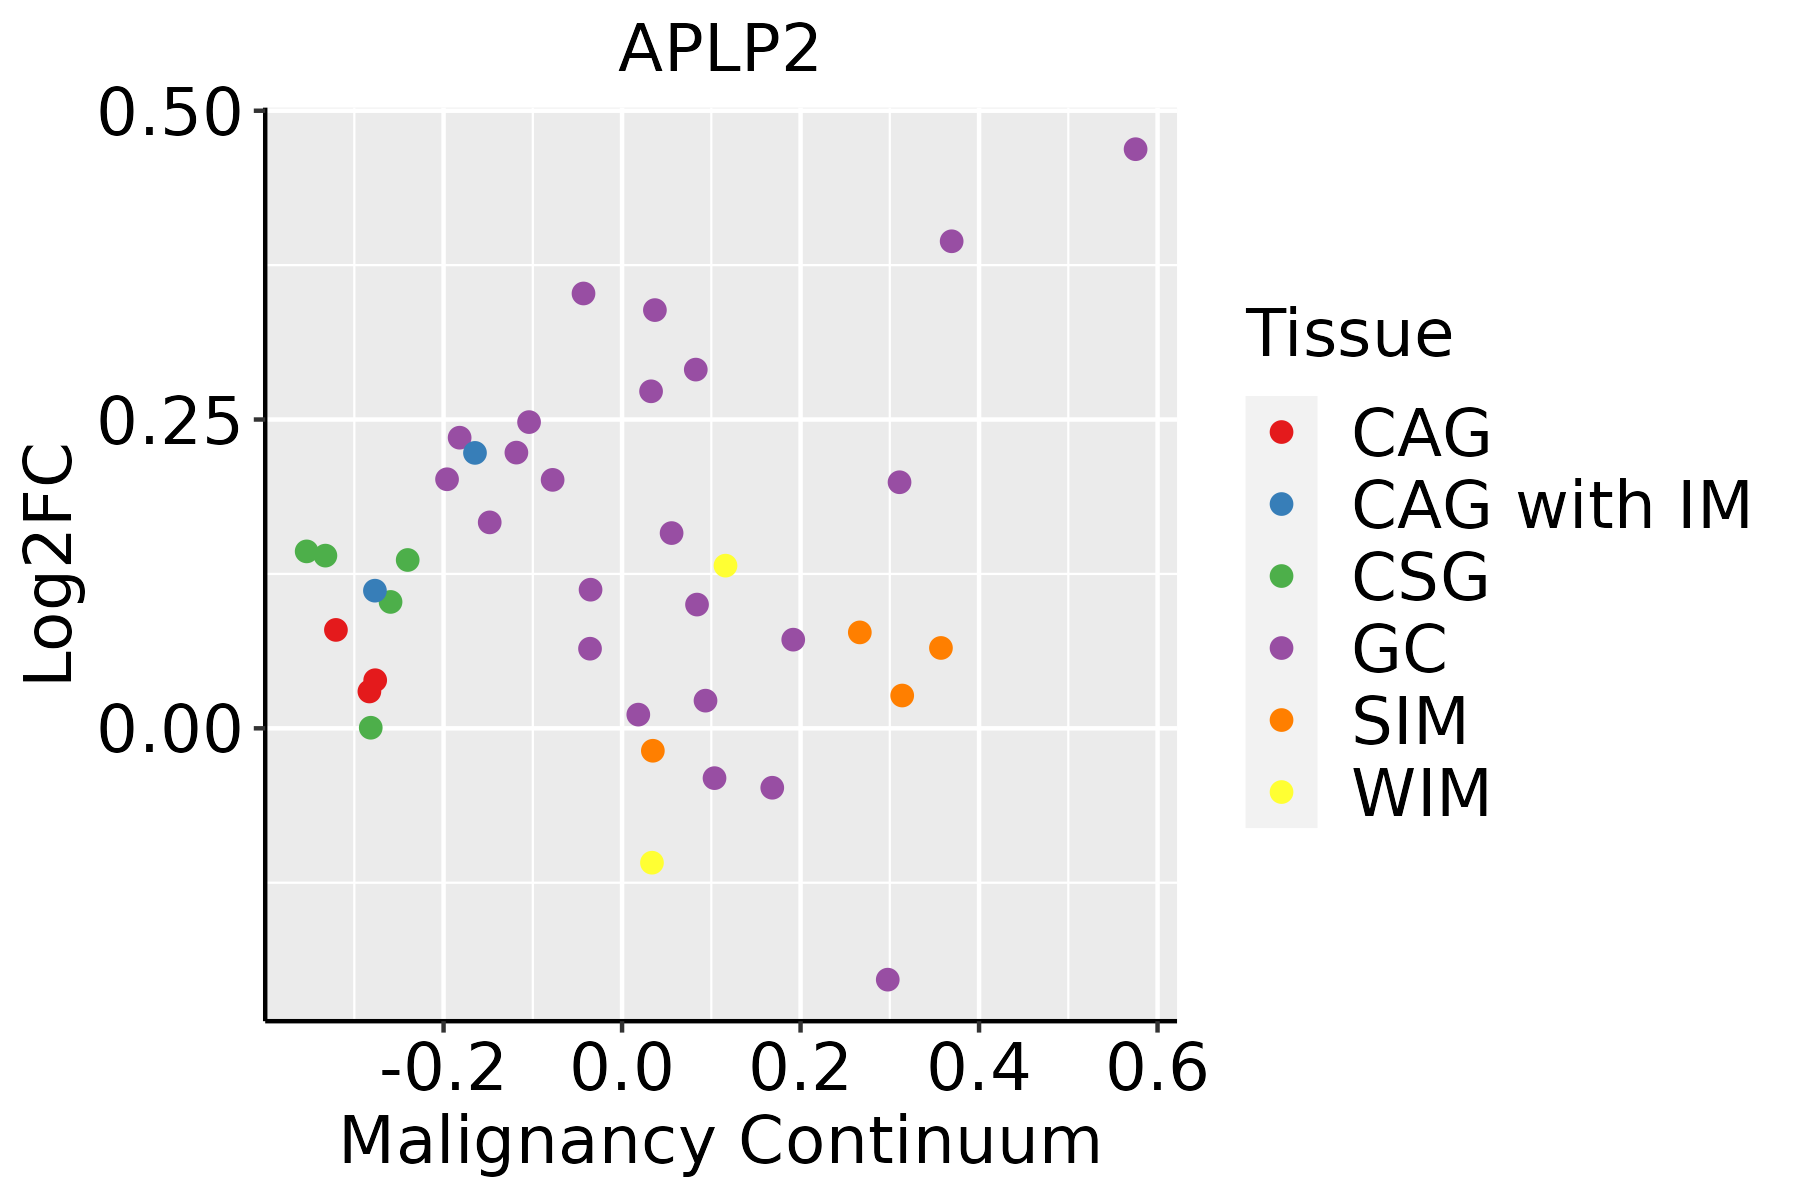
CAG: Chronic atrophic gastritis
CAG with IM: Chronic atrophic gastritis with intestinal metaplasia
CSG: Chronic superficial gastritis
GC: Gastric cancer
SIM: Severe intestinal metaplasia
WIM: Wild intestinal metaplasia
LiverThe image shows the transcriptomic changes along malignancy continuum.log2FC in expression of this searched gene in stem-like cells from each diseased tissue sample relative to stem-like cells in normal samples in each tissue plotted against the malignancy continuum. Samples are colored based on if they are from different disease stage.
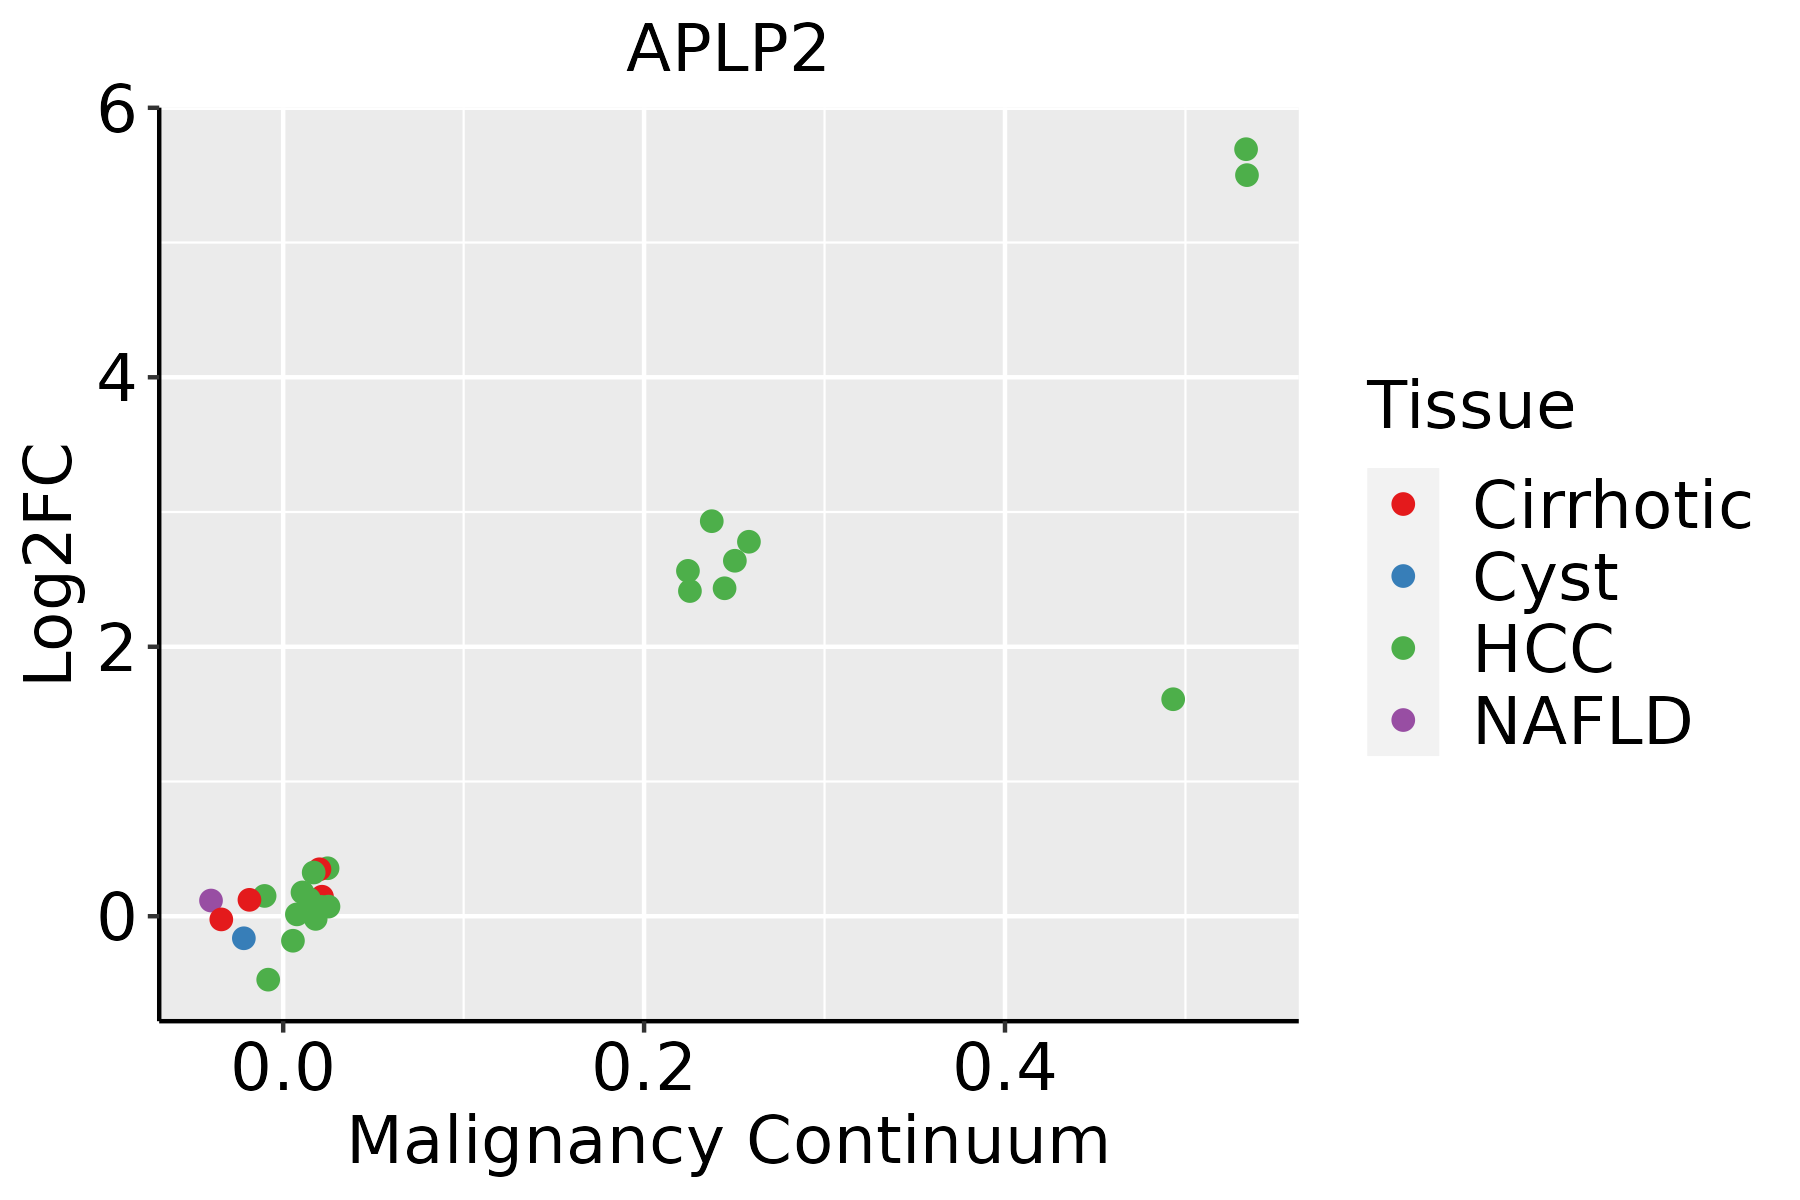
HCC: Hepatocellular carcinoma
NAFLD: Non-alcoholic fatty liver disease
Oral CavityThe image shows the transcriptomic changes along malignancy continuum.log2FC in expression of this searched gene in stem-like cells from each diseased tissue sample relative to stem-like cells in normal samples in each tissue plotted against the malignancy continuum. Samples are colored based on if they are from different disease stage.
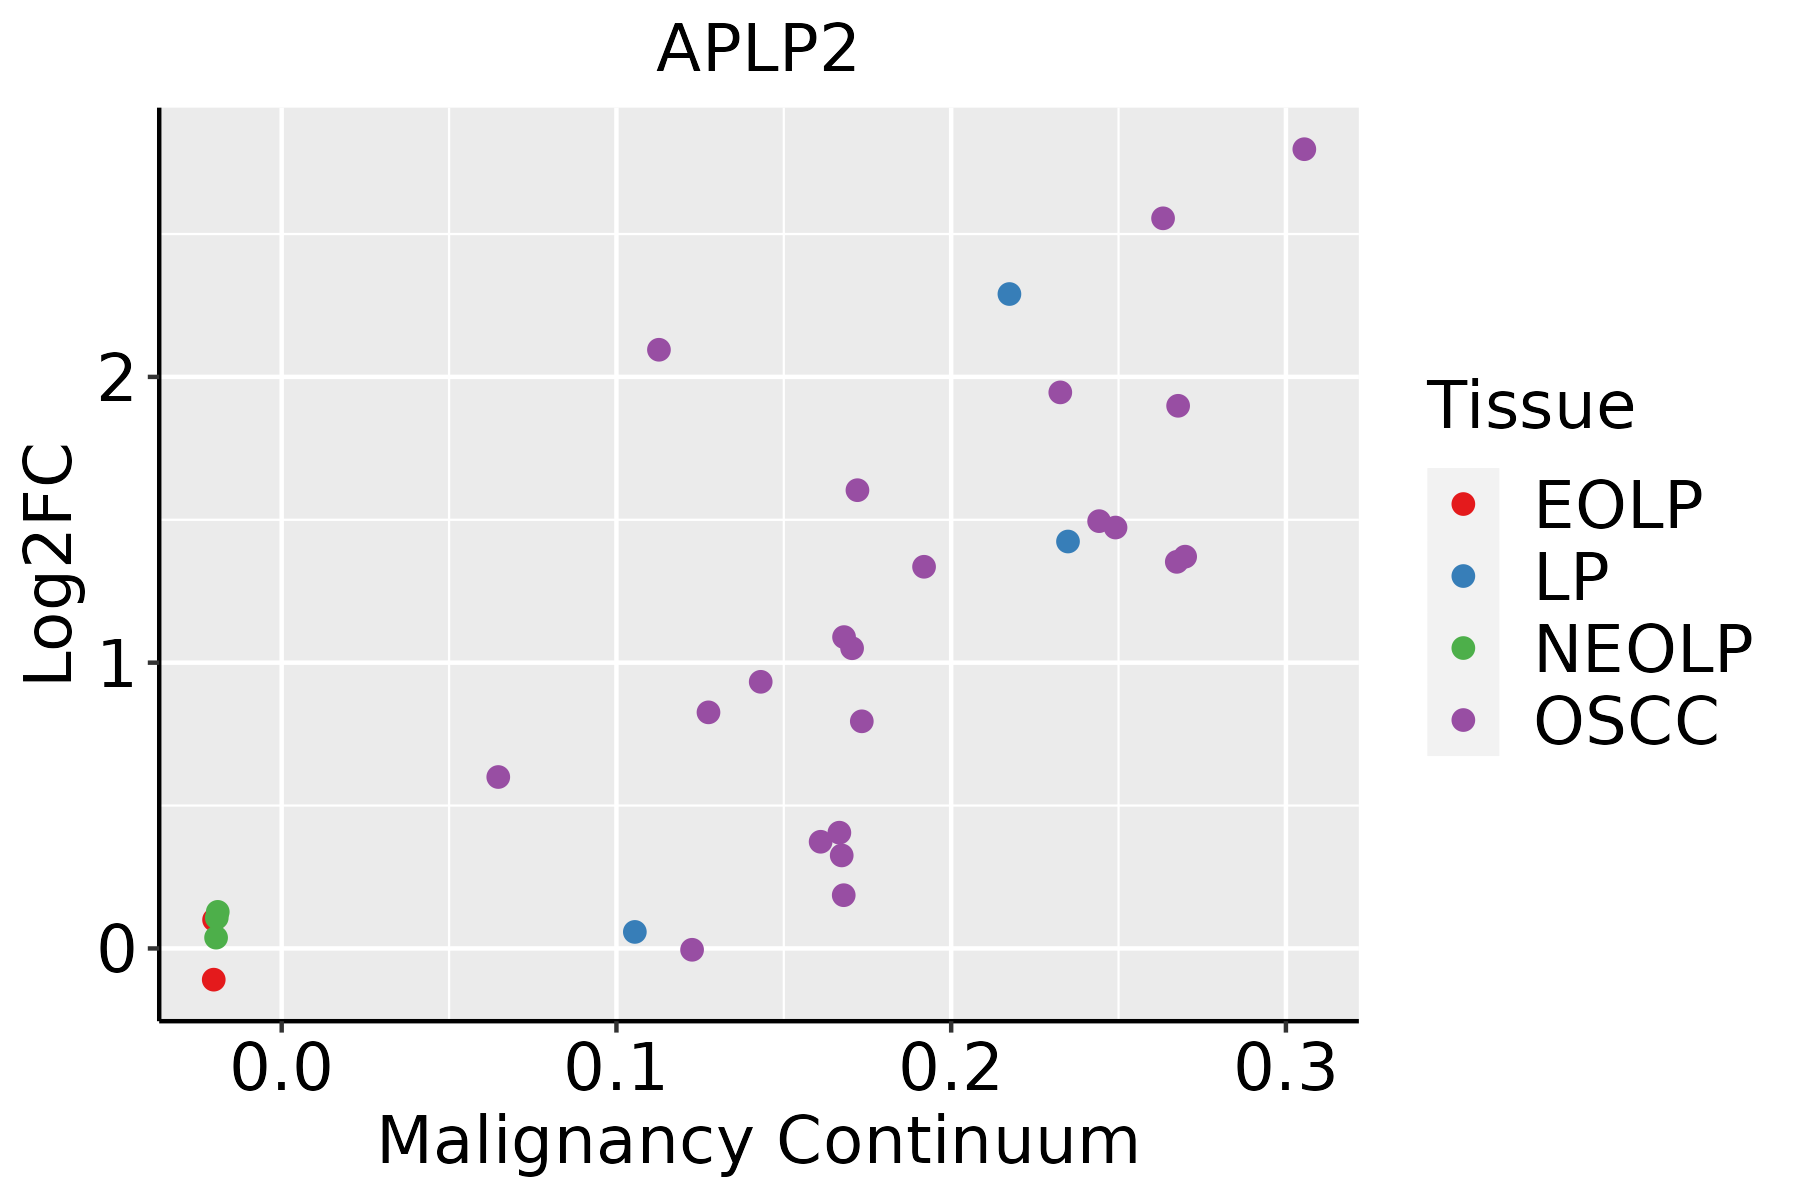
EOLP: Erosive Oral lichen planus
LP: leukoplakia
NEOLP: Non-erosive oral lichen planus
OSCC: Oral squamous cell carcinoma
ProstateThe image shows the transcriptomic changes along malignancy continuum.log2FC in expression of this searched gene in stem-like cells from each diseased tissue sample relative to stem-like cells in normal samples in each tissue plotted against the malignancy continuum. Samples are colored based on if they are from different disease stage.
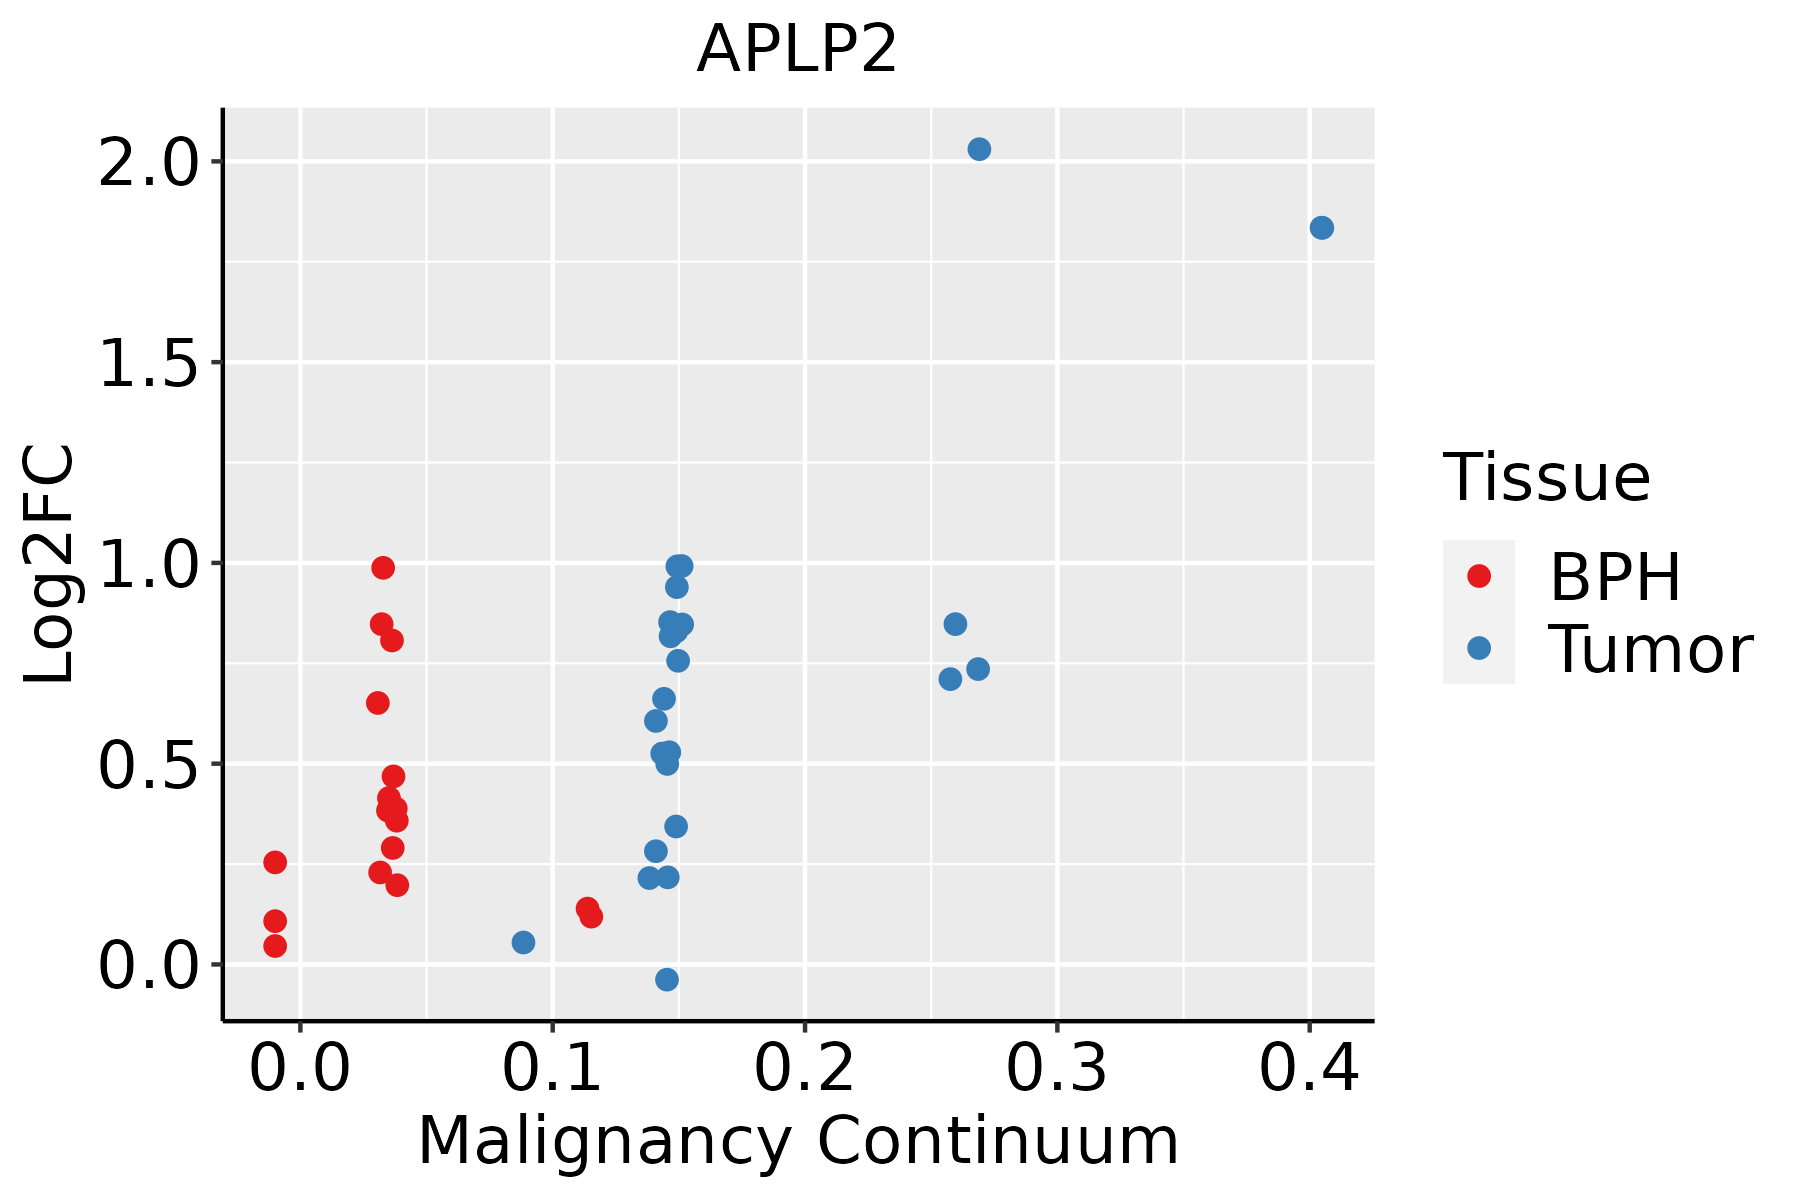
BPH: Benign Prostatic Hyperplasia
SkinThe image shows the transcriptomic changes along malignancy continuum.log2FC in expression of this searched gene in stem-like cells from each diseased tissue sample relative to stem-like cells in normal samples in each tissue plotted against the malignancy continuum. Samples are colored based on if they are from different disease stage.
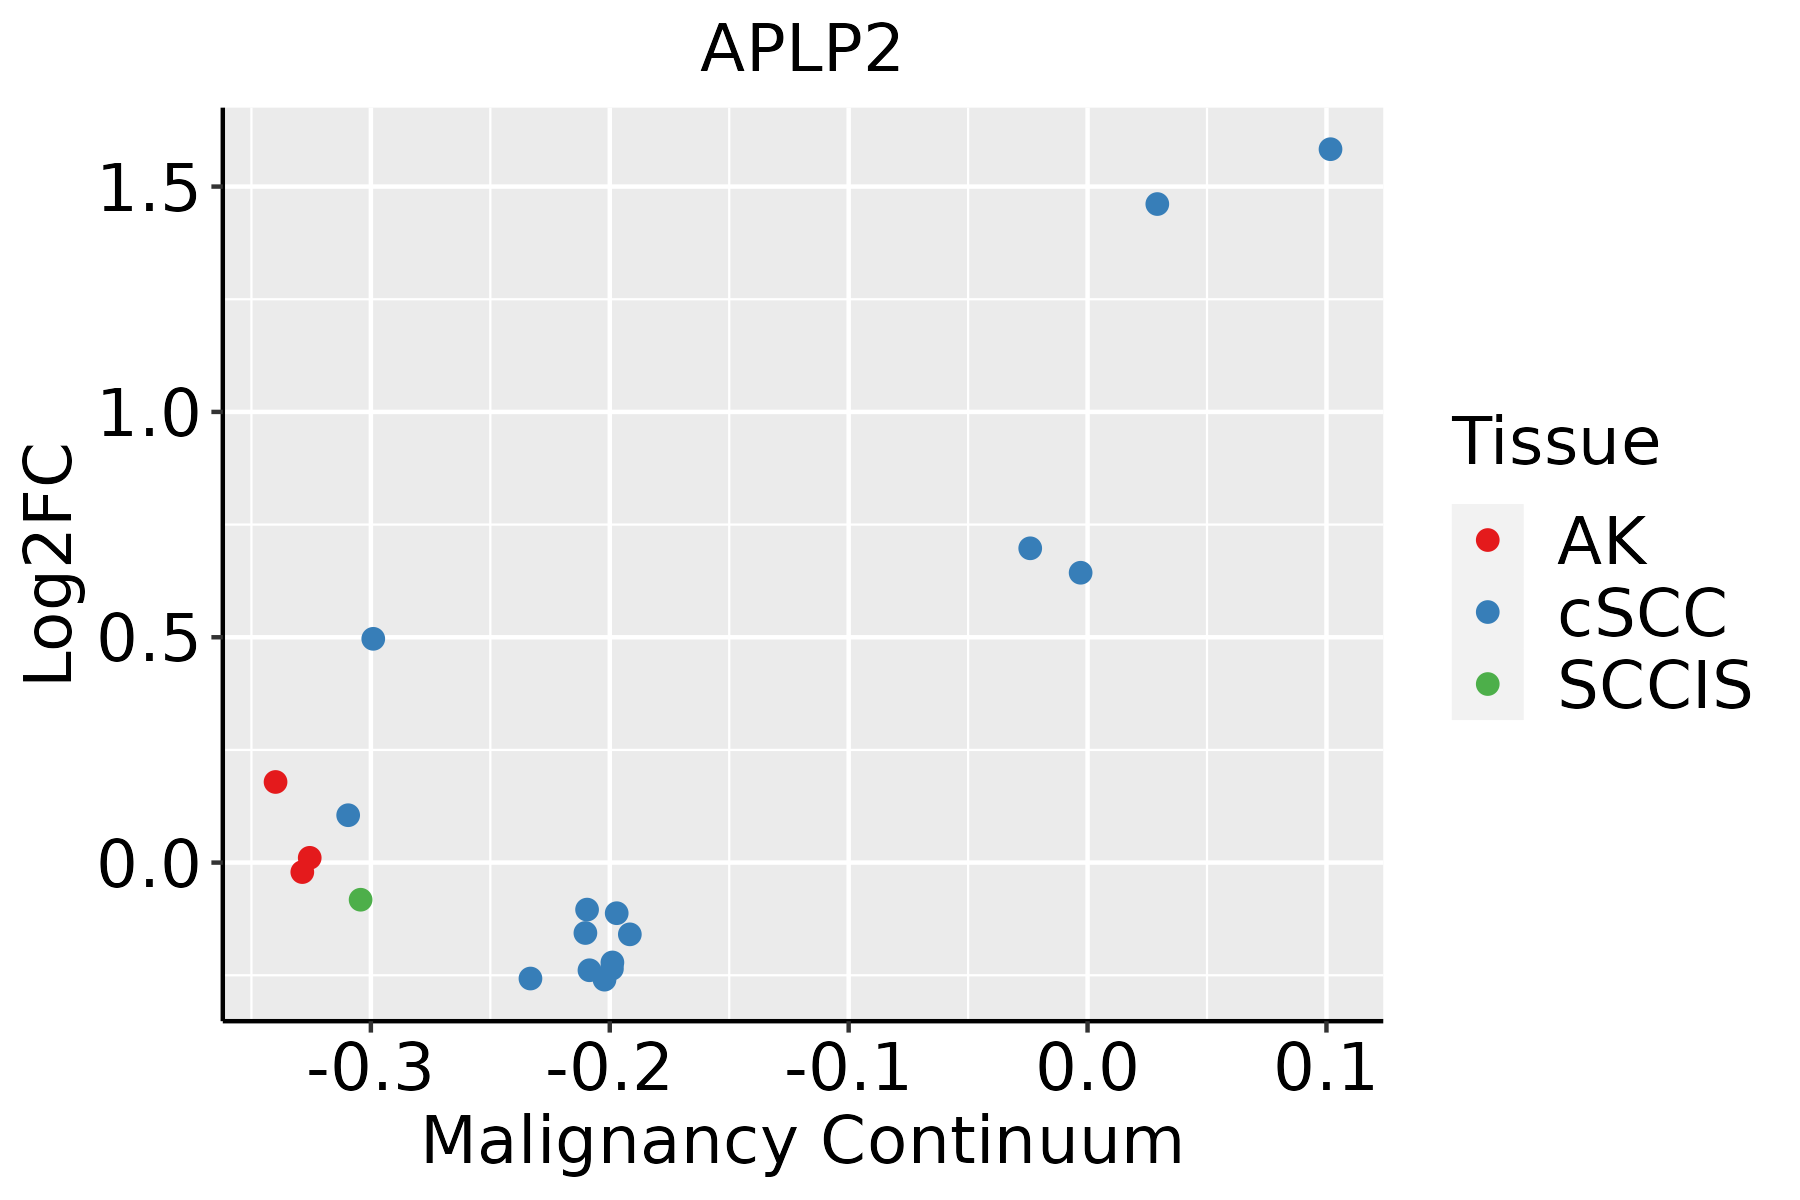
AK: Actinic keratosis
cSCC: Cutaneous squamous cell carcinoma
SCCIS:squamous cell carcinoma in situ
ThyroidThe image shows the transcriptomic changes along malignancy continuum.log2FC in expression of this searched gene in stem-like cells from each diseased tissue sample relative to stem-like cells in normal samples in each tissue plotted against the malignancy continuum. Samples are colored based on if they are from different disease stage.
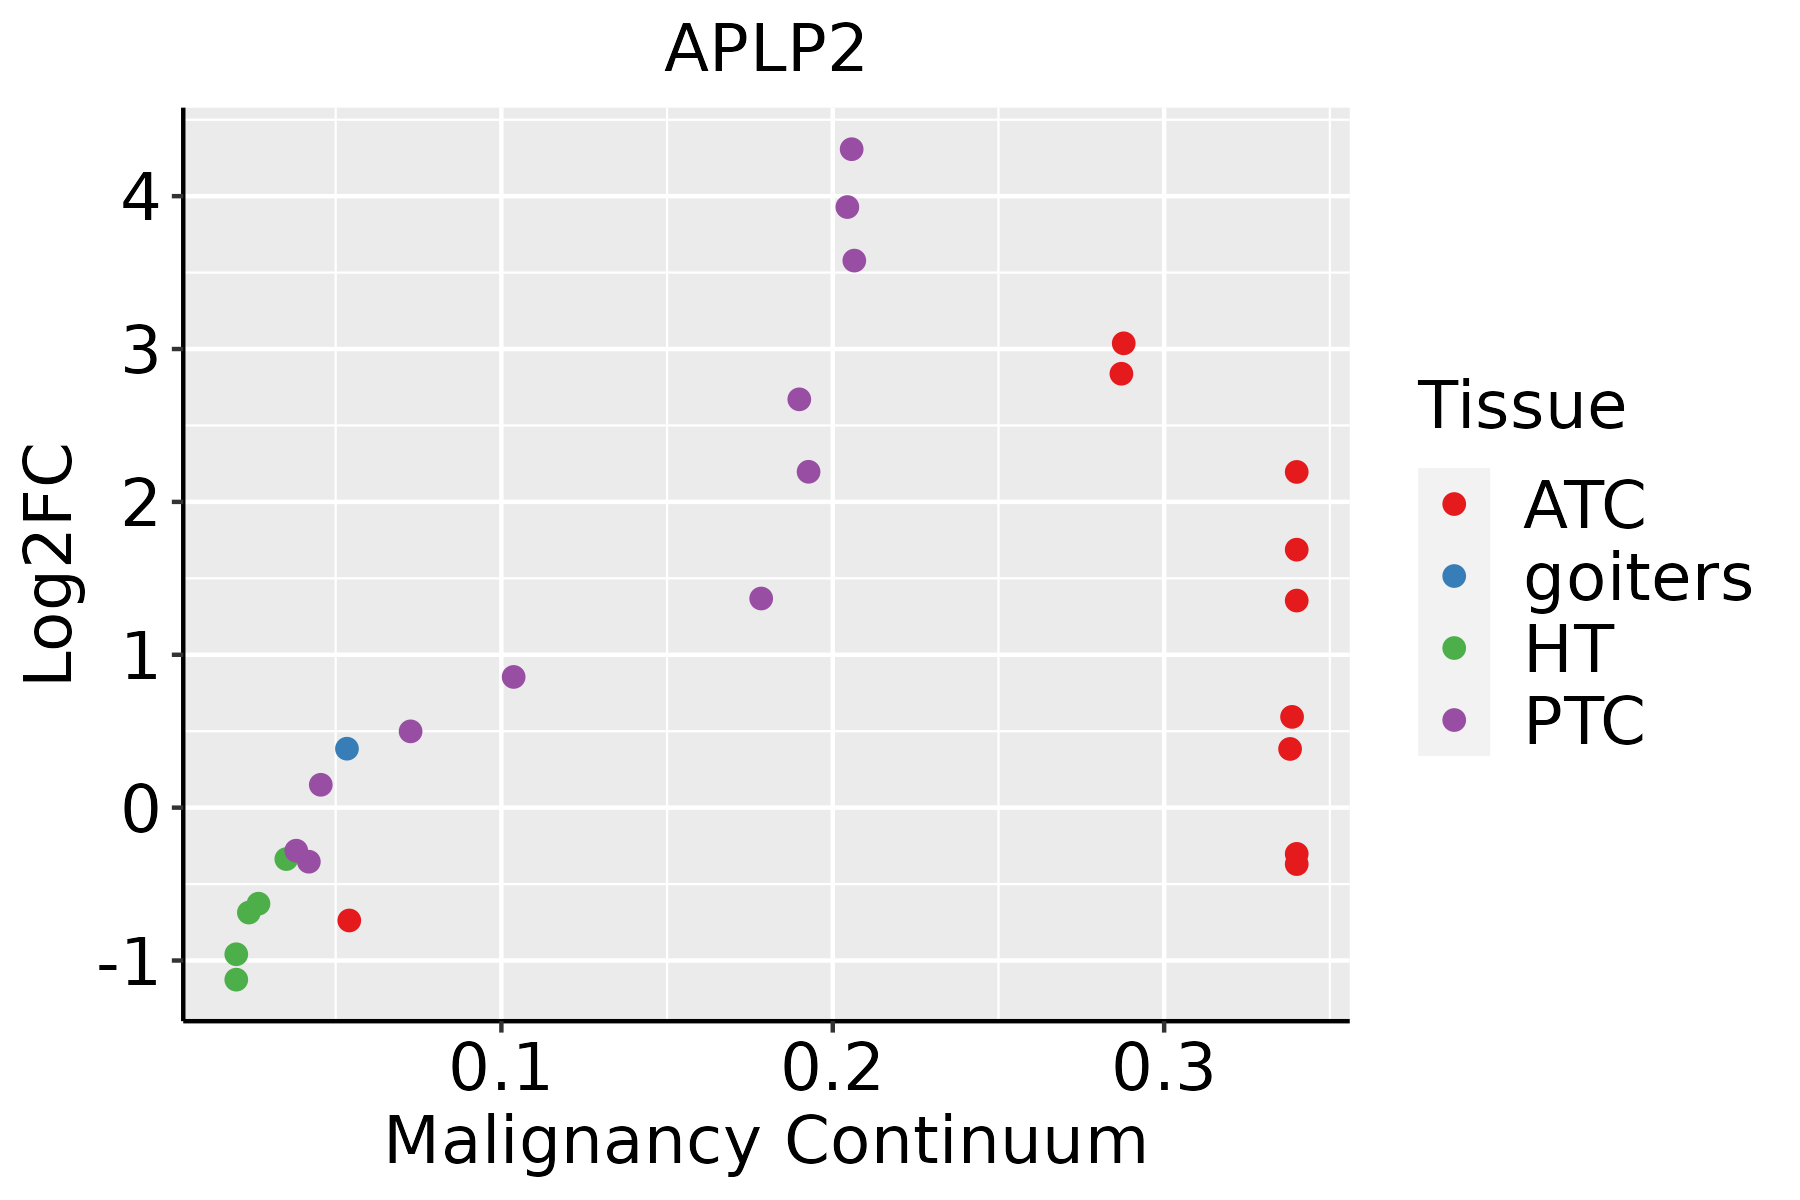
ATC: Anaplastic thyroid cancer
HT: Hashimoto's thyroiditis
PTC: Papillary thyroid cancer
∗log2FC in expression of this searched gene in stem-like cells from each diseased tissue sample relative to stem-like cells in normal samples in each tissue plotted against the malignancy continuum. Samples are colored based on if they are from different disease stage.

Top

Malignant transformation related pathway analysis

check buttonFind out the enriched GO biological processes and KEGG pathways involved in transition from healthy to precancer to cancer
check button Figure of enriched GO biological processes.
TissueDisease StageEnriched GO biological Processes
ColorectumADGO analysis - Figure of enriched GO biological processes: Top 15 enriched GO BP terms are showed in the bar plot of each disease state in each tissue. Each row represents a significant GO biological process which is colored according to the -log10(p.adjust).
ColorectumSERGO analysis - Figure of enriched GO biological processes: Top 15 enriched GO BP terms are showed in the bar plot of each disease state in each tissue. Each row represents a significant GO biological process which is colored according to the -log10(p.adjust).
ColorectumMSSGO analysis - Figure of enriched GO biological processes: Top 15 enriched GO BP terms are showed in the bar plot of each disease state in each tissue. Each row represents a significant GO biological process which is colored according to the -log10(p.adjust).
ColorectumMSI-HGO analysis - Figure of enriched GO biological processes: Top 15 enriched GO BP terms are showed in the bar plot of each disease state in each tissue. Each row represents a significant GO biological process which is colored according to the -log10(p.adjust).
ColorectumFAPGO analysis - Figure of enriched GO biological processes: Top 15 enriched GO BP terms are showed in the bar plot of each disease state in each tissue. Each row represents a significant GO biological process which is colored according to the -log10(p.adjust).
∗Top 15 enriched GO BP terms are showed in the bar plot of each disease state in each tissue. Each row represents a significant GO biological process which is colored according to the -log10(p.adjust).
Page: 1 2 3 4 5 6 7 8 9 

check button Enriched GO biological processes.
GO IDTissueDisease StageDescriptionGene RatioBg Ratiopvaluep.adjustCount
GO:0052547ColorectumADregulation of peptidase activity137/3918461/187234.12e-061.12e-04137
GO:0045861ColorectumADnegative regulation of proteolysis106/3918351/187232.33e-054.57e-04106
GO:0052548ColorectumADregulation of endopeptidase activity124/3918432/187236.58e-051.07e-03124
GO:00525471ColorectumSERregulation of peptidase activity114/2897461/187231.18e-077.17e-06114
GO:00458611ColorectumSERnegative regulation of proteolysis88/2897351/187231.74e-067.50e-0588
GO:00525481ColorectumSERregulation of endopeptidase activity103/2897432/187232.86e-061.16e-04103
GO:0051346ColorectumSERnegative regulation of hydrolase activity82/2897379/187238.19e-041.01e-0282
GO:0010466ColorectumSERnegative regulation of peptidase activity57/2897262/187234.15e-033.38e-0257
GO:00525472ColorectumMSSregulation of peptidase activity130/3467461/187231.81e-078.13e-06130
GO:00525482ColorectumMSSregulation of endopeptidase activity117/3467432/187236.25e-061.65e-04117
GO:00458612ColorectumMSSnegative regulation of proteolysis97/3467351/187231.57e-053.54e-0497
GO:00513461ColorectumMSSnegative regulation of hydrolase activity92/3467379/187232.85e-032.22e-0292
GO:00458613ColorectumMSI-Hnegative regulation of proteolysis55/1319351/187231.75e-081.98e-0655
GO:00525473ColorectumMSI-Hregulation of peptidase activity66/1319461/187232.63e-082.81e-0666
GO:00525483ColorectumMSI-Hregulation of endopeptidase activity60/1319432/187233.29e-072.57e-0560
GO:00513462ColorectumMSI-Hnegative regulation of hydrolase activity48/1319379/187235.58e-051.92e-0348
GO:00104661ColorectumMSI-Hnegative regulation of peptidase activity35/1319262/187231.95e-045.30e-0335
GO:0010951ColorectumMSI-Hnegative regulation of endopeptidase activity33/1319252/187234.22e-049.23e-0333
GO:00525474ColorectumFAPregulation of peptidase activity86/2622461/187232.98e-032.27e-0286
GO:00458614ColorectumFAPnegative regulation of proteolysis68/2622351/187233.07e-032.31e-0268
Page: 1 2 3 4 5 6 7 8 

check button Enriched KEGG pathways.
Pathway IDTissueDisease StageDescriptionGene RatioBg Ratiopvaluep.adjustqvalueCount
Page: 1 

Top

Cell-cell communication analysis

check buttonIdentification of potential cell-cell interactions between two cell types and their ligand-receptor pairs for different disease states
LigandReceptorLRpairPathwayTissueDisease Stage
Page: 1 

Top

Single-cell gene regulatory network inference analysis

check buttonFind out the significant the regulons (TFs) and the target genes of each regulon across cell types for different disease states
TFCell TypeTissueDisease StageTarget GeneRSSRegulon Activity
∗The dot plots of a searched regulon are shown for all cell subpopulations in each disease state of each tissue based on the regulon specific score inferred using pySCENIC and by calculating the average expression.
Page: 1 

Top

Somatic mutation of malignant transformation related genes

check buttonAnnotation of somatic variants for genes involved in malignant transformation
Hugo SymbolVariant ClassVariant ClassificationdbSNP RSHGVScHGVSpHGVSp ShortSWISSPROTBIOTYPESIFTPolyPhenTumor Sample BarcodeTissueHistologySexAgeStageTherapy TypesDrugsOutcome
APLP2SNVMissense_Mutationnovelc.1678N>Ap.Glu560Lysp.E560KQ06481protein_codingdeleterious(0)probably_damaging(0.995)TCGA-BH-A0HF-01Breastbreast invasive carcinomaFemale>=65I/IIHormone TherapyarimidexSD
APLP2SNVMissense_Mutationc.992N>Gp.Ser331Cysp.S331CQ06481protein_codingtolerated(0.08)possibly_damaging(0.806)TCGA-D8-A1JA-01Breastbreast invasive carcinomaFemale<65III/IVChemotherapyadriamycinPD
APLP2insertionIn_Frame_Insnovelc.897_898insCTGGCTp.Asp299_Lys300insLeuAlap.D299_K300insLAQ06481protein_codingTCGA-A2-A0EQ-01Breastbreast invasive carcinomaFemale<65I/IIChemotherapyadriamycinSD
APLP2insertionIn_Frame_Insnovelc.899_900insCATp.Lys300delinsAsnMetp.K300delinsNMQ06481protein_codingTCGA-A2-A0EQ-01Breastbreast invasive carcinomaFemale<65I/IIChemotherapyadriamycinSD
APLP2insertionFrame_Shift_Insnovelc.887_888insTGCTAAACCATTTGAAAGTAAGTTGGGATATCACGACAGTTp.Met297AlafsTer33p.M297Afs*33Q06481protein_codingTCGA-A8-A079-01Breastbreast invasive carcinomaFemale>=65III/IVChemotherapy5-fluorouracilSD
APLP2insertionFrame_Shift_Insnovelc.1651_1652insTTCGCTCAAGTGATCCTGCTGTp.Pro551LeufsTer19p.P551Lfs*19Q06481protein_codingTCGA-A8-A08H-01Breastbreast invasive carcinomaFemale>=65I/IIUnknownUnknownSD
APLP2insertionIn_Frame_Insnovelc.1084_1085insTTCTGCTAGAGTTGATTAAGCTTGCATTTCATTp.Ala362delinsValLeuLeuGluLeuIleLysLeuAlaPheHisSerp.A362delinsVLLELIKLAFHSQ06481protein_codingTCGA-A8-A0A7-01Breastbreast invasive carcinomaFemale<65I/IIUnknownUnknownSD
APLP2deletionFrame_Shift_Delc.1613delNp.Arg539GlyfsTer15p.R539Gfs*15Q06481protein_codingTCGA-AR-A0TR-01Breastbreast invasive carcinomaFemale>=65I/IIHormone TherapytamoxiphenSD
APLP2insertionFrame_Shift_Insnovelc.1866_1867insAp.Gly625ArgfsTer20p.G625Rfs*20Q06481protein_codingTCGA-C8-A12X-01Breastbreast invasive carcinomaFemale<65I/IIUnknownUnknownSD
APLP2SNVMissense_Mutationrs141638912c.974N>Ap.Arg325Hisp.R325HQ06481protein_codingdeleterious(0)probably_damaging(0.999)TCGA-2W-A8YY-01Cervixcervical & endocervical cancerFemale<65I/IIChemotherapycisplatinCR
Page: 1 2 3 4 5 6 7 8 

Top

Related drugs of malignant transformation related genes

check buttonIdentification of chemicals and drugs interact with genes involved in malignant transfromation
(DGIdb 4.0)
Entrez IDSymbolCategoryInteraction TypesDrug Claim NameDrug NamePMIDs
Page: 1