
|
|||||
|
 | |
| |
| |
| |
| |
| |
|
Gene: APH1B |
Gene summary for APH1B |
| Gene information | Species | Human | Gene symbol | APH1B | Gene ID | 83464 |
| Gene name | aph-1 homolog B, gamma-secretase subunit | |
| Gene Alias | APH-1B | |
| Cytomap | 15q22.2 | |
| Gene Type | protein-coding | GO ID | GO:0006508 | UniProtAcc | Q8WW43 |
Top |
Malignant transformation analysis |
| Identification of the aberrant gene expression in precancerous and cancerous lesions by comparing the gene expression of stem-like cells in diseased tissues with normal stem cells |
| Entrez ID | Symbol | Replicates | Species | Organ | Tissue | Adj P-value | Log2FC | Malignancy |
| 83464 | APH1B | LZE4T | Human | Esophagus | ESCC | 1.06e-04 | 1.27e-01 | 0.0811 |
| 83464 | APH1B | LZE24T | Human | Esophagus | ESCC | 2.95e-04 | 1.05e-01 | 0.0596 |
| 83464 | APH1B | P1T-E | Human | Esophagus | ESCC | 7.05e-03 | 2.12e-01 | 0.0875 |
| 83464 | APH1B | P2T-E | Human | Esophagus | ESCC | 8.36e-06 | 7.94e-02 | 0.1177 |
| 83464 | APH1B | P4T-E | Human | Esophagus | ESCC | 3.96e-16 | 2.80e-01 | 0.1323 |
| 83464 | APH1B | P5T-E | Human | Esophagus | ESCC | 9.02e-07 | 1.47e-01 | 0.1327 |
| 83464 | APH1B | P8T-E | Human | Esophagus | ESCC | 1.02e-08 | 1.04e-01 | 0.0889 |
| 83464 | APH1B | P9T-E | Human | Esophagus | ESCC | 1.50e-03 | 1.03e-01 | 0.1131 |
| 83464 | APH1B | P10T-E | Human | Esophagus | ESCC | 6.07e-12 | 2.14e-01 | 0.116 |
| 83464 | APH1B | P12T-E | Human | Esophagus | ESCC | 3.90e-19 | 3.41e-01 | 0.1122 |
| 83464 | APH1B | P15T-E | Human | Esophagus | ESCC | 7.83e-14 | 2.70e-01 | 0.1149 |
| 83464 | APH1B | P16T-E | Human | Esophagus | ESCC | 1.66e-09 | 1.03e-01 | 0.1153 |
| 83464 | APH1B | P20T-E | Human | Esophagus | ESCC | 9.73e-04 | 4.19e-02 | 0.1124 |
| 83464 | APH1B | P21T-E | Human | Esophagus | ESCC | 5.45e-05 | 1.69e-01 | 0.1617 |
| 83464 | APH1B | P22T-E | Human | Esophagus | ESCC | 8.85e-11 | 2.06e-01 | 0.1236 |
| 83464 | APH1B | P23T-E | Human | Esophagus | ESCC | 1.25e-02 | 7.52e-02 | 0.108 |
| 83464 | APH1B | P24T-E | Human | Esophagus | ESCC | 1.50e-07 | 5.34e-02 | 0.1287 |
| 83464 | APH1B | P26T-E | Human | Esophagus | ESCC | 4.80e-13 | 1.83e-01 | 0.1276 |
| 83464 | APH1B | P27T-E | Human | Esophagus | ESCC | 6.56e-10 | 1.13e-01 | 0.1055 |
| 83464 | APH1B | P28T-E | Human | Esophagus | ESCC | 7.73e-06 | 1.39e-01 | 0.1149 |
| Page: 1 2 3 4 5 |
| Tissue | Expression Dynamics | Abbreviation |
| Esophagus | 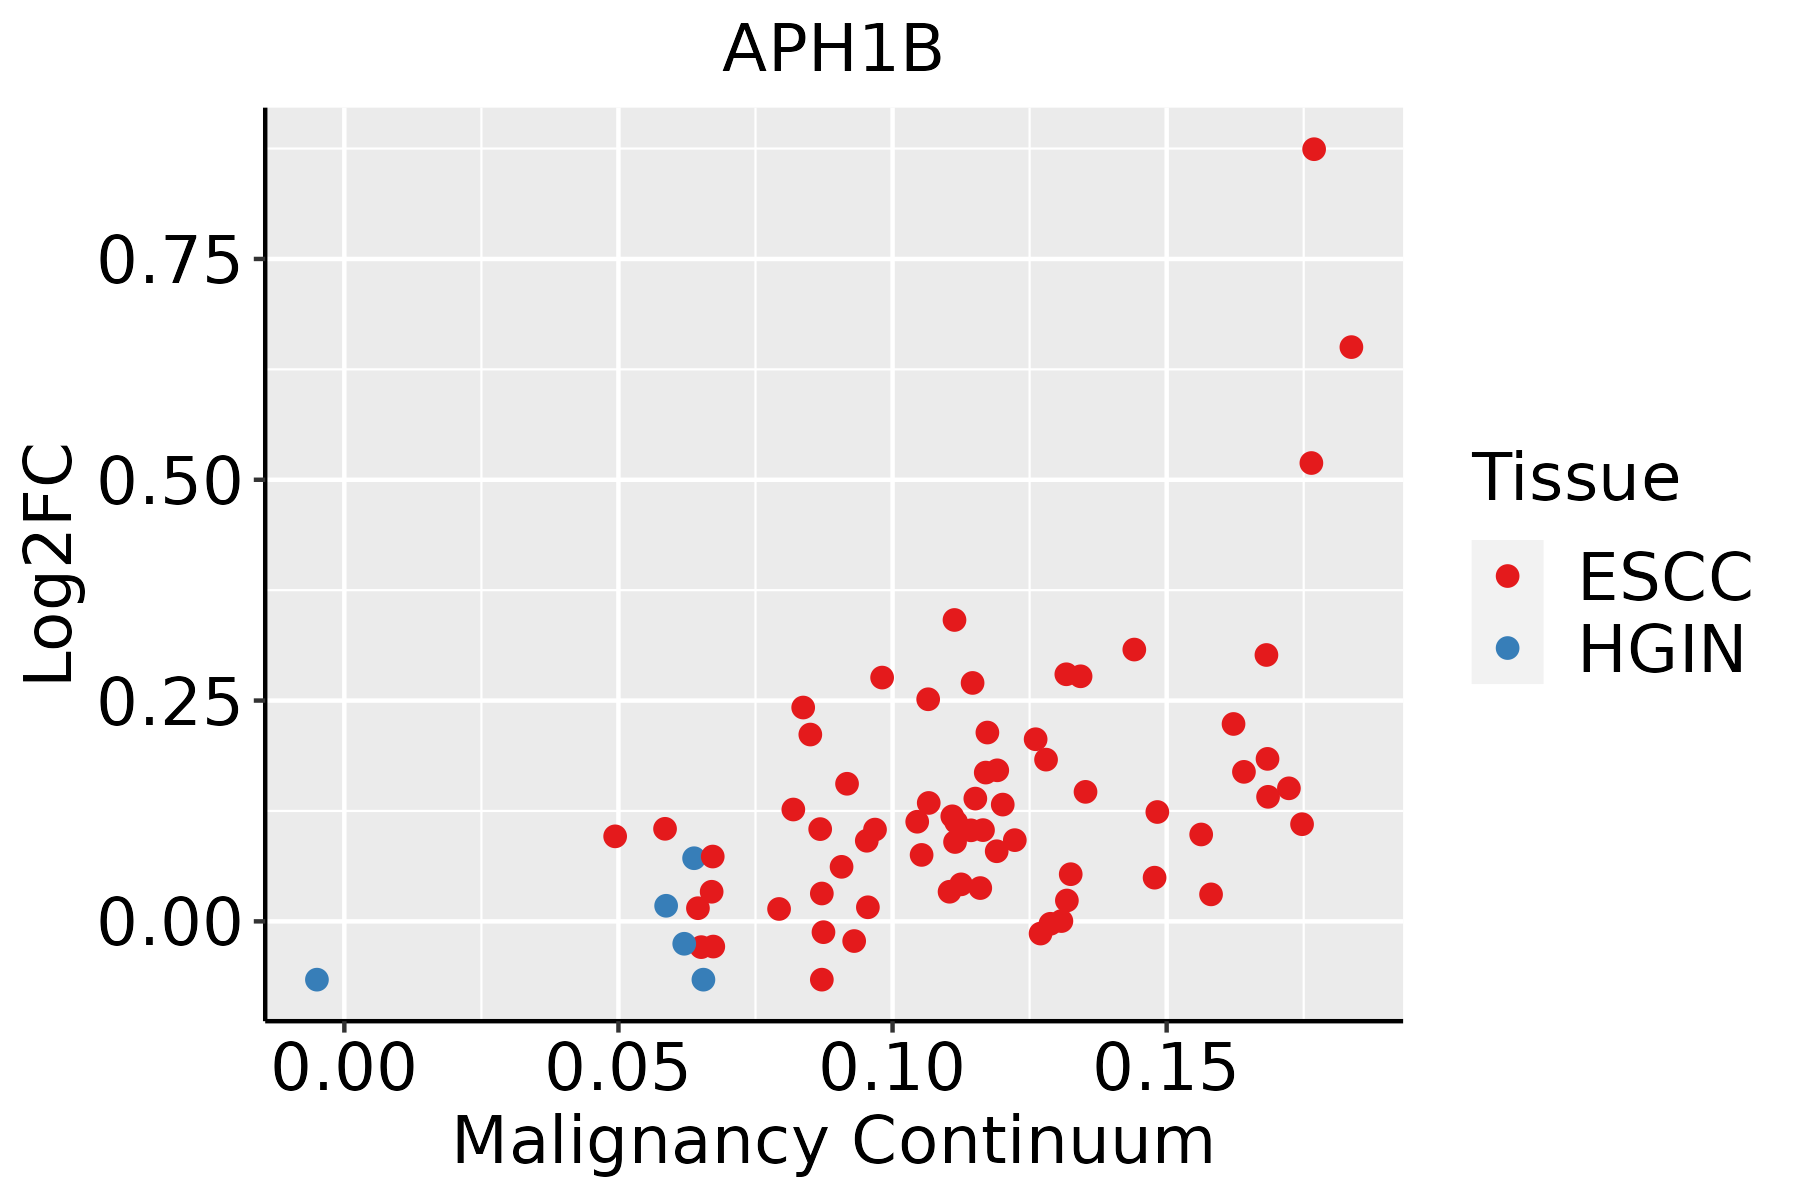 | ESCC: Esophageal squamous cell carcinoma |
| HGIN: High-grade intraepithelial neoplasias | ||
| LGIN: Low-grade intraepithelial neoplasias | ||
| Liver |  | HCC: Hepatocellular carcinoma |
| NAFLD: Non-alcoholic fatty liver disease | ||
| Oral Cavity | 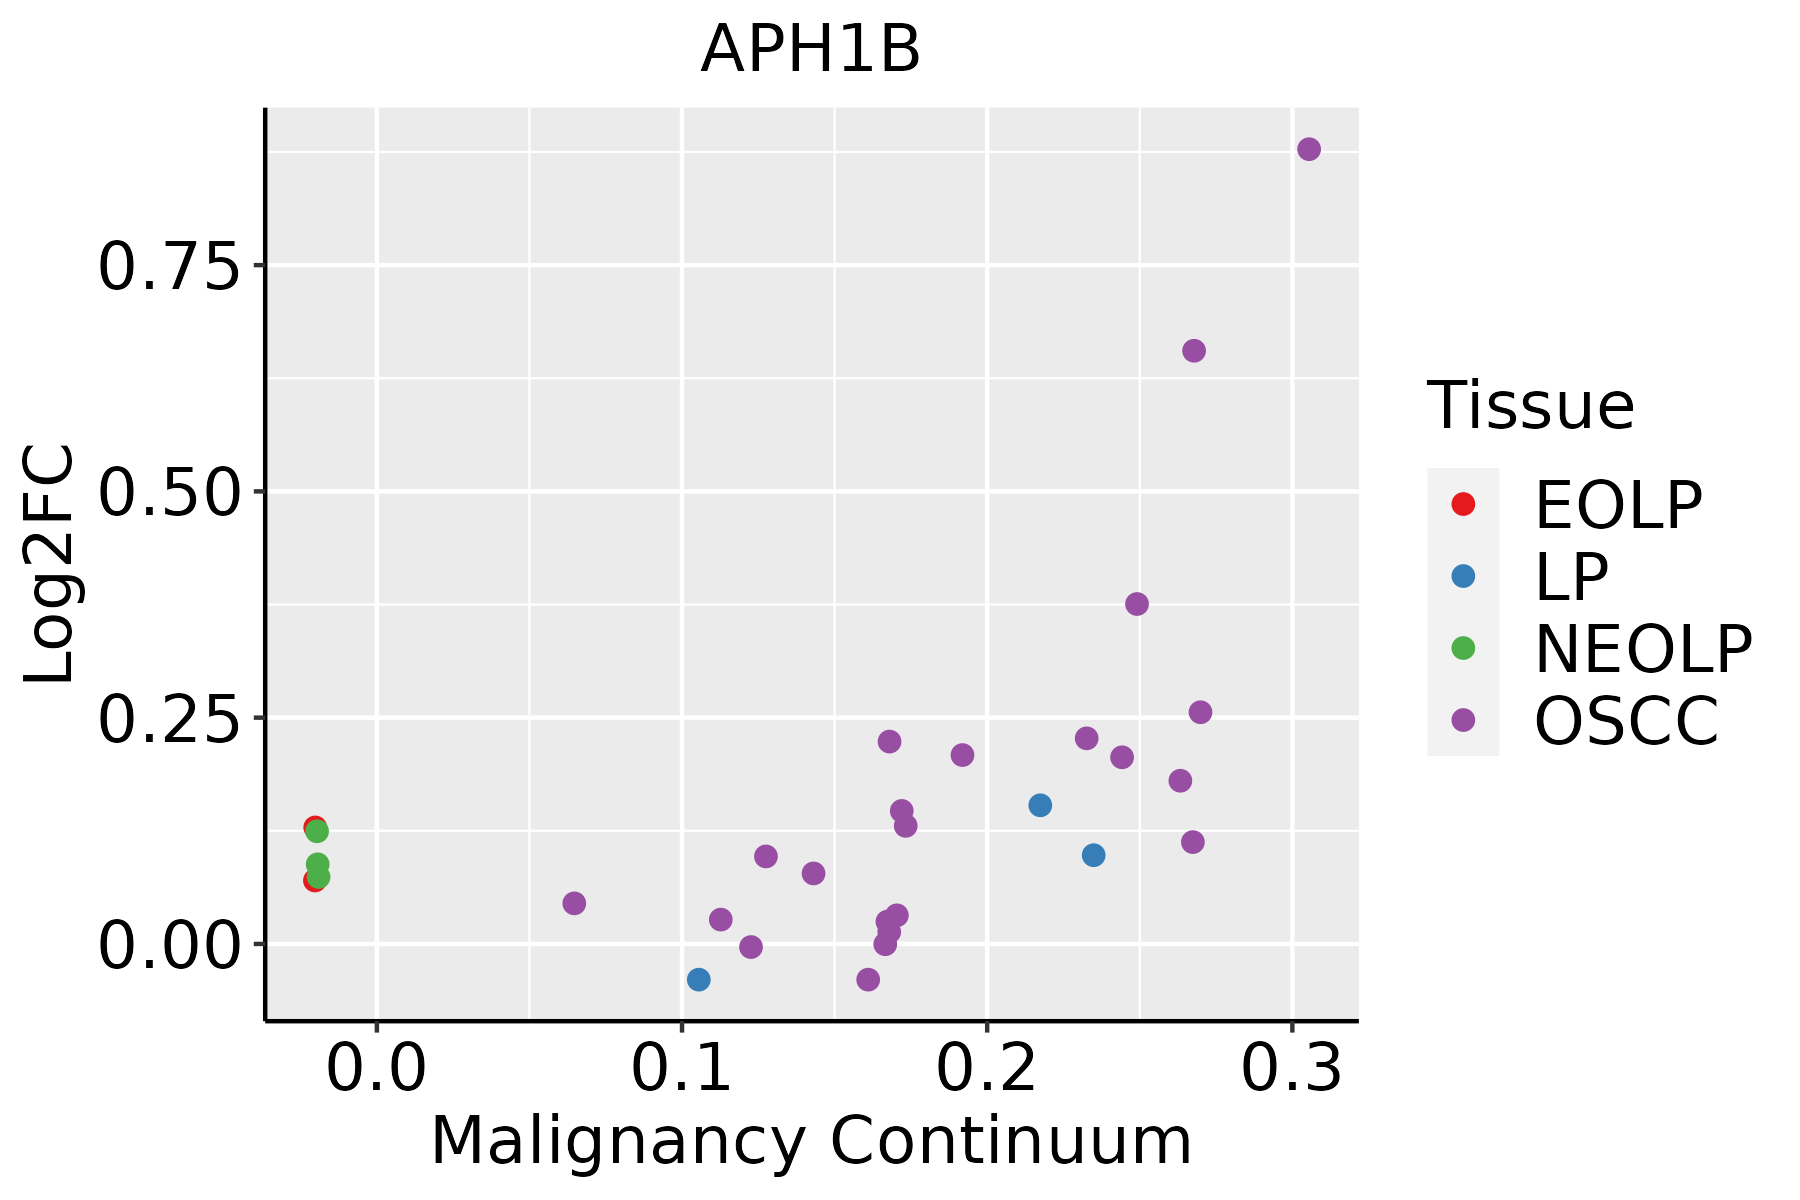 | EOLP: Erosive Oral lichen planus |
| LP: leukoplakia | ||
| NEOLP: Non-erosive oral lichen planus | ||
| OSCC: Oral squamous cell carcinoma | ||
| Thyroid | 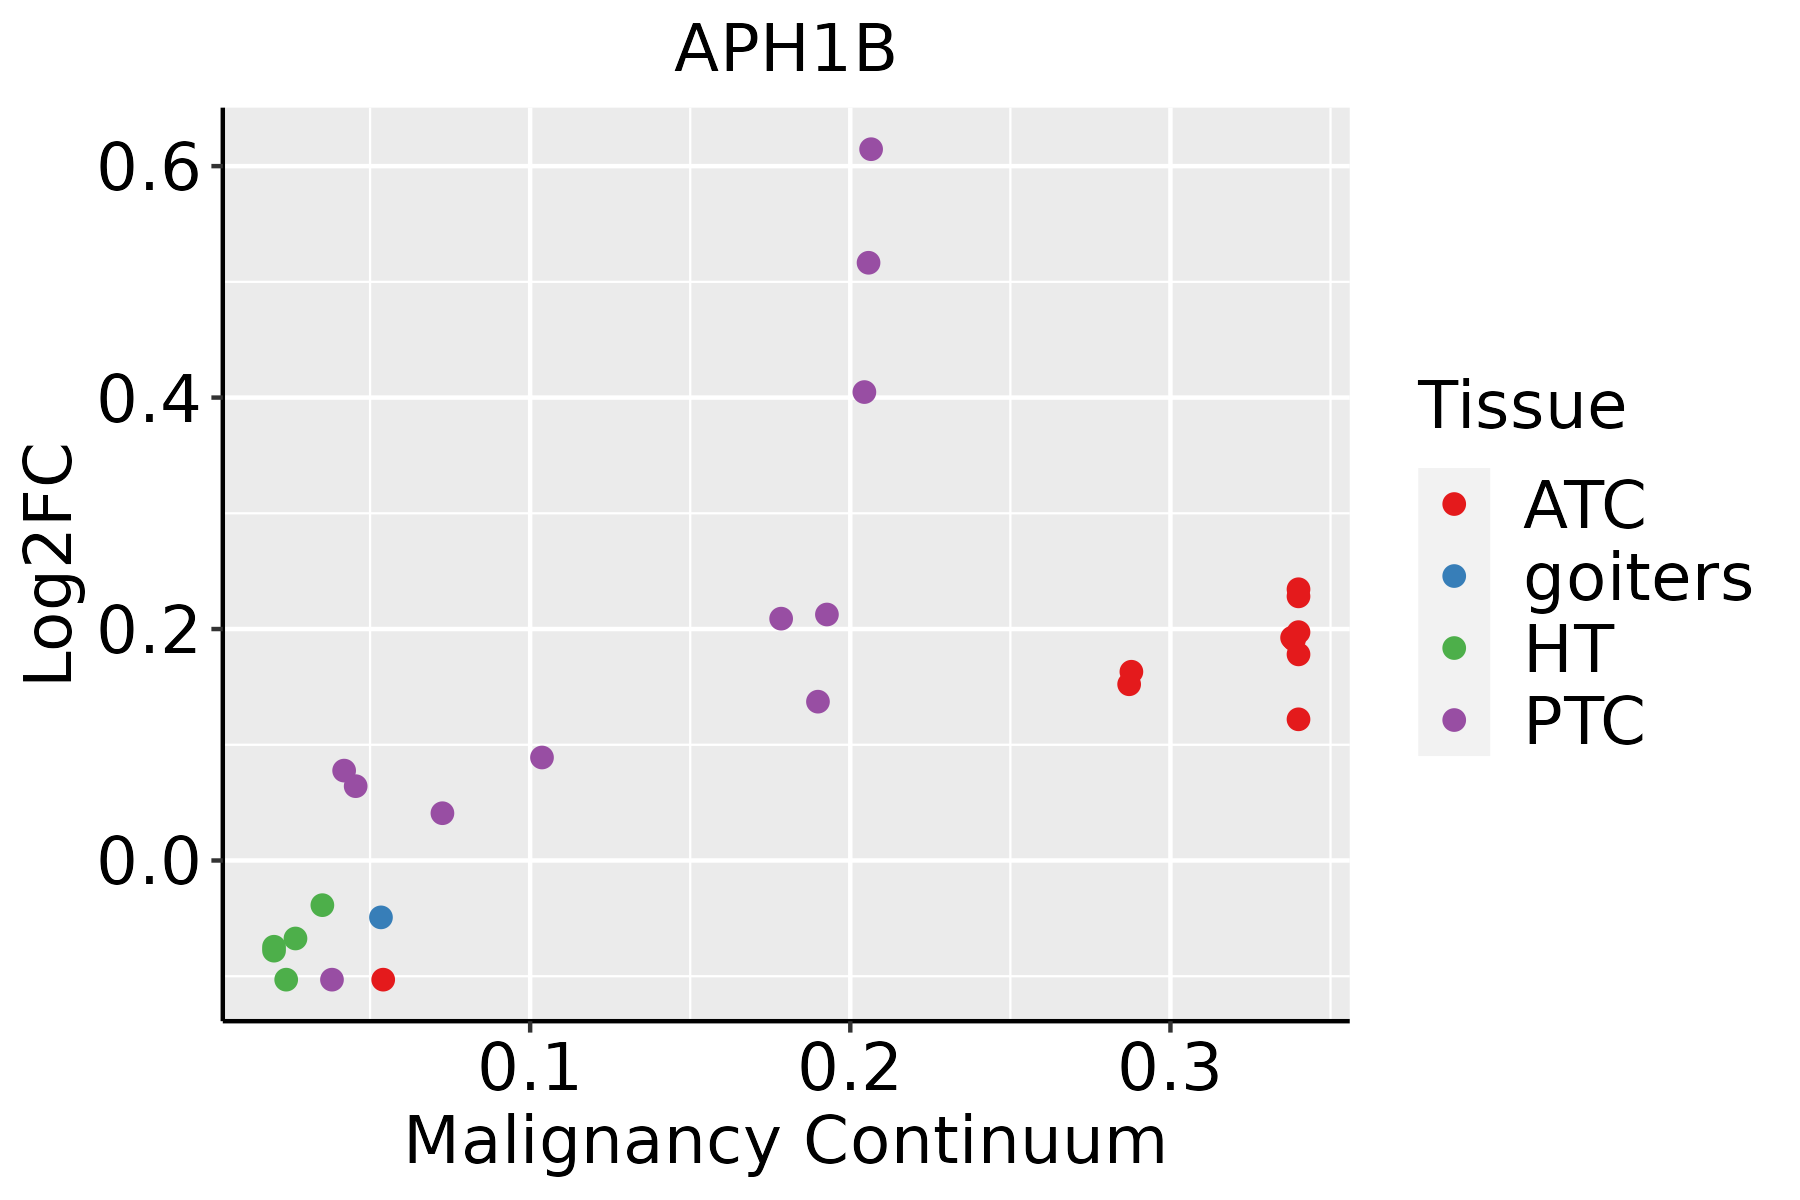 | ATC: Anaplastic thyroid cancer |
| HT: Hashimoto's thyroiditis | ||
| PTC: Papillary thyroid cancer |
| ∗log2FC in expression of this searched gene in stem-like cells from each diseased tissue sample relative to stem-like cells in normal samples in each tissue plotted against the malignancy continuum. Samples are colored based on if they are from different disease stage. |
Top |
Malignant transformation related pathway analysis |
| Find out the enriched GO biological processes and KEGG pathways involved in transition from healthy to precancer to cancer |
| Tissue | Disease Stage | Enriched GO biological Processes |
| Colorectum | AD |  |
| Colorectum | SER |  |
| Colorectum | MSS |  |
| Colorectum | MSI-H |  |
| Colorectum | FAP |  |
| ∗Top 15 enriched GO BP terms are showed in the bar plot of each disease state in each tissue. Each row represents a significant GO biological process which is colored according to the -log10(p.adjust). |
| Page: 1 2 3 4 5 6 7 8 9 |
| GO ID | Tissue | Disease Stage | Description | Gene Ratio | Bg Ratio | pvalue | p.adjust | Count |
| GO:0045862111 | Esophagus | ESCC | positive regulation of proteolysis | 256/8552 | 372/18723 | 7.88e-20 | 9.43e-18 | 256 |
| GO:005160418 | Esophagus | ESCC | protein maturation | 189/8552 | 294/18723 | 7.64e-11 | 2.39e-09 | 189 |
| GO:0010952111 | Esophagus | ESCC | positive regulation of peptidase activity | 133/8552 | 197/18723 | 4.31e-10 | 1.14e-08 | 133 |
| GO:0052547111 | Esophagus | ESCC | regulation of peptidase activity | 275/8552 | 461/18723 | 7.54e-10 | 1.88e-08 | 275 |
| GO:0052548111 | Esophagus | ESCC | regulation of endopeptidase activity | 253/8552 | 432/18723 | 3.68e-08 | 6.78e-07 | 253 |
| GO:0010950111 | Esophagus | ESCC | positive regulation of endopeptidase activity | 116/8552 | 179/18723 | 1.77e-07 | 2.79e-06 | 116 |
| GO:00072197 | Esophagus | ESCC | Notch signaling pathway | 106/8552 | 172/18723 | 1.74e-05 | 1.55e-04 | 106 |
| GO:001648514 | Esophagus | ESCC | protein processing | 134/8552 | 225/18723 | 1.81e-05 | 1.60e-04 | 134 |
| GO:004586212 | Liver | Cirrhotic | positive regulation of proteolysis | 163/4634 | 372/18723 | 4.18e-16 | 5.14e-14 | 163 |
| GO:005254712 | Liver | Cirrhotic | regulation of peptidase activity | 185/4634 | 461/18723 | 1.32e-13 | 1.09e-11 | 185 |
| GO:005254812 | Liver | Cirrhotic | regulation of endopeptidase activity | 172/4634 | 432/18723 | 2.12e-12 | 1.58e-10 | 172 |
| GO:00516046 | Liver | Cirrhotic | protein maturation | 121/4634 | 294/18723 | 3.54e-10 | 1.68e-08 | 121 |
| GO:00109527 | Liver | Cirrhotic | positive regulation of peptidase activity | 81/4634 | 197/18723 | 2.89e-07 | 7.03e-06 | 81 |
| GO:00164853 | Liver | Cirrhotic | protein processing | 85/4634 | 225/18723 | 9.01e-06 | 1.32e-04 | 85 |
| GO:00109507 | Liver | Cirrhotic | positive regulation of endopeptidase activity | 70/4634 | 179/18723 | 1.42e-05 | 1.97e-04 | 70 |
| GO:004586222 | Liver | HCC | positive regulation of proteolysis | 232/7958 | 372/18723 | 5.66e-15 | 3.98e-13 | 232 |
| GO:005160412 | Liver | HCC | protein maturation | 171/7958 | 294/18723 | 3.80e-08 | 8.30e-07 | 171 |
| GO:005254722 | Liver | HCC | regulation of peptidase activity | 247/7958 | 461/18723 | 8.28e-07 | 1.27e-05 | 247 |
| GO:005254822 | Liver | HCC | regulation of endopeptidase activity | 230/7958 | 432/18723 | 3.58e-06 | 4.68e-05 | 230 |
| GO:001095212 | Liver | HCC | positive regulation of peptidase activity | 110/7958 | 197/18723 | 1.04e-04 | 8.98e-04 | 110 |
| Page: 1 2 3 |
| Pathway ID | Tissue | Disease Stage | Description | Gene Ratio | Bg Ratio | pvalue | p.adjust | qvalue | Count |
| hsa05010210 | Esophagus | ESCC | Alzheimer disease | 263/4205 | 384/8465 | 1.80e-14 | 5.47e-13 | 2.80e-13 | 263 |
| hsa043306 | Esophagus | ESCC | Notch signaling pathway | 42/4205 | 62/8465 | 2.97e-03 | 7.97e-03 | 4.08e-03 | 42 |
| hsa0501038 | Esophagus | ESCC | Alzheimer disease | 263/4205 | 384/8465 | 1.80e-14 | 5.47e-13 | 2.80e-13 | 263 |
| hsa0433013 | Esophagus | ESCC | Notch signaling pathway | 42/4205 | 62/8465 | 2.97e-03 | 7.97e-03 | 4.08e-03 | 42 |
| hsa0501014 | Liver | Cirrhotic | Alzheimer disease | 180/2530 | 384/8465 | 5.52e-13 | 1.36e-11 | 8.36e-12 | 180 |
| hsa0501015 | Liver | Cirrhotic | Alzheimer disease | 180/2530 | 384/8465 | 5.52e-13 | 1.36e-11 | 8.36e-12 | 180 |
| hsa0501022 | Liver | HCC | Alzheimer disease | 254/4020 | 384/8465 | 3.75e-14 | 8.97e-13 | 4.99e-13 | 254 |
| hsa0501032 | Liver | HCC | Alzheimer disease | 254/4020 | 384/8465 | 3.75e-14 | 8.97e-13 | 4.99e-13 | 254 |
| hsa0501028 | Oral cavity | OSCC | Alzheimer disease | 244/3704 | 384/8465 | 1.18e-15 | 3.60e-14 | 1.83e-14 | 244 |
| hsa043305 | Oral cavity | OSCC | Notch signaling pathway | 44/3704 | 62/8465 | 1.26e-05 | 5.55e-05 | 2.83e-05 | 44 |
| hsa05010112 | Oral cavity | OSCC | Alzheimer disease | 244/3704 | 384/8465 | 1.18e-15 | 3.60e-14 | 1.83e-14 | 244 |
| hsa0433012 | Oral cavity | OSCC | Notch signaling pathway | 44/3704 | 62/8465 | 1.26e-05 | 5.55e-05 | 2.83e-05 | 44 |
| Page: 1 |
Top |
Cell-cell communication analysis |
| Identification of potential cell-cell interactions between two cell types and their ligand-receptor pairs for different disease states |
| Ligand | Receptor | LRpair | Pathway | Tissue | Disease Stage |
| Page: 1 |
Top |
Single-cell gene regulatory network inference analysis |
| Find out the significant the regulons (TFs) and the target genes of each regulon across cell types for different disease states |
| TF | Cell Type | Tissue | Disease Stage | Target Gene | RSS | Regulon Activity |
| ∗The dot plots of a searched regulon are shown for all cell subpopulations in each disease state of each tissue based on the regulon specific score inferred using pySCENIC and by calculating the average expression. |
| Page: 1 |
Top |
Somatic mutation of malignant transformation related genes |
| Annotation of somatic variants for genes involved in malignant transformation |
| Hugo Symbol | Variant Class | Variant Classification | dbSNP RS | HGVSc | HGVSp | HGVSp Short | SWISSPROT | BIOTYPE | SIFT | PolyPhen | Tumor Sample Barcode | Tissue | Histology | Sex | Age | Stage | Therapy Types | Drugs | Outcome |
| APH1B | SNV | Missense_Mutation | rs748307338 | c.488N>T | p.Thr163Met | p.T163M | Q8WW43 | protein_coding | deleterious(0) | probably_damaging(0.927) | TCGA-A8-A079-01 | Breast | breast invasive carcinoma | Female | >=65 | III/IV | Chemotherapy | 5-fluorouracil | SD |
| APH1B | deletion | Frame_Shift_Del | c.62_63delAT | p.Tyr21CysfsTer40 | p.Y21Cfs*40 | Q8WW43 | protein_coding | TCGA-D8-A1J9-01 | Breast | breast invasive carcinoma | Female | <65 | I/II | Unknown | Unknown | SD | |||
| APH1B | SNV | Missense_Mutation | novel | c.194N>A | p.Gly65Glu | p.G65E | Q8WW43 | protein_coding | tolerated(1) | benign(0.026) | TCGA-EA-A3HU-01 | Cervix | cervical & endocervical cancer | Female | <65 | I/II | Unknown | Unknown | SD |
| APH1B | SNV | Missense_Mutation | c.620N>A | p.Ser207Tyr | p.S207Y | Q8WW43 | protein_coding | deleterious(0) | benign(0.382) | TCGA-FU-A3HZ-01 | Cervix | cervical & endocervical cancer | Female | <65 | I/II | Chemotherapy | cisplatin | CR | |
| APH1B | SNV | Missense_Mutation | rs748873773 | c.741G>T | p.Lys247Asn | p.K247N | Q8WW43 | protein_coding | tolerated(0.05) | possibly_damaging(0.738) | TCGA-AA-3977-01 | Colorectum | colon adenocarcinoma | Male | >=65 | I/II | Unknown | Unknown | SD |
| APH1B | SNV | Missense_Mutation | novel | c.145N>C | p.Ser49Pro | p.S49P | Q8WW43 | protein_coding | deleterious(0) | benign(0.077) | TCGA-AZ-4315-01 | Colorectum | colon adenocarcinoma | Male | <65 | I/II | Unknown | Unknown | SD |
| APH1B | SNV | Missense_Mutation | novel | c.275N>C | p.Lys92Thr | p.K92T | Q8WW43 | protein_coding | deleterious(0.04) | possibly_damaging(0.66) | TCGA-CA-6717-01 | Colorectum | colon adenocarcinoma | Male | <65 | I/II | Chemotherapy | oxaliplatin | CR |
| APH1B | SNV | Missense_Mutation | rs754872268 | c.227N>T | p.Ala76Val | p.A76V | Q8WW43 | protein_coding | tolerated(1) | benign(0.005) | TCGA-CM-4747-01 | Colorectum | colon adenocarcinoma | Male | <65 | I/II | Chemotherapy | fluorouracil | SD |
| APH1B | SNV | Missense_Mutation | novel | c.120N>A | p.Phe40Leu | p.F40L | Q8WW43 | protein_coding | deleterious(0) | probably_damaging(0.992) | TCGA-AG-A002-01 | Colorectum | rectum adenocarcinoma | Male | <65 | I/II | Unknown | Unknown | SD |
| APH1B | SNV | Missense_Mutation | novel | c.194N>A | p.Gly65Glu | p.G65E | Q8WW43 | protein_coding | tolerated(1) | benign(0.026) | TCGA-A5-A0G2-01 | Endometrium | uterine corpus endometrioid carcinoma | Female | <65 | III/IV | Unknown | Unknown | SD |
| Page: 1 2 3 |
Top |
Related drugs of malignant transformation related genes |
| Identification of chemicals and drugs interact with genes involved in malignant transfromation |
| (DGIdb 4.0) |
| Entrez ID | Symbol | Category | Interaction Types | Drug Claim Name | Drug Name | PMIDs |
| 83464 | APH1B | PROTEASE, DRUGGABLE GENOME | LY-411575 | CHEMBL392068 | 23181502,19443228 | |
| 83464 | APH1B | PROTEASE, DRUGGABLE GENOME | GSI-136 | GSI-136 | ||
| 83464 | APH1B | PROTEASE, DRUGGABLE GENOME | inhibitor | CHEMBL463981 | BEGACESTAT | |
| 83464 | APH1B | PROTEASE, DRUGGABLE GENOME | inhibitor | CHEMBL1090771 | AVAGACESTAT | |
| 83464 | APH1B | PROTEASE, DRUGGABLE GENOME | BMS-299897 | CHEMBL247471 | ||
| 83464 | APH1B | PROTEASE, DRUGGABLE GENOME | IC261 | IC261 | 20350806 | |
| 83464 | APH1B | PROTEASE, DRUGGABLE GENOME | UNII-DRL23N424R | |||
| 83464 | APH1B | PROTEASE, DRUGGABLE GENOME | BMS-708163 | AVAGACESTAT | ||
| 83464 | APH1B | PROTEASE, DRUGGABLE GENOME | MK-0752 | MK-0752 | ||
| 83464 | APH1B | PROTEASE, DRUGGABLE GENOME | modulator | CHEMBL190083 | TARENFLURBIL |
| Page: 1 2 |

Copyright 2023-Present -The University of Texas Health Science Center at Houston |