
|
|||||
|
 | |
| |
| |
| |
| |
| |
|
Gene: APEX2 |
Gene summary for APEX2 |
| Gene information | Species | Human | Gene symbol | APEX2 | Gene ID | 27301 |
| Gene name | apurinic/apyrimidinic endodeoxyribonuclease 2 | |
| Gene Alias | APE2 | |
| Cytomap | Xp11.21 | |
| Gene Type | protein-coding | GO ID | GO:0006139 | UniProtAcc | B4DWI9 |
Top |
Malignant transformation analysis |
| Identification of the aberrant gene expression in precancerous and cancerous lesions by comparing the gene expression of stem-like cells in diseased tissues with normal stem cells |
| Entrez ID | Symbol | Replicates | Species | Organ | Tissue | Adj P-value | Log2FC | Malignancy |
| 27301 | APEX2 | LZE2T | Human | Esophagus | ESCC | 2.93e-02 | 3.37e-01 | 0.082 |
| 27301 | APEX2 | LZE4T | Human | Esophagus | ESCC | 1.36e-02 | 9.49e-02 | 0.0811 |
| 27301 | APEX2 | LZE7T | Human | Esophagus | ESCC | 5.86e-04 | 2.41e-01 | 0.0667 |
| 27301 | APEX2 | LZE8T | Human | Esophagus | ESCC | 2.06e-07 | 3.51e-01 | 0.067 |
| 27301 | APEX2 | LZE20T | Human | Esophagus | ESCC | 4.10e-12 | 2.35e-01 | 0.0662 |
| 27301 | APEX2 | LZE24T | Human | Esophagus | ESCC | 2.45e-19 | 5.62e-01 | 0.0596 |
| 27301 | APEX2 | LZE6T | Human | Esophagus | ESCC | 5.70e-04 | 1.62e-01 | 0.0845 |
| 27301 | APEX2 | P1T-E | Human | Esophagus | ESCC | 1.54e-02 | 1.78e-01 | 0.0875 |
| 27301 | APEX2 | P2T-E | Human | Esophagus | ESCC | 7.60e-25 | 4.29e-01 | 0.1177 |
| 27301 | APEX2 | P4T-E | Human | Esophagus | ESCC | 4.35e-22 | 4.82e-01 | 0.1323 |
| 27301 | APEX2 | P5T-E | Human | Esophagus | ESCC | 1.28e-19 | 4.02e-01 | 0.1327 |
| 27301 | APEX2 | P8T-E | Human | Esophagus | ESCC | 8.49e-13 | 2.75e-01 | 0.0889 |
| 27301 | APEX2 | P9T-E | Human | Esophagus | ESCC | 4.10e-13 | 3.01e-01 | 0.1131 |
| 27301 | APEX2 | P10T-E | Human | Esophagus | ESCC | 3.08e-12 | 2.21e-01 | 0.116 |
| 27301 | APEX2 | P11T-E | Human | Esophagus | ESCC | 6.21e-11 | 3.23e-01 | 0.1426 |
| 27301 | APEX2 | P12T-E | Human | Esophagus | ESCC | 8.42e-15 | 3.41e-01 | 0.1122 |
| 27301 | APEX2 | P15T-E | Human | Esophagus | ESCC | 5.38e-18 | 2.53e-01 | 0.1149 |
| 27301 | APEX2 | P16T-E | Human | Esophagus | ESCC | 5.79e-15 | 2.62e-01 | 0.1153 |
| 27301 | APEX2 | P17T-E | Human | Esophagus | ESCC | 6.42e-06 | 3.03e-01 | 0.1278 |
| 27301 | APEX2 | P19T-E | Human | Esophagus | ESCC | 1.73e-06 | 4.09e-01 | 0.1662 |
| Page: 1 2 3 4 5 |
| Tissue | Expression Dynamics | Abbreviation |
| Esophagus | 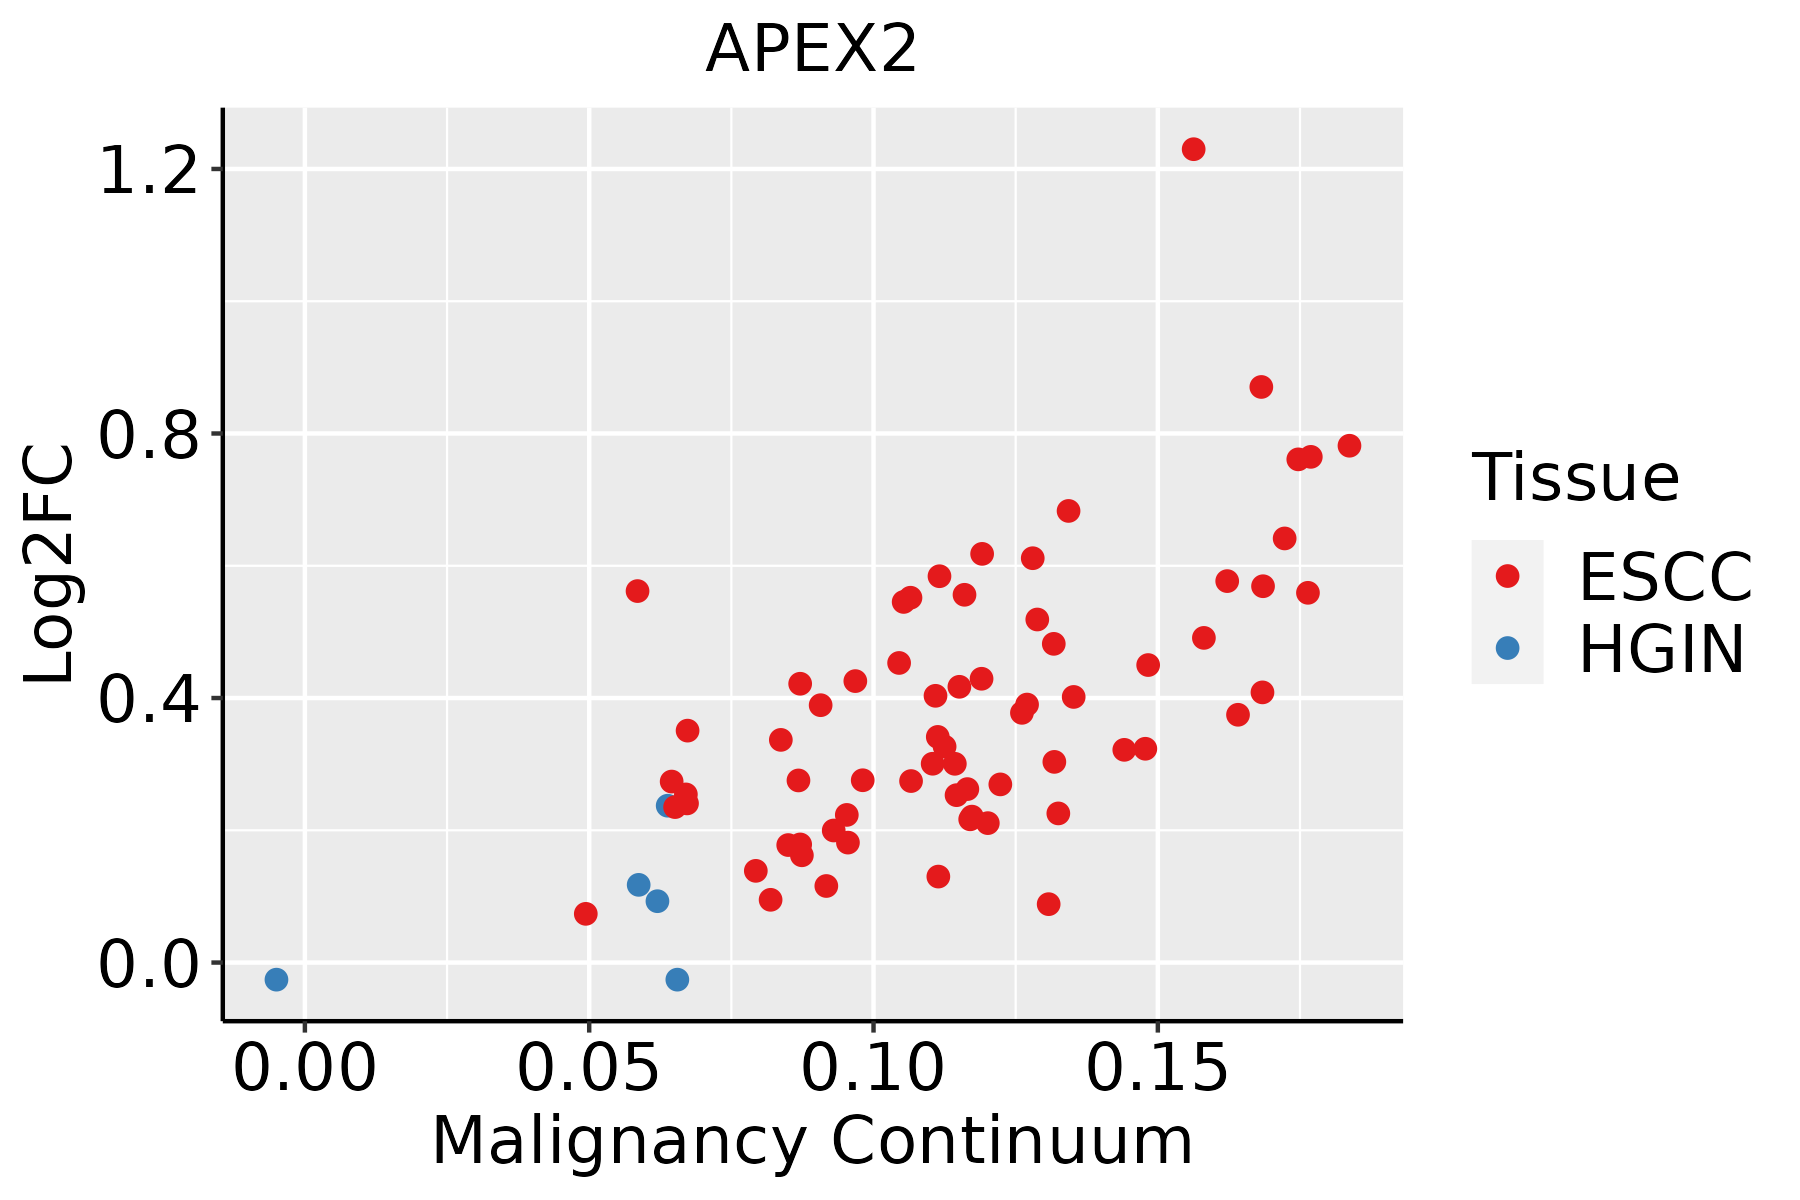 | ESCC: Esophageal squamous cell carcinoma |
| HGIN: High-grade intraepithelial neoplasias | ||
| LGIN: Low-grade intraepithelial neoplasias | ||
| Liver | 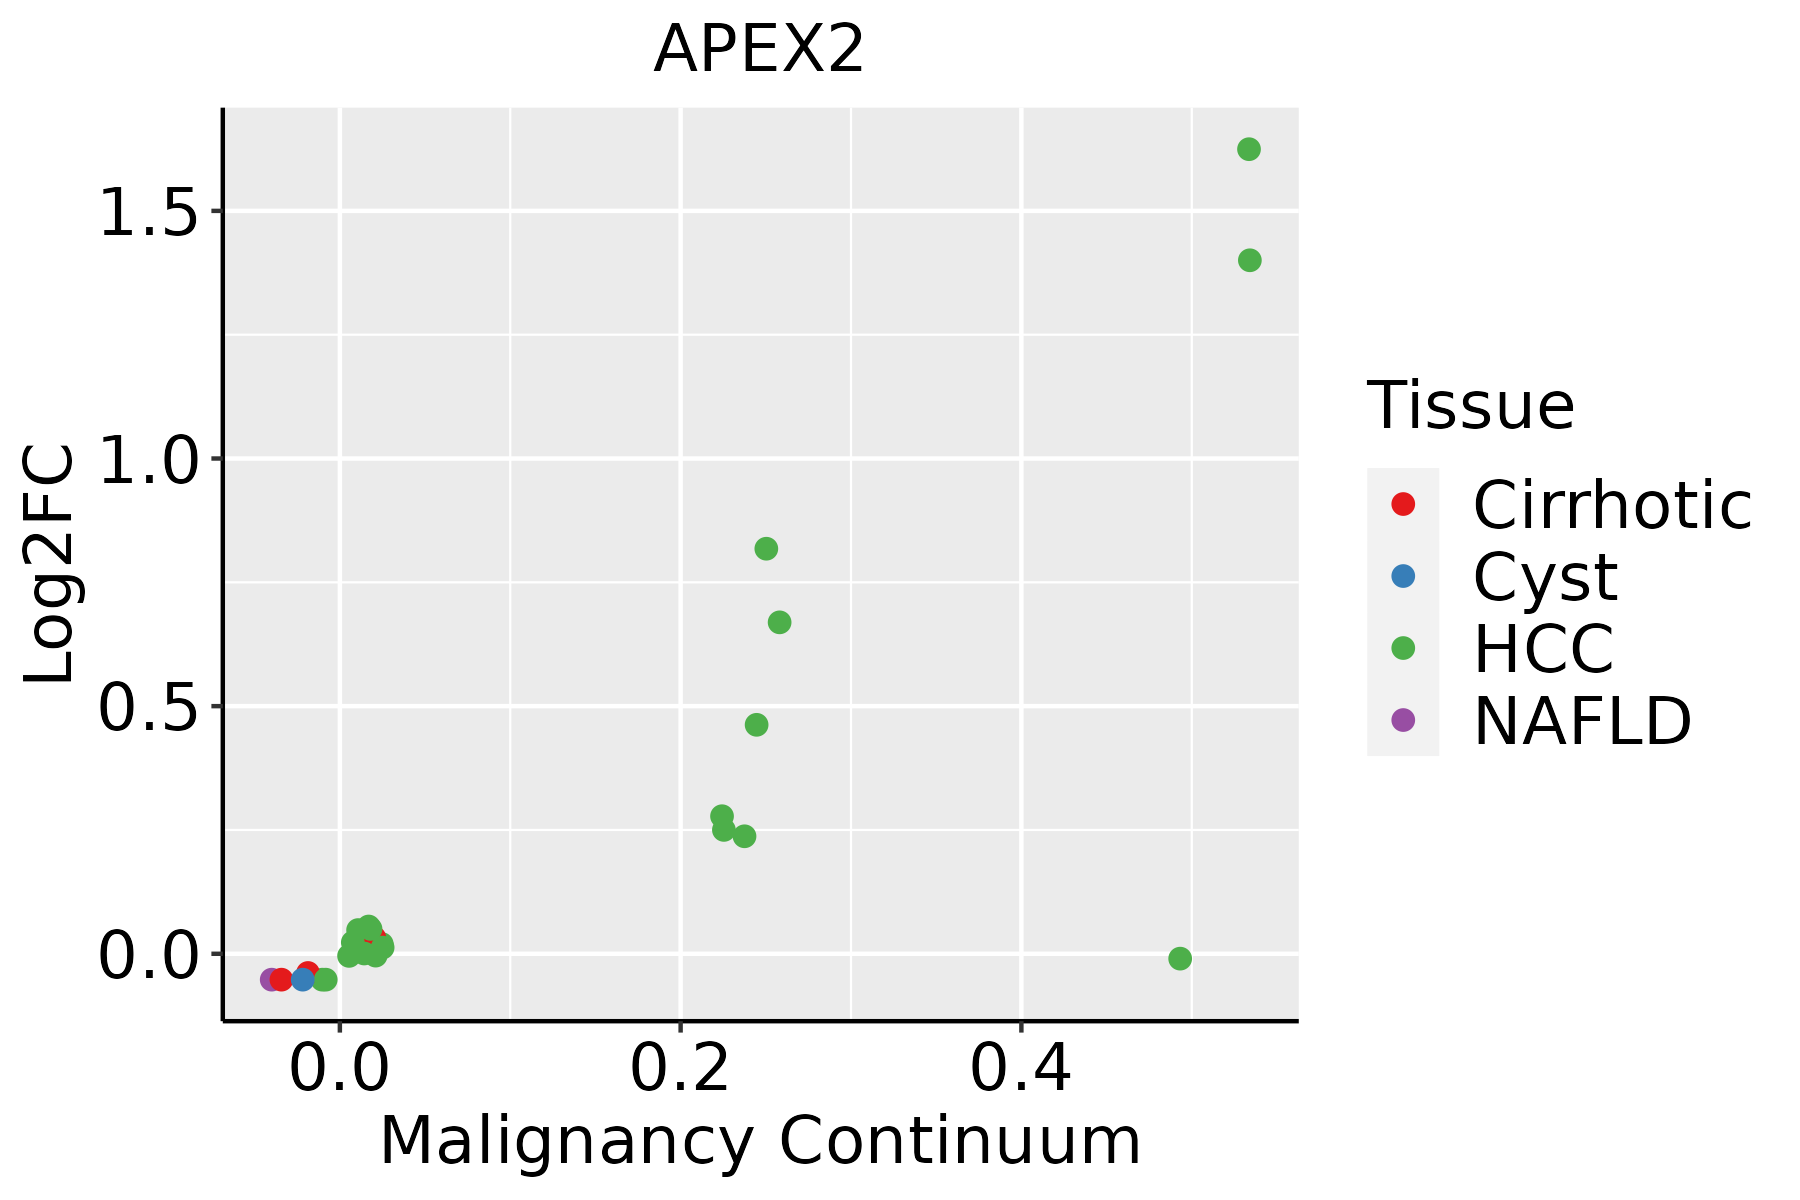 | HCC: Hepatocellular carcinoma |
| NAFLD: Non-alcoholic fatty liver disease | ||
| Oral Cavity |  | EOLP: Erosive Oral lichen planus |
| LP: leukoplakia | ||
| NEOLP: Non-erosive oral lichen planus | ||
| OSCC: Oral squamous cell carcinoma |
| ∗log2FC in expression of this searched gene in stem-like cells from each diseased tissue sample relative to stem-like cells in normal samples in each tissue plotted against the malignancy continuum. Samples are colored based on if they are from different disease stage. |
Top |
Malignant transformation related pathway analysis |
| Find out the enriched GO biological processes and KEGG pathways involved in transition from healthy to precancer to cancer |
| Tissue | Disease Stage | Enriched GO biological Processes |
| Colorectum | AD |  |
| Colorectum | SER |  |
| Colorectum | MSS |  |
| Colorectum | MSI-H |  |
| Colorectum | FAP |  |
| ∗Top 15 enriched GO BP terms are showed in the bar plot of each disease state in each tissue. Each row represents a significant GO biological process which is colored according to the -log10(p.adjust). |
| Page: 1 2 3 4 5 6 7 8 9 |
| GO ID | Tissue | Disease Stage | Description | Gene Ratio | Bg Ratio | pvalue | p.adjust | Count |
| GO:00903053 | Esophagus | ESCC | nucleic acid phosphodiester bond hydrolysis | 163/8552 | 261/18723 | 3.07e-08 | 5.73e-07 | 163 |
| GO:00062843 | Esophagus | ESCC | base-excision repair | 33/8552 | 43/18723 | 3.25e-05 | 2.69e-04 | 33 |
| GO:00063101 | Esophagus | ESCC | DNA recombination | 168/8552 | 305/18723 | 5.58e-04 | 3.05e-03 | 168 |
| GO:0090305 | Liver | HCC | nucleic acid phosphodiester bond hydrolysis | 152/7958 | 261/18723 | 1.90e-07 | 3.46e-06 | 152 |
| GO:0006284 | Liver | HCC | base-excision repair | 27/7958 | 43/18723 | 5.79e-03 | 2.40e-02 | 27 |
| GO:00903052 | Oral cavity | OSCC | nucleic acid phosphodiester bond hydrolysis | 142/7305 | 261/18723 | 2.90e-07 | 4.43e-06 | 142 |
| GO:00062842 | Oral cavity | OSCC | base-excision repair | 28/7305 | 43/18723 | 4.71e-04 | 2.79e-03 | 28 |
| GO:0006310 | Oral cavity | OSCC | DNA recombination | 147/7305 | 305/18723 | 6.33e-04 | 3.56e-03 | 147 |
| Page: 1 |
| Pathway ID | Tissue | Disease Stage | Description | Gene Ratio | Bg Ratio | pvalue | p.adjust | qvalue | Count |
| Page: 1 |
Top |
Cell-cell communication analysis |
| Identification of potential cell-cell interactions between two cell types and their ligand-receptor pairs for different disease states |
| Ligand | Receptor | LRpair | Pathway | Tissue | Disease Stage |
| Page: 1 |
Top |
Single-cell gene regulatory network inference analysis |
| Find out the significant the regulons (TFs) and the target genes of each regulon across cell types for different disease states |
| TF | Cell Type | Tissue | Disease Stage | Target Gene | RSS | Regulon Activity |
| APEX2 | MEN | Skin | Healthy | HOOK3,PRKCI,SEC24B, etc. | 1.30e-02 |  |
| APEX2 | M1MAC | Skin | ADJ | EMP1,TREM1,PLTP, etc. | 1.51e-02 |  |
| APEX2 | CD8TRM | Skin | ADJ | EMP1,TREM1,PLTP, etc. | 5.22e-03 | |
| APEX2 | TH17 | Skin | ADJ | EMP1,TREM1,PLTP, etc. | -4.44e-16 | |
| APEX2 | INMON | Skin | AK | EMP1,TREM1,PLTP, etc. | 0.00e+00 |  |
| APEX2 | CD8TCM | Skin | AK | EMP1,TREM1,PLTP, etc. | 4.35e-03 | |
| ∗The dot plots of a searched regulon are shown for all cell subpopulations in each disease state of each tissue based on the regulon specific score inferred using pySCENIC and by calculating the average expression. |
| Page: 1 |
Top |
Somatic mutation of malignant transformation related genes |
| Annotation of somatic variants for genes involved in malignant transformation |
| Hugo Symbol | Variant Class | Variant Classification | dbSNP RS | HGVSc | HGVSp | HGVSp Short | SWISSPROT | BIOTYPE | SIFT | PolyPhen | Tumor Sample Barcode | Tissue | Histology | Sex | Age | Stage | Therapy Types | Drugs | Outcome |
| APEX2 | SNV | Missense_Mutation | c.878N>G | p.Ser293Cys | p.S293C | Q9UBZ4 | protein_coding | tolerated(0.31) | benign(0.022) | TCGA-AC-A23H-01 | Breast | breast invasive carcinoma | Female | >=65 | I/II | Unknown | Unknown | PD | |
| APEX2 | SNV | Missense_Mutation | c.450N>C | p.Leu150Phe | p.L150F | Q9UBZ4 | protein_coding | deleterious(0.01) | possibly_damaging(0.645) | TCGA-B6-A0IJ-01 | Breast | breast invasive carcinoma | Female | <65 | I/II | Unknown | Unknown | SD | |
| APEX2 | SNV | Missense_Mutation | c.862N>A | p.Asp288Asn | p.D288N | Q9UBZ4 | protein_coding | tolerated(0.12) | benign(0.048) | TCGA-BH-A0B5-01 | Breast | breast invasive carcinoma | Female | <65 | III/IV | Chemotherapy | adriamycin | CR | |
| APEX2 | SNV | Missense_Mutation | c.193N>A | p.Gly65Ser | p.G65S | Q9UBZ4 | protein_coding | deleterious(0) | probably_damaging(0.998) | TCGA-E2-A15D-01 | Breast | breast invasive carcinoma | Female | <65 | I/II | Hormone Therapy | tamoxiphen | SD | |
| APEX2 | SNV | Missense_Mutation | rs749036434 | c.517N>T | p.Arg173Cys | p.R173C | Q9UBZ4 | protein_coding | deleterious(0) | benign(0.106) | TCGA-EW-A1IZ-01 | Breast | breast invasive carcinoma | Female | <65 | III/IV | Chemotherapy | taxotere | SD |
| APEX2 | SNV | Missense_Mutation | novel | c.702N>G | p.Cys234Trp | p.C234W | Q9UBZ4 | protein_coding | tolerated(0.19) | possibly_damaging(0.729) | TCGA-C5-A1BJ-01 | Cervix | cervical & endocervical cancer | Female | <65 | I/II | Unknown | Unknown | SD |
| APEX2 | SNV | Missense_Mutation | rs374342631 | c.1394G>A | p.Arg465His | p.R465H | Q9UBZ4 | protein_coding | deleterious(0.03) | benign(0.39) | TCGA-IR-A3LC-01 | Cervix | cervical & endocervical cancer | Female | <65 | I/II | Unspecific | Cisplatin | Complete Response |
| APEX2 | SNV | Missense_Mutation | c.390N>T | p.Glu130Asp | p.E130D | Q9UBZ4 | protein_coding | deleterious(0.01) | probably_damaging(0.978) | TCGA-Q1-A73Q-01 | Cervix | cervical & endocervical cancer | Female | <65 | I/II | Chemotherapy | cisplatin | SD | |
| APEX2 | SNV | Missense_Mutation | novel | c.1382N>T | p.Ala461Val | p.A461V | Q9UBZ4 | protein_coding | tolerated(0.22) | benign(0.042) | TCGA-5M-AAT6-01 | Colorectum | colon adenocarcinoma | Female | <65 | III/IV | Unknown | Unknown | PD |
| APEX2 | SNV | Missense_Mutation | novel | c.1421N>G | p.Glu474Gly | p.E474G | Q9UBZ4 | protein_coding | deleterious(0) | probably_damaging(0.999) | TCGA-A6-2672-01 | Colorectum | colon adenocarcinoma | Female | >=65 | III/IV | Unknown | Unknown | SD |
| Page: 1 2 3 4 5 6 |
Top |
Related drugs of malignant transformation related genes |
| Identification of chemicals and drugs interact with genes involved in malignant transfromation |
| (DGIdb 4.0) |
| Entrez ID | Symbol | Category | Interaction Types | Drug Claim Name | Drug Name | PMIDs |
| Page: 1 |

Copyright 2023-Present -The University of Texas Health Science Center at Houston |