
|
|||||
|
 | |
| |
| |
| |
| |
| |
|
Gene: APEH |
Gene summary for APEH |
| Gene information | Species | Human | Gene symbol | APEH | Gene ID | 327 |
| Gene name | acylaminoacyl-peptide hydrolase | |
| Gene Alias | AARE | |
| Cytomap | 3p21.31 | |
| Gene Type | protein-coding | GO ID | GO:0006412 | UniProtAcc | A0A024R2U9 |
Top |
Malignant transformation analysis |
| Identification of the aberrant gene expression in precancerous and cancerous lesions by comparing the gene expression of stem-like cells in diseased tissues with normal stem cells |
| Entrez ID | Symbol | Replicates | Species | Organ | Tissue | Adj P-value | Log2FC | Malignancy |
| 327 | APEH | HTA11_3410_2000001011 | Human | Colorectum | AD | 2.54e-04 | 1.14e-01 | 0.0155 |
| 327 | APEH | HTA11_2487_2000001011 | Human | Colorectum | SER | 1.88e-21 | 6.12e-01 | -0.1808 |
| 327 | APEH | HTA11_1938_2000001011 | Human | Colorectum | AD | 6.23e-14 | 6.04e-01 | -0.0811 |
| 327 | APEH | HTA11_78_2000001011 | Human | Colorectum | AD | 1.67e-10 | 4.49e-01 | -0.1088 |
| 327 | APEH | HTA11_347_2000001011 | Human | Colorectum | AD | 2.69e-18 | 4.24e-01 | -0.1954 |
| 327 | APEH | HTA11_411_2000001011 | Human | Colorectum | SER | 1.23e-08 | 1.01e+00 | -0.2602 |
| 327 | APEH | HTA11_2112_2000001011 | Human | Colorectum | SER | 2.96e-08 | 6.28e-01 | -0.2196 |
| 327 | APEH | HTA11_3361_2000001011 | Human | Colorectum | AD | 8.15e-19 | 5.68e-01 | -0.1207 |
| 327 | APEH | HTA11_83_2000001011 | Human | Colorectum | SER | 3.30e-13 | 5.92e-01 | -0.1526 |
| 327 | APEH | HTA11_696_2000001011 | Human | Colorectum | AD | 8.02e-28 | 6.15e-01 | -0.1464 |
| 327 | APEH | HTA11_866_2000001011 | Human | Colorectum | AD | 1.91e-10 | 3.88e-01 | -0.1001 |
| 327 | APEH | HTA11_1391_2000001011 | Human | Colorectum | AD | 6.04e-22 | 7.50e-01 | -0.059 |
| 327 | APEH | HTA11_2992_2000001011 | Human | Colorectum | SER | 4.06e-07 | 4.31e-01 | -0.1706 |
| 327 | APEH | HTA11_5212_2000001011 | Human | Colorectum | AD | 1.66e-06 | 4.42e-01 | -0.2061 |
| 327 | APEH | HTA11_5216_2000001011 | Human | Colorectum | SER | 6.86e-04 | 4.36e-01 | -0.1462 |
| 327 | APEH | HTA11_546_2000001011 | Human | Colorectum | AD | 4.69e-02 | 3.06e-01 | -0.0842 |
| 327 | APEH | HTA11_7862_2000001011 | Human | Colorectum | AD | 1.43e-05 | 3.34e-01 | -0.0179 |
| 327 | APEH | HTA11_866_3004761011 | Human | Colorectum | AD | 4.49e-14 | 4.04e-01 | 0.096 |
| 327 | APEH | HTA11_4255_2000001011 | Human | Colorectum | SER | 1.33e-02 | 5.07e-01 | 0.0446 |
| 327 | APEH | HTA11_8622_2000001021 | Human | Colorectum | SER | 2.42e-05 | 3.30e-01 | 0.0528 |
| Page: 1 2 3 4 5 6 7 8 |
| Tissue | Expression Dynamics | Abbreviation |
| Colorectum (GSE201348) |  | FAP: Familial adenomatous polyposis |
| CRC: Colorectal cancer | ||
| Colorectum (HTA11) |  | AD: Adenomas |
| SER: Sessile serrated lesions | ||
| MSI-H: Microsatellite-high colorectal cancer | ||
| MSS: Microsatellite stable colorectal cancer | ||
| Esophagus | 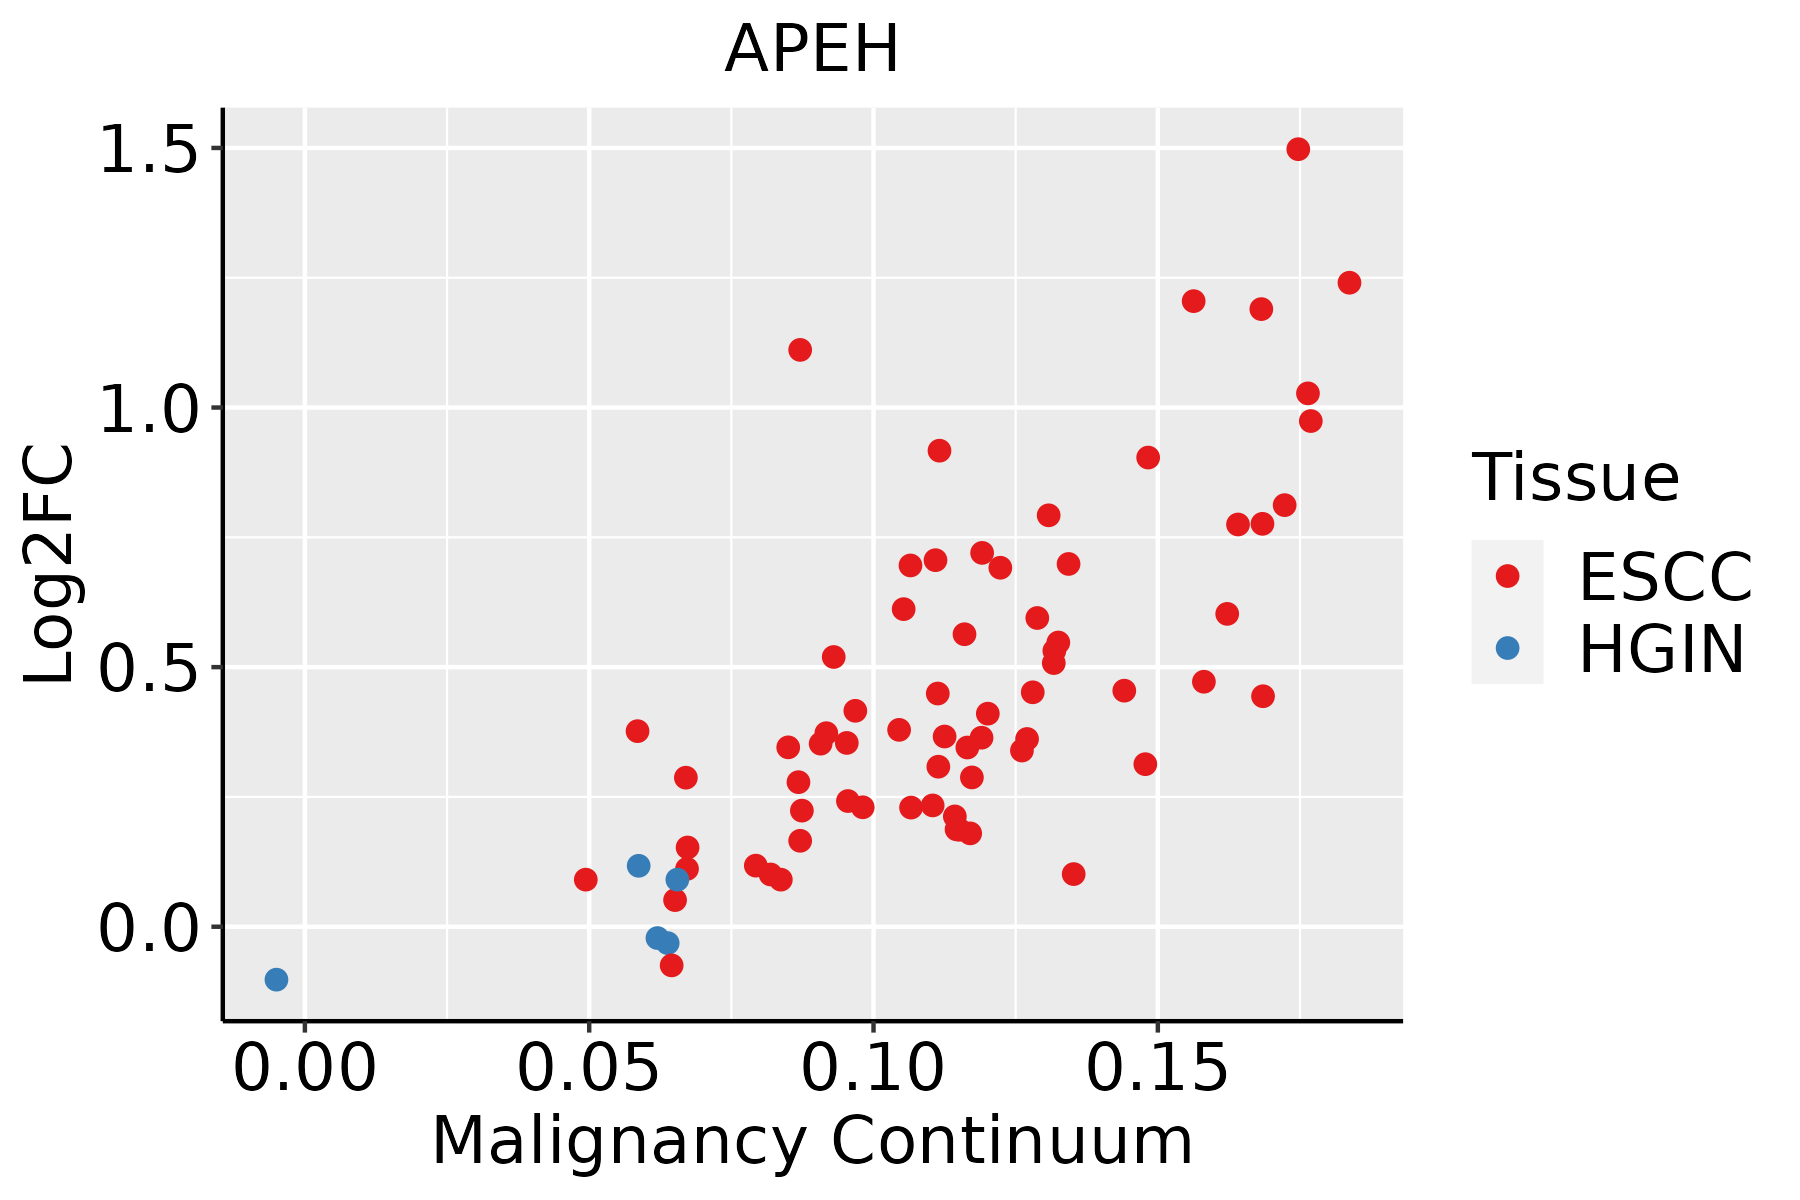 | ESCC: Esophageal squamous cell carcinoma |
| HGIN: High-grade intraepithelial neoplasias | ||
| LGIN: Low-grade intraepithelial neoplasias | ||
| Liver | 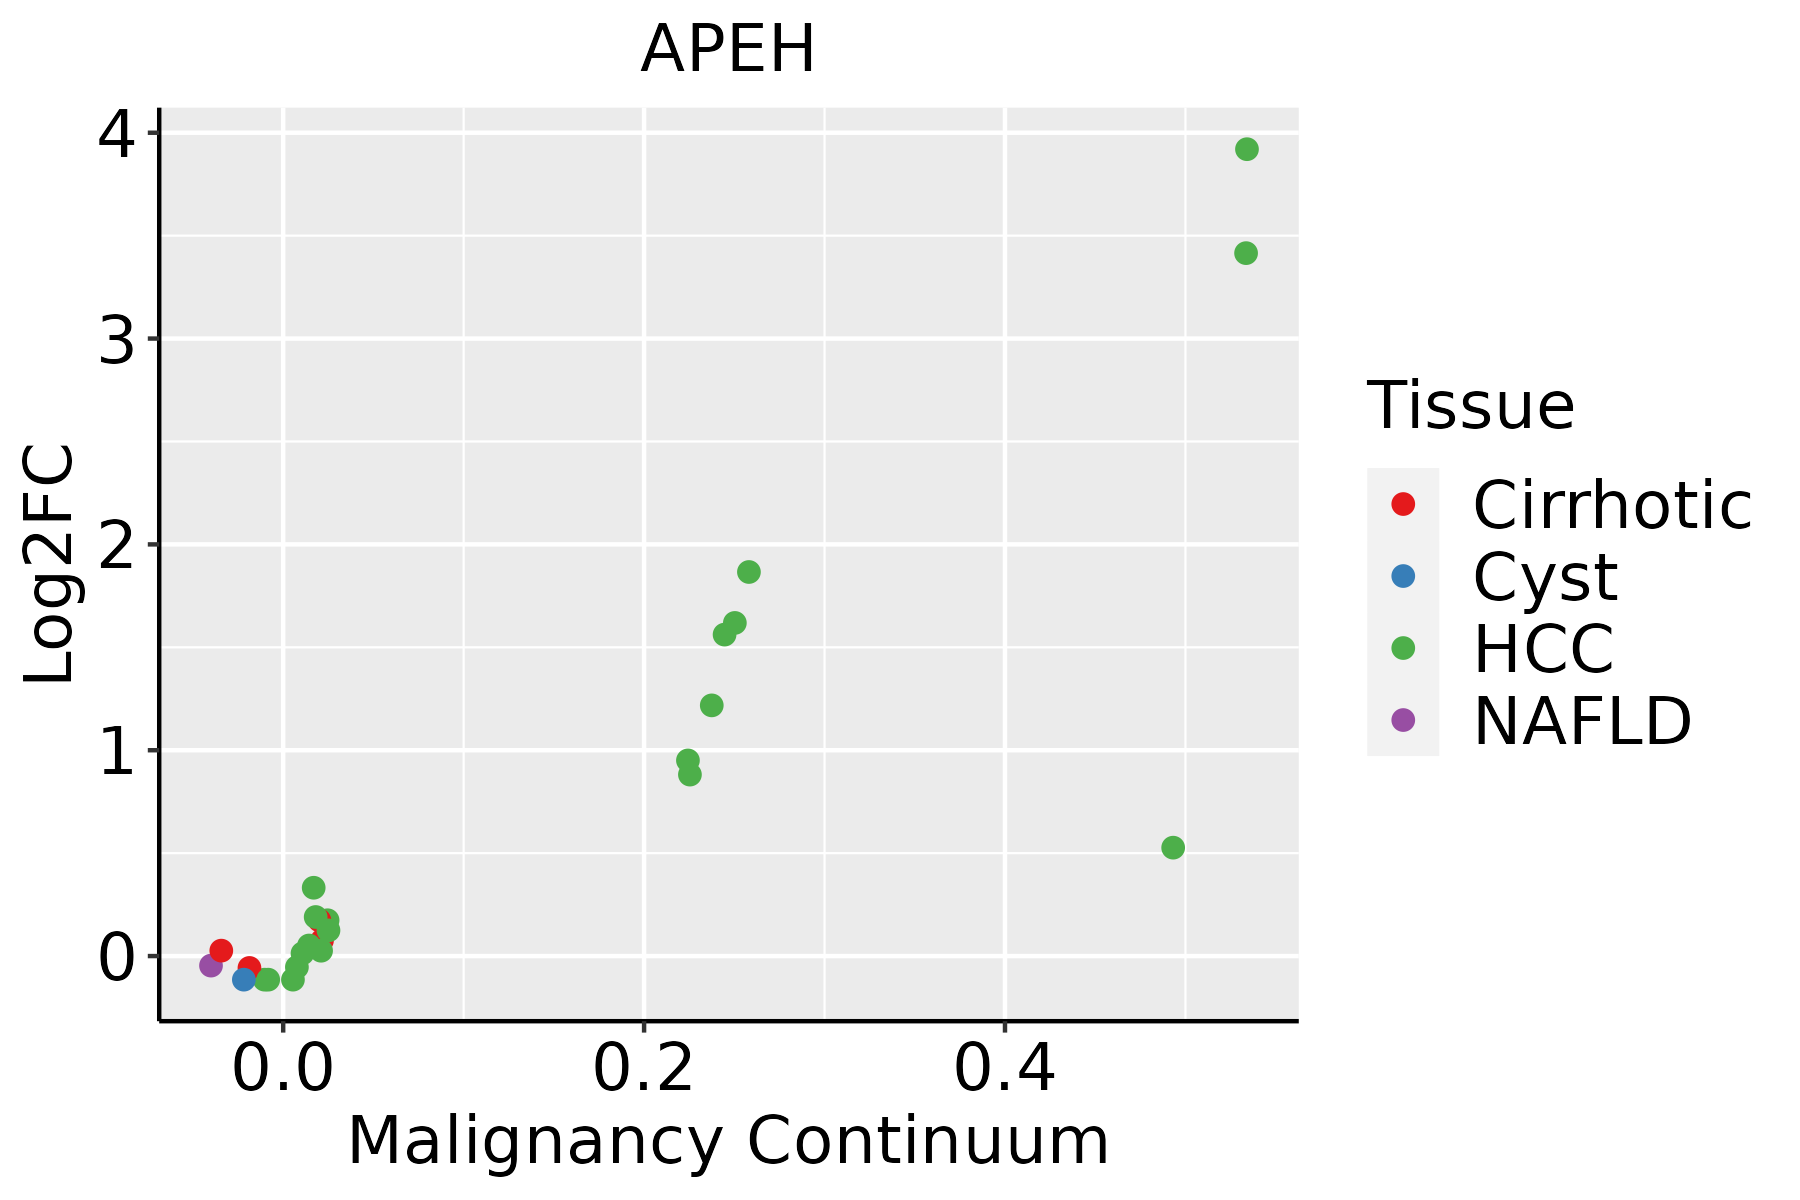 | HCC: Hepatocellular carcinoma |
| NAFLD: Non-alcoholic fatty liver disease | ||
| Oral Cavity | 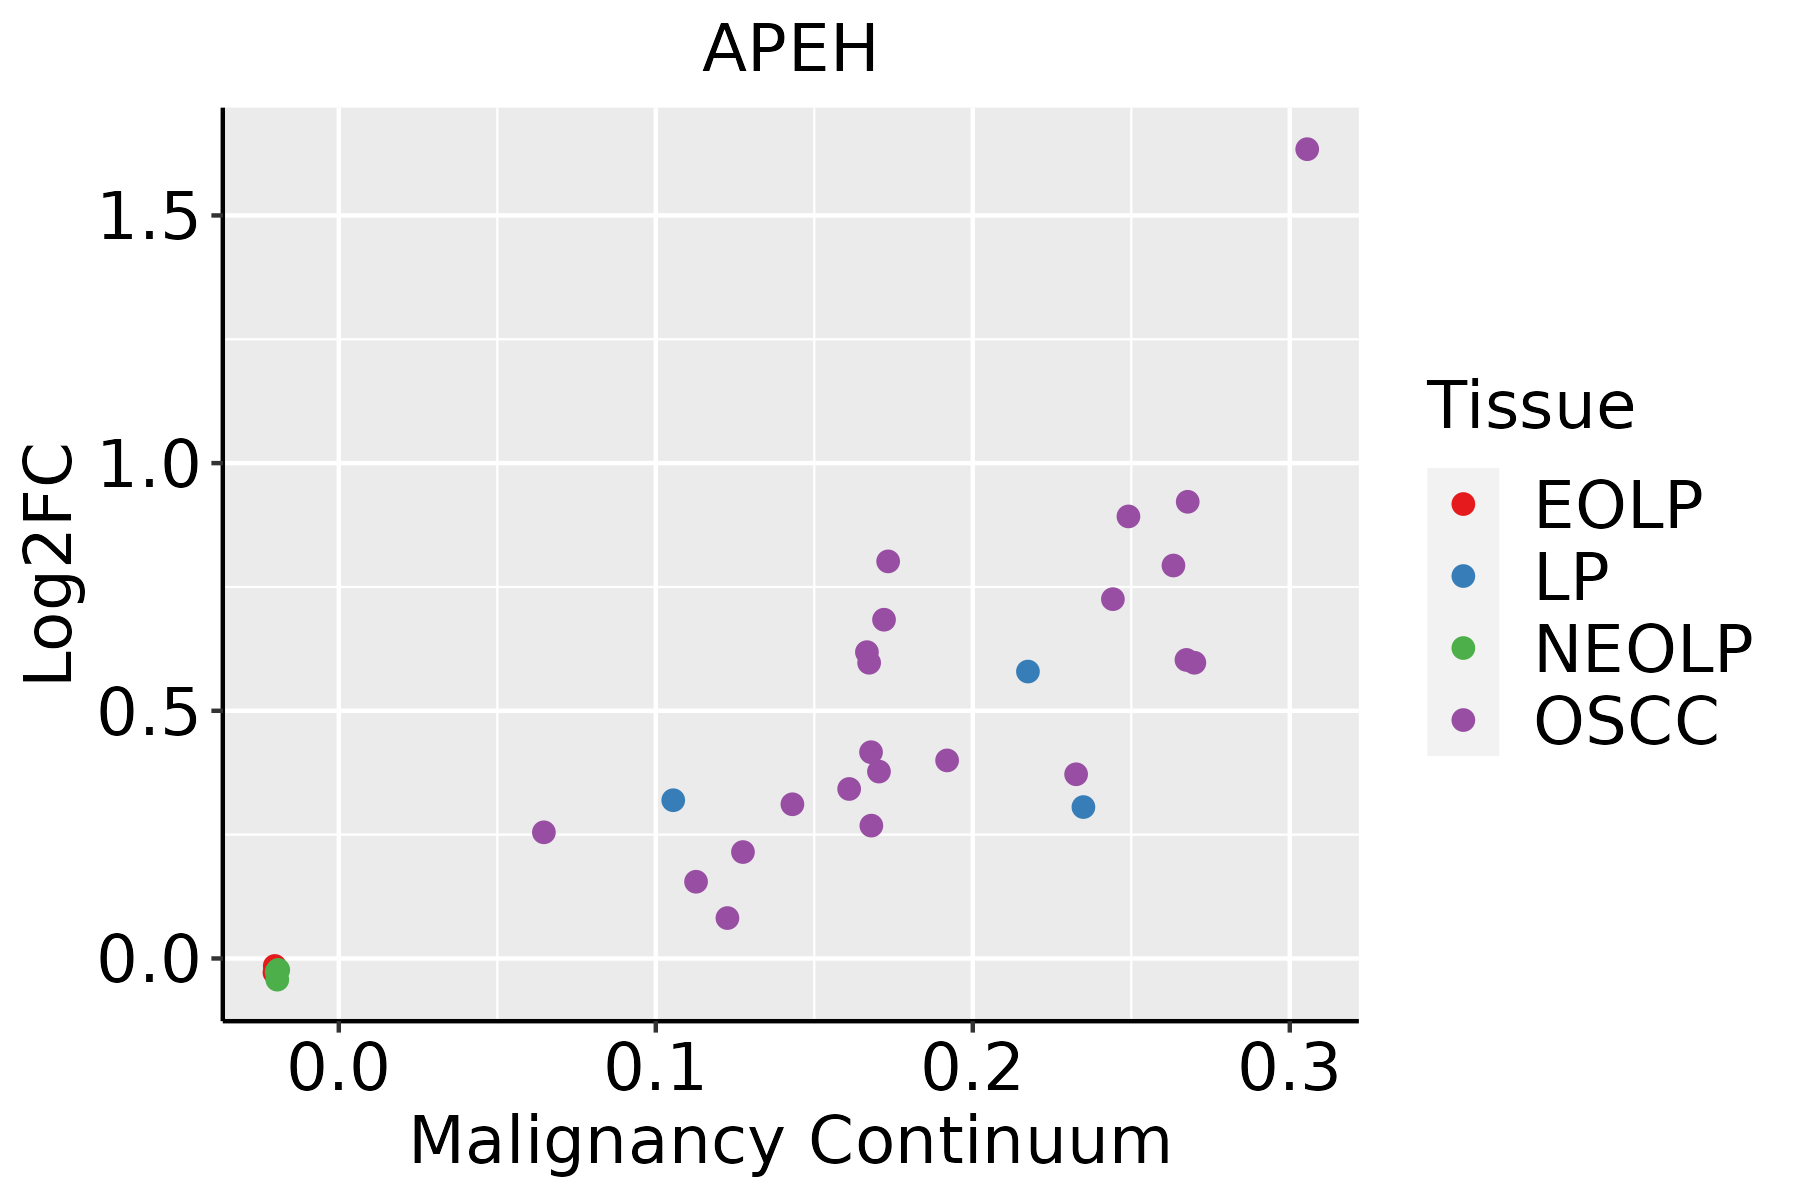 | EOLP: Erosive Oral lichen planus |
| LP: leukoplakia | ||
| NEOLP: Non-erosive oral lichen planus | ||
| OSCC: Oral squamous cell carcinoma | ||
| Skin | 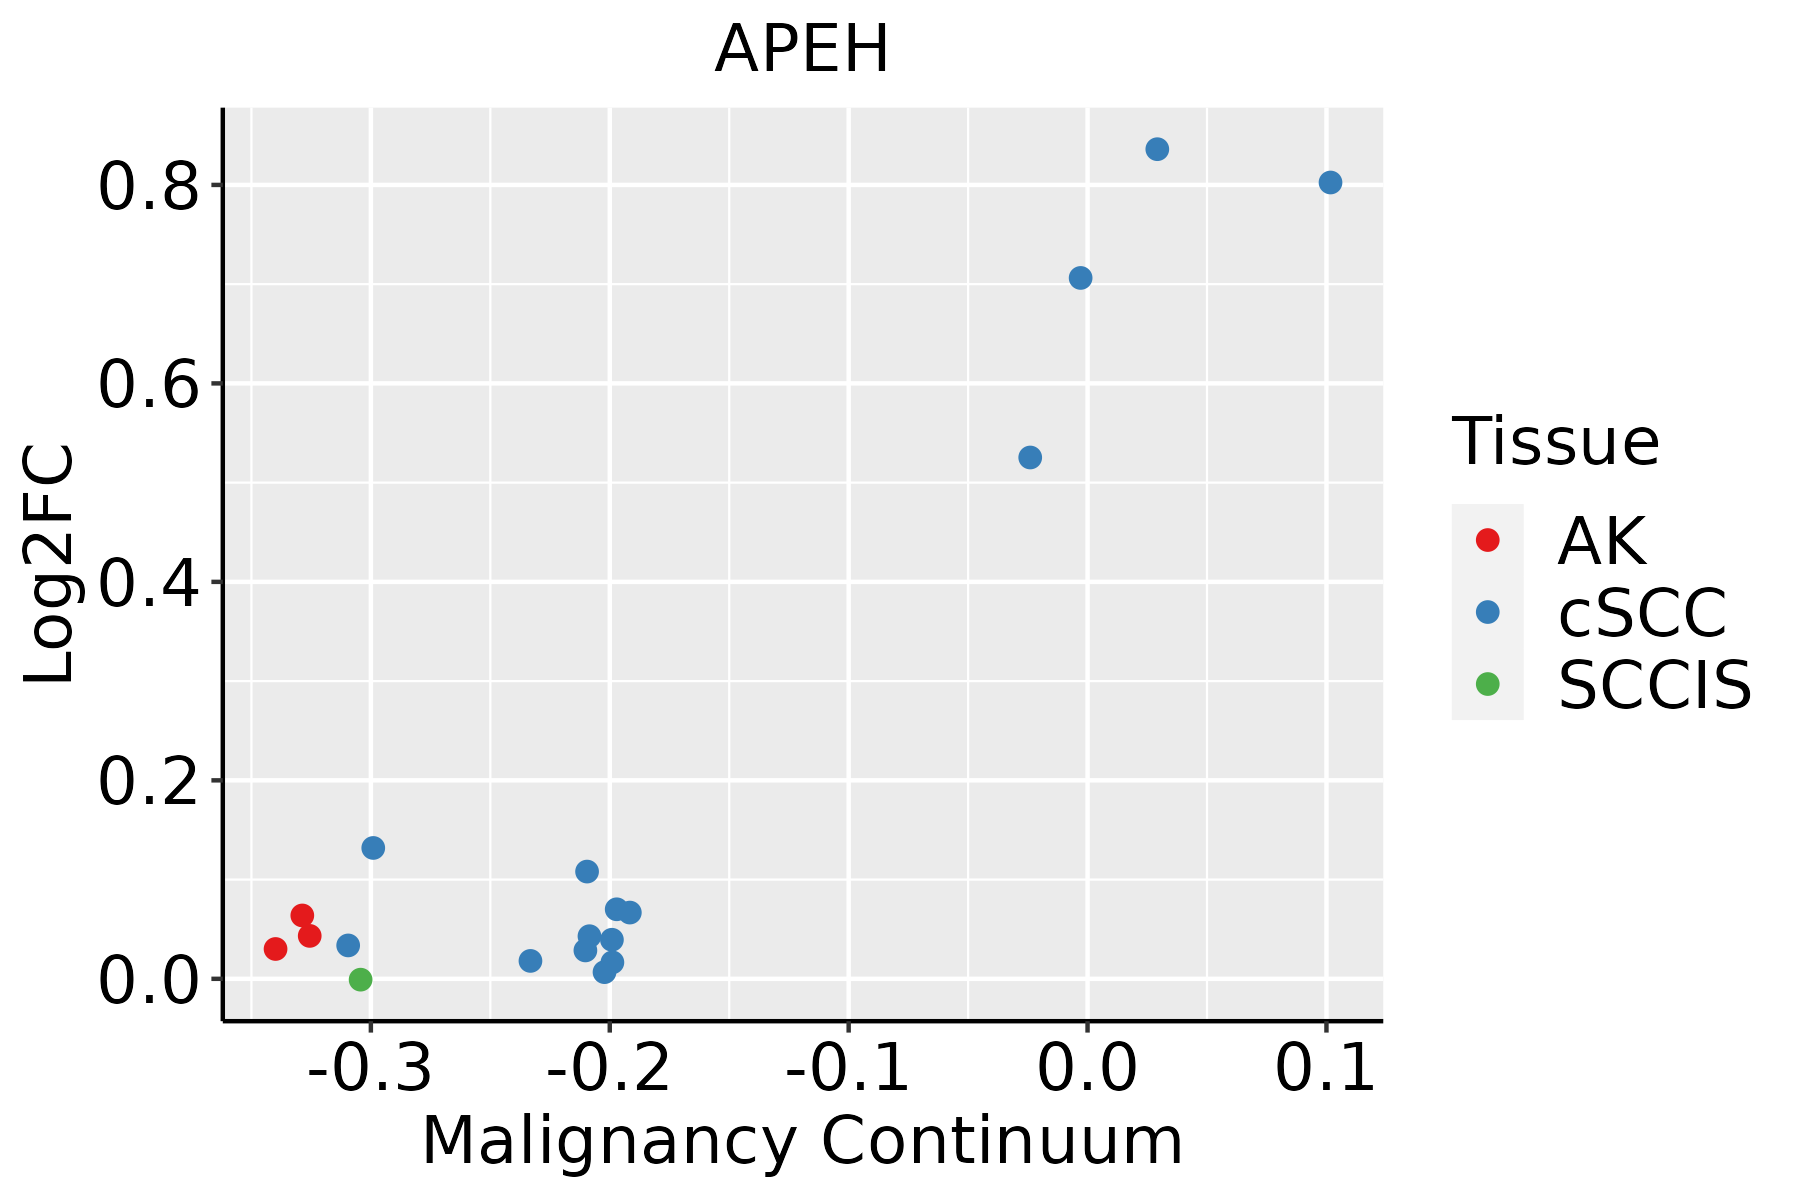 | AK: Actinic keratosis |
| cSCC: Cutaneous squamous cell carcinoma | ||
| SCCIS:squamous cell carcinoma in situ | ||
| Thyroid | 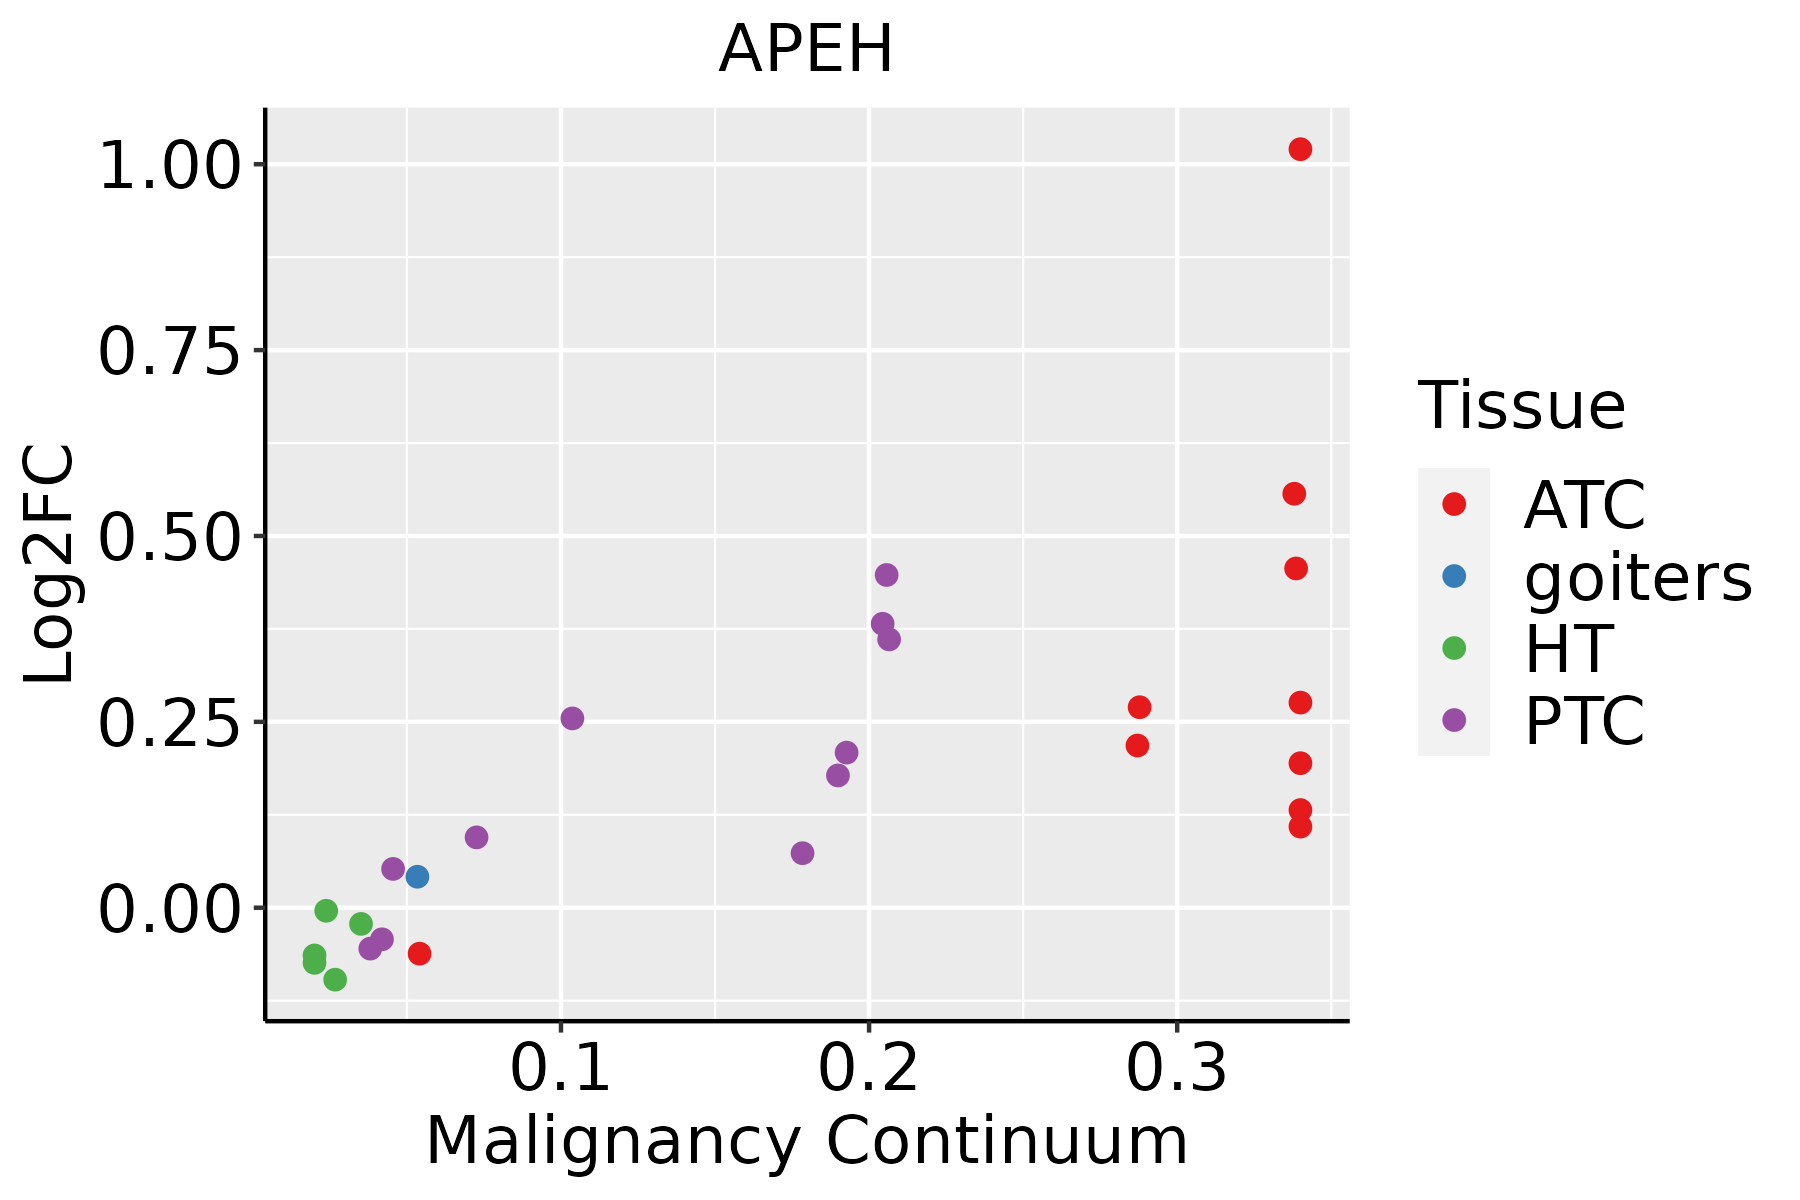 | ATC: Anaplastic thyroid cancer |
| HT: Hashimoto's thyroiditis | ||
| PTC: Papillary thyroid cancer |
| ∗log2FC in expression of this searched gene in stem-like cells from each diseased tissue sample relative to stem-like cells in normal samples in each tissue plotted against the malignancy continuum. Samples are colored based on if they are from different disease stage. |
Top |
Malignant transformation related pathway analysis |
| Find out the enriched GO biological processes and KEGG pathways involved in transition from healthy to precancer to cancer |
| Tissue | Disease Stage | Enriched GO biological Processes |
| Colorectum | AD |  |
| Colorectum | SER |  |
| Colorectum | MSS |  |
| Colorectum | MSI-H |  |
| Colorectum | FAP |  |
| ∗Top 15 enriched GO BP terms are showed in the bar plot of each disease state in each tissue. Each row represents a significant GO biological process which is colored according to the -log10(p.adjust). |
| Page: 1 2 3 4 5 6 7 8 9 |
| GO ID | Tissue | Disease Stage | Description | Gene Ratio | Bg Ratio | pvalue | p.adjust | Count |
| GO:0022411 | Colorectum | AD | cellular component disassembly | 147/3918 | 443/18723 | 8.53e-10 | 6.76e-08 | 147 |
| GO:0032984 | Colorectum | AD | protein-containing complex disassembly | 81/3918 | 224/18723 | 9.41e-08 | 4.65e-06 | 81 |
| GO:0043624 | Colorectum | AD | cellular protein complex disassembly | 45/3918 | 136/18723 | 6.24e-04 | 6.48e-03 | 45 |
| GO:00224111 | Colorectum | SER | cellular component disassembly | 114/2897 | 443/18723 | 1.17e-08 | 9.59e-07 | 114 |
| GO:00329841 | Colorectum | SER | protein-containing complex disassembly | 61/2897 | 224/18723 | 4.17e-06 | 1.60e-04 | 61 |
| GO:00436241 | Colorectum | SER | cellular protein complex disassembly | 37/2897 | 136/18723 | 3.08e-04 | 5.00e-03 | 37 |
| GO:00224112 | Colorectum | MSS | cellular component disassembly | 130/3467 | 443/18723 | 1.44e-08 | 8.46e-07 | 130 |
| GO:00329842 | Colorectum | MSS | protein-containing complex disassembly | 69/3467 | 224/18723 | 5.61e-06 | 1.50e-04 | 69 |
| GO:0050435 | Colorectum | MSS | amyloid-beta metabolic process | 21/3467 | 67/18723 | 7.90e-03 | 4.84e-02 | 21 |
| GO:00329843 | Colorectum | MSI-H | protein-containing complex disassembly | 28/1319 | 224/18723 | 2.24e-03 | 3.01e-02 | 28 |
| GO:00224113 | Colorectum | MSI-H | cellular component disassembly | 47/1319 | 443/18723 | 3.26e-03 | 3.99e-02 | 47 |
| GO:002241120 | Esophagus | HGIN | cellular component disassembly | 102/2587 | 443/18723 | 8.31e-08 | 4.33e-06 | 102 |
| GO:003298415 | Esophagus | HGIN | protein-containing complex disassembly | 50/2587 | 224/18723 | 3.43e-04 | 5.56e-03 | 50 |
| GO:0022411111 | Esophagus | ESCC | cellular component disassembly | 305/8552 | 443/18723 | 1.94e-23 | 4.57e-21 | 305 |
| GO:003298416 | Esophagus | ESCC | protein-containing complex disassembly | 151/8552 | 224/18723 | 3.45e-11 | 1.15e-09 | 151 |
| GO:00436245 | Esophagus | ESCC | cellular protein complex disassembly | 78/8552 | 136/18723 | 4.00e-03 | 1.62e-02 | 78 |
| GO:00224117 | Liver | Cirrhotic | cellular component disassembly | 182/4634 | 443/18723 | 1.59e-14 | 1.54e-12 | 182 |
| GO:00329846 | Liver | Cirrhotic | protein-containing complex disassembly | 82/4634 | 224/18723 | 4.78e-05 | 5.54e-04 | 82 |
| GO:002241112 | Liver | HCC | cellular component disassembly | 282/7958 | 443/18723 | 1.02e-19 | 1.38e-17 | 282 |
| GO:003298411 | Liver | HCC | protein-containing complex disassembly | 138/7958 | 224/18723 | 5.59e-09 | 1.46e-07 | 138 |
| Page: 1 2 |
| Pathway ID | Tissue | Disease Stage | Description | Gene Ratio | Bg Ratio | pvalue | p.adjust | qvalue | Count |
| Page: 1 |
Top |
Cell-cell communication analysis |
| Identification of potential cell-cell interactions between two cell types and their ligand-receptor pairs for different disease states |
| Ligand | Receptor | LRpair | Pathway | Tissue | Disease Stage |
| Page: 1 |
Top |
Single-cell gene regulatory network inference analysis |
| Find out the significant the regulons (TFs) and the target genes of each regulon across cell types for different disease states |
| TF | Cell Type | Tissue | Disease Stage | Target Gene | RSS | Regulon Activity |
| ∗The dot plots of a searched regulon are shown for all cell subpopulations in each disease state of each tissue based on the regulon specific score inferred using pySCENIC and by calculating the average expression. |
| Page: 1 |
Top |
Somatic mutation of malignant transformation related genes |
| Annotation of somatic variants for genes involved in malignant transformation |
| Hugo Symbol | Variant Class | Variant Classification | dbSNP RS | HGVSc | HGVSp | HGVSp Short | SWISSPROT | BIOTYPE | SIFT | PolyPhen | Tumor Sample Barcode | Tissue | Histology | Sex | Age | Stage | Therapy Types | Drugs | Outcome |
| APEH | SNV | Missense_Mutation | novel | c.251A>G | p.Asn84Ser | p.N84S | P13798 | protein_coding | tolerated(0.83) | benign(0) | TCGA-AN-A0FT-01 | Breast | breast invasive carcinoma | Female | <65 | I/II | Unknown | Unknown | SD |
| APEH | SNV | Missense_Mutation | novel | c.1822N>T | p.Val608Leu | p.V608L | P13798 | protein_coding | tolerated(0.08) | benign(0.357) | TCGA-E2-A155-01 | Breast | breast invasive carcinoma | Female | <65 | I/II | Chemotherapy | cytoxan | SD |
| APEH | insertion | Frame_Shift_Ins | novel | c.1833_1834insGAGAATGTGCAGTATGGTGAGCTGGG | p.Pro612GlufsTer11 | p.P612Efs*11 | P13798 | protein_coding | TCGA-AO-A0J9-01 | Breast | breast invasive carcinoma | Female | <65 | III/IV | Chemotherapy | cyclophosphamide | PD | ||
| APEH | deletion | Frame_Shift_Del | novel | c.1270delN | p.Ser425ProfsTer9 | p.S425Pfs*9 | P13798 | protein_coding | TCGA-D8-A27V-01 | Breast | breast invasive carcinoma | Female | <65 | I/II | Hormone Therapy | tamoxiphen | SD | ||
| APEH | deletion | Frame_Shift_Del | novel | c.1471delN | p.Pro491LeufsTer44 | p.P491Lfs*44 | P13798 | protein_coding | TCGA-EW-A2FV-01 | Breast | breast invasive carcinoma | Female | <65 | III/IV | Chemotherapy | docetaxel | SD | ||
| APEH | SNV | Missense_Mutation | novel | c.1505N>A | p.Met502Lys | p.M502K | P13798 | protein_coding | deleterious(0) | benign(0.044) | TCGA-EA-A410-01 | Cervix | cervical & endocervical cancer | Female | <65 | I/II | Unknown | Unknown | SD |
| APEH | SNV | Missense_Mutation | novel | c.2131N>C | p.Glu711Gln | p.E711Q | P13798 | protein_coding | tolerated(0.2) | benign(0.062) | TCGA-PN-A8MA-01 | Cervix | cervical & endocervical cancer | Female | <65 | I/II | Chemotherapy | cisplatin | SD |
| APEH | SNV | Missense_Mutation | c.1068N>A | p.Phe356Leu | p.F356L | P13798 | protein_coding | deleterious(0) | probably_damaging(0.991) | TCGA-A6-6141-01 | Colorectum | colon adenocarcinoma | Male | <65 | I/II | Chemotherapy | 5-fu | SD | |
| APEH | SNV | Missense_Mutation | rs758684307 | c.2078N>A | p.Arg693Gln | p.R693Q | P13798 | protein_coding | deleterious(0.02) | benign(0.435) | TCGA-AA-3833-01 | Colorectum | colon adenocarcinoma | Female | <65 | I/II | Unknown | Unknown | SD |
| APEH | SNV | Missense_Mutation | rs767157178 | c.335N>T | p.Thr112Met | p.T112M | P13798 | protein_coding | tolerated(0.09) | benign(0.205) | TCGA-AA-3984-01 | Colorectum | colon adenocarcinoma | Female | <65 | I/II | Unknown | Unknown | SD |
| Page: 1 2 3 4 5 6 |
Top |
Related drugs of malignant transformation related genes |
| Identification of chemicals and drugs interact with genes involved in malignant transfromation |
| (DGIdb 4.0) |
| Entrez ID | Symbol | Category | Interaction Types | Drug Claim Name | Drug Name | PMIDs |
| 327 | APEH | DRUGGABLE GENOME, PROTEASE, ENZYME | inhibitor | 252166764 |
| Page: 1 |

Copyright 2023-Present -The University of Texas Health Science Center at Houston |