
|
|||||
|
 | |
| |
| |
| |
| |
| |
|
Gene: APCS |
Gene summary for APCS |
| Gene information | Species | Human | Gene symbol | APCS | Gene ID | 325 |
| Gene name | amyloid P component, serum | |
| Gene Alias | HEL-S-92n | |
| Cytomap | 1q23.2 | |
| Gene Type | protein-coding | GO ID | GO:0002250 | UniProtAcc | P02743 |
Top |
Malignant transformation analysis |
| Identification of the aberrant gene expression in precancerous and cancerous lesions by comparing the gene expression of stem-like cells in diseased tissues with normal stem cells |
| Entrez ID | Symbol | Replicates | Species | Organ | Tissue | Adj P-value | Log2FC | Malignancy |
| 325 | APCS | NAFLD1 | Human | Liver | NAFLD | 1.90e-04 | 1.51e-01 | -0.04 |
| 325 | APCS | S43 | Human | Liver | Cirrhotic | 4.05e-17 | -3.77e-01 | -0.0187 |
| 325 | APCS | HCC1_Meng | Human | Liver | HCC | 5.06e-21 | -5.18e-01 | 0.0246 |
| 325 | APCS | HCC2_Meng | Human | Liver | HCC | 9.09e-22 | -7.53e-01 | 0.0107 |
| 325 | APCS | cirrhotic1 | Human | Liver | Cirrhotic | 5.64e-03 | -1.69e-01 | 0.0202 |
| 325 | APCS | cirrhotic2 | Human | Liver | Cirrhotic | 1.46e-10 | 3.29e-01 | 0.0201 |
| 325 | APCS | cirrhotic3 | Human | Liver | Cirrhotic | 6.45e-03 | -2.23e-01 | 0.0215 |
| 325 | APCS | HCC2 | Human | Liver | HCC | 2.68e-09 | 6.48e+00 | 0.5341 |
| 325 | APCS | HCC5 | Human | Liver | HCC | 2.52e-06 | 1.82e+00 | 0.4932 |
| 325 | APCS | Pt13.a | Human | Liver | HCC | 8.41e-40 | 6.80e-01 | 0.021 |
| 325 | APCS | Pt13.b | Human | Liver | HCC | 2.14e-49 | 4.12e-01 | 0.0251 |
| 325 | APCS | Pt14.d | Human | Liver | HCC | 1.15e-07 | -5.03e-01 | 0.0143 |
| 325 | APCS | S014 | Human | Liver | HCC | 2.59e-22 | -4.62e-01 | 0.2254 |
| 325 | APCS | S015 | Human | Liver | HCC | 3.28e-09 | -7.09e-01 | 0.2375 |
| 325 | APCS | S016 | Human | Liver | HCC | 2.51e-25 | -7.82e-01 | 0.2243 |
| 325 | APCS | S027 | Human | Liver | HCC | 3.79e-22 | 3.91e+00 | 0.2446 |
| 325 | APCS | S028 | Human | Liver | HCC | 1.07e-30 | 3.33e+00 | 0.2503 |
| 325 | APCS | S029 | Human | Liver | HCC | 7.94e-36 | 4.34e+00 | 0.2581 |
| Page: 1 |
| Tissue | Expression Dynamics | Abbreviation |
| Liver | 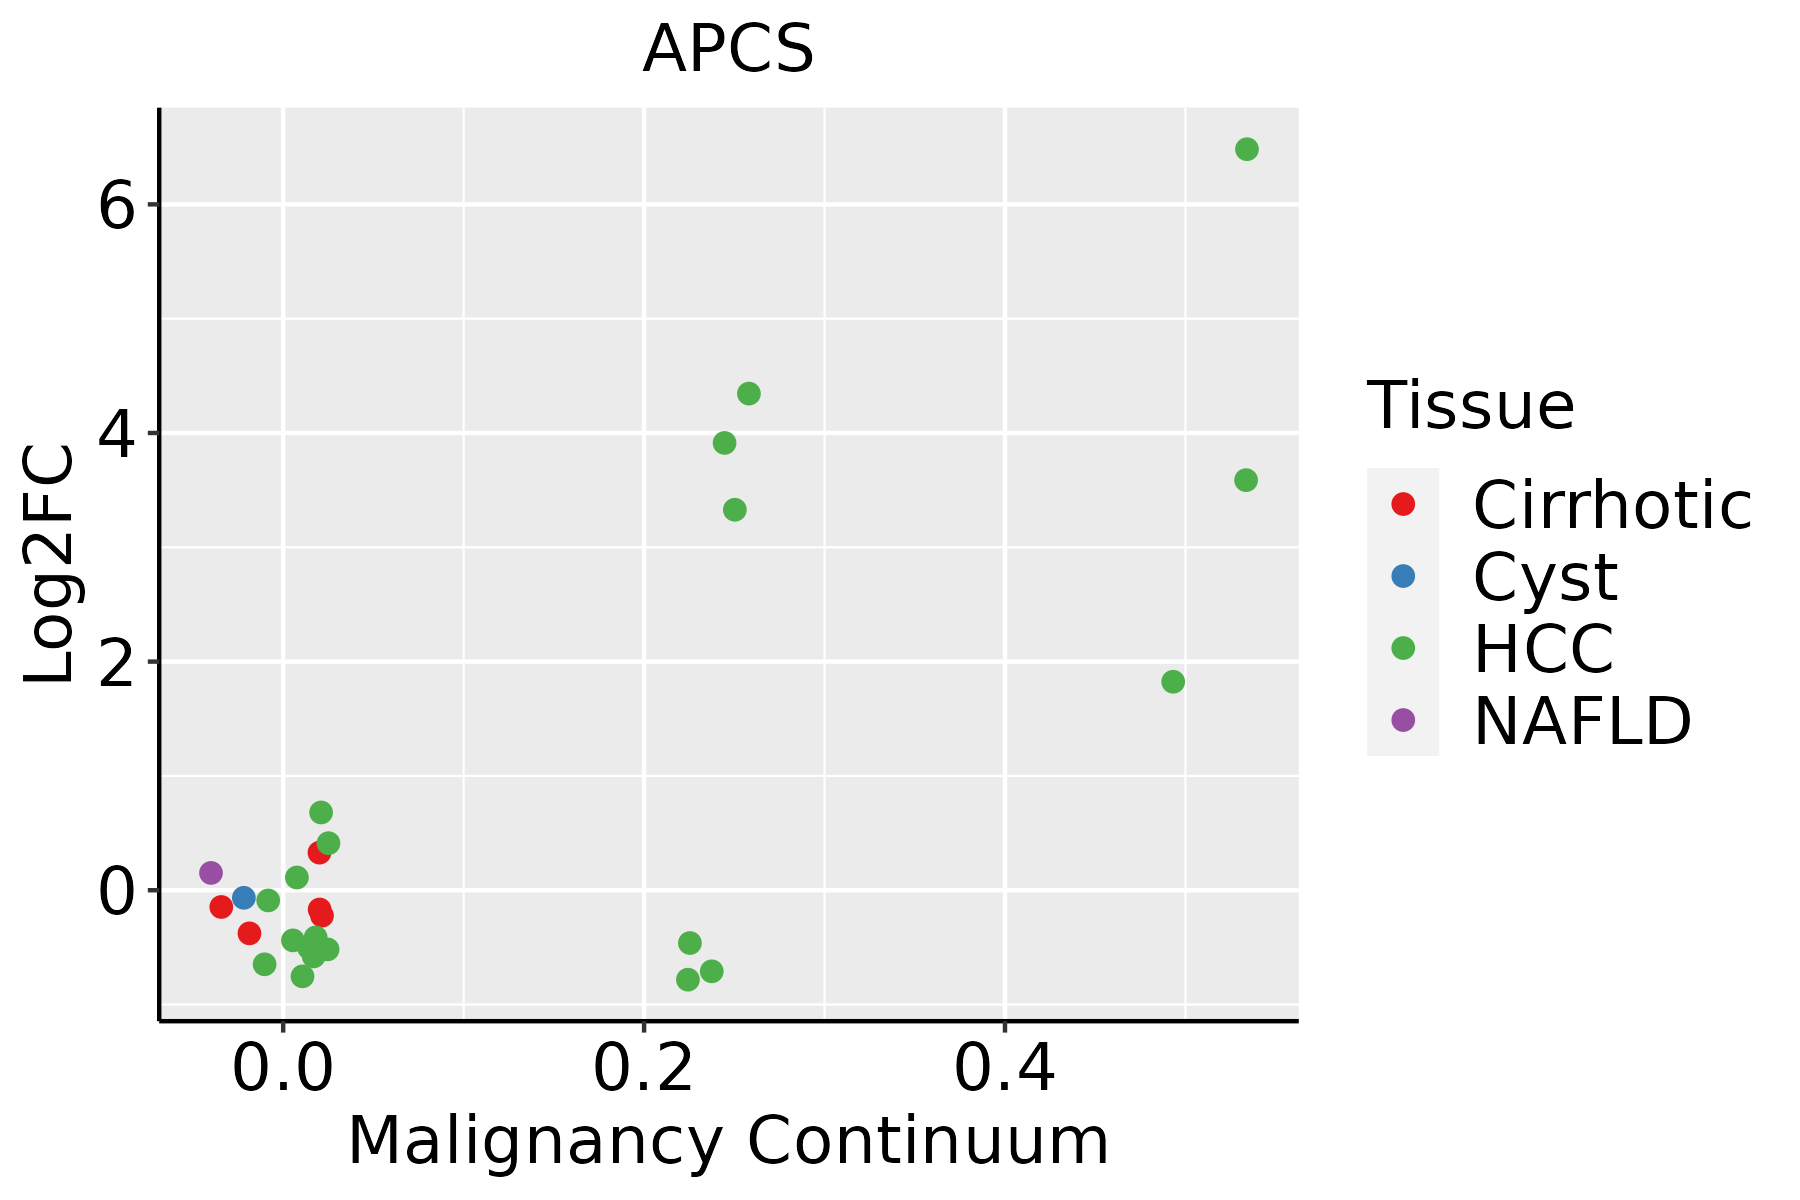 | HCC: Hepatocellular carcinoma |
| NAFLD: Non-alcoholic fatty liver disease |
| ∗log2FC in expression of this searched gene in stem-like cells from each diseased tissue sample relative to stem-like cells in normal samples in each tissue plotted against the malignancy continuum. Samples are colored based on if they are from different disease stage. |
Top |
Malignant transformation related pathway analysis |
| Find out the enriched GO biological processes and KEGG pathways involved in transition from healthy to precancer to cancer |
| Tissue | Disease Stage | Enriched GO biological Processes |
| Colorectum | AD |  |
| Colorectum | SER |  |
| Colorectum | MSS |  |
| Colorectum | MSI-H |  |
| Colorectum | FAP |  |
| ∗Top 15 enriched GO BP terms are showed in the bar plot of each disease state in each tissue. Each row represents a significant GO biological process which is colored according to the -log10(p.adjust). |
| Page: 1 2 3 4 5 6 7 8 9 |
| GO ID | Tissue | Disease Stage | Description | Gene Ratio | Bg Ratio | pvalue | p.adjust | Count |
| GO:00610417 | Liver | NAFLD | regulation of wound healing | 39/1882 | 134/18723 | 5.52e-10 | 1.28e-07 | 39 |
| GO:00420607 | Liver | NAFLD | wound healing | 84/1882 | 422/18723 | 6.56e-10 | 1.37e-07 | 84 |
| GO:00160327 | Liver | NAFLD | viral process | 80/1882 | 415/18723 | 7.71e-09 | 1.07e-06 | 80 |
| GO:0061045 | Liver | NAFLD | negative regulation of wound healing | 26/1882 | 78/18723 | 1.86e-08 | 2.09e-06 | 26 |
| GO:19030347 | Liver | NAFLD | regulation of response to wounding | 41/1882 | 167/18723 | 4.70e-08 | 4.58e-06 | 41 |
| GO:1903035 | Liver | NAFLD | negative regulation of response to wounding | 26/1882 | 94/18723 | 1.18e-06 | 5.66e-05 | 26 |
| GO:00190587 | Liver | NAFLD | viral life cycle | 57/1882 | 317/18723 | 1.00e-05 | 3.18e-04 | 57 |
| GO:0002526 | Liver | NAFLD | acute inflammatory response | 26/1882 | 112/18723 | 3.68e-05 | 9.23e-04 | 26 |
| GO:00513467 | Liver | NAFLD | negative regulation of hydrolase activity | 62/1882 | 379/18723 | 8.11e-05 | 1.66e-03 | 62 |
| GO:00444037 | Liver | NAFLD | biological process involved in symbiotic interaction | 50/1882 | 290/18723 | 1.03e-04 | 2.04e-03 | 50 |
| GO:0006953 | Liver | NAFLD | acute-phase response | 13/1882 | 49/18723 | 8.43e-04 | 1.03e-02 | 13 |
| GO:00517024 | Liver | NAFLD | biological process involved in interaction with symbiont | 20/1882 | 94/18723 | 9.23e-04 | 1.10e-02 | 20 |
| GO:0032102 | Liver | NAFLD | negative regulation of response to external stimulus | 60/1882 | 420/18723 | 3.34e-03 | 2.93e-02 | 60 |
| GO:00300997 | Liver | NAFLD | myeloid cell differentiation | 55/1882 | 381/18723 | 3.86e-03 | 3.28e-02 | 55 |
| GO:0051851 | Liver | NAFLD | modulation by host of symbiont process | 13/1882 | 60/18723 | 5.85e-03 | 4.45e-02 | 13 |
| GO:0051817 | Liver | NAFLD | modulation of process of other organism involved in symbiotic interaction | 16/1882 | 81/18723 | 6.20e-03 | 4.62e-02 | 16 |
| GO:00517017 | Liver | NAFLD | biological process involved in interaction with host | 32/1882 | 203/18723 | 6.90e-03 | 4.87e-02 | 32 |
| GO:001603212 | Liver | Cirrhotic | viral process | 203/4634 | 415/18723 | 5.40e-27 | 3.76e-24 | 203 |
| GO:00064577 | Liver | Cirrhotic | protein folding | 114/4634 | 212/18723 | 9.23e-20 | 2.31e-17 | 114 |
| GO:001905812 | Liver | Cirrhotic | viral life cycle | 148/4634 | 317/18723 | 1.12e-17 | 1.64e-15 | 148 |
| Page: 1 2 3 4 |
| Pathway ID | Tissue | Disease Stage | Description | Gene Ratio | Bg Ratio | pvalue | p.adjust | qvalue | Count |
| Page: 1 |
Top |
Cell-cell communication analysis |
| Identification of potential cell-cell interactions between two cell types and their ligand-receptor pairs for different disease states |
| Ligand | Receptor | LRpair | Pathway | Tissue | Disease Stage |
| Page: 1 |
Top |
Single-cell gene regulatory network inference analysis |
| Find out the significant the regulons (TFs) and the target genes of each regulon across cell types for different disease states |
| TF | Cell Type | Tissue | Disease Stage | Target Gene | RSS | Regulon Activity |
| ∗The dot plots of a searched regulon are shown for all cell subpopulations in each disease state of each tissue based on the regulon specific score inferred using pySCENIC and by calculating the average expression. |
| Page: 1 |
Top |
Somatic mutation of malignant transformation related genes |
| Annotation of somatic variants for genes involved in malignant transformation |
| Hugo Symbol | Variant Class | Variant Classification | dbSNP RS | HGVSc | HGVSp | HGVSp Short | SWISSPROT | BIOTYPE | SIFT | PolyPhen | Tumor Sample Barcode | Tissue | Histology | Sex | Age | Stage | Therapy Types | Drugs | Outcome |
| APCS | SNV | Missense_Mutation | novel | c.257N>C | p.Arg86Thr | p.R86T | P02743 | protein_coding | deleterious(0) | benign(0.371) | TCGA-AC-A6IX-01 | Breast | breast invasive carcinoma | Female | <65 | III/IV | Unknown | Unknown | SD |
| APCS | SNV | Missense_Mutation | c.485N>G | p.Lys162Arg | p.K162R | P02743 | protein_coding | tolerated(0.16) | benign(0) | TCGA-BH-A0E0-01 | Breast | breast invasive carcinoma | Female | <65 | III/IV | Chemotherapy | docetaxel | SD | |
| APCS | SNV | Missense_Mutation | novel | c.38G>A | p.Ser13Asn | p.S13N | P02743 | protein_coding | tolerated(0.28) | benign(0.139) | TCGA-OL-A66H-01 | Breast | breast invasive carcinoma | Female | >=65 | I/II | Unknown | Unknown | SD |
| APCS | insertion | Frame_Shift_Ins | novel | c.222_223insCACTCAATGACCAAGGACTCAAAGAAGAGGAGAGAAAAACTTGG | p.Gly75HisfsTer22 | p.G75Hfs*22 | P02743 | protein_coding | TCGA-A8-A094-01 | Breast | breast invasive carcinoma | Female | >=65 | I/II | Unknown | Unknown | SD | ||
| APCS | SNV | Missense_Mutation | c.391A>G | p.Thr131Ala | p.T131A | P02743 | protein_coding | deleterious(0) | benign(0.01) | TCGA-C5-A7UE-01 | Cervix | cervical & endocervical cancer | Female | <65 | I/II | Chemotherapy | cisplatin | SD | |
| APCS | SNV | Missense_Mutation | novel | c.373N>A | p.Glu125Lys | p.E125K | P02743 | protein_coding | deleterious(0) | probably_damaging(0.985) | TCGA-DS-A5RQ-01 | Cervix | cervical & endocervical cancer | Female | >=65 | I/II | Chemotherapy | cisplatin | CR |
| APCS | SNV | Missense_Mutation | c.128N>T | p.Thr43Ile | p.T43I | P02743 | protein_coding | tolerated(0.18) | benign(0.124) | TCGA-AA-3833-01 | Colorectum | colon adenocarcinoma | Female | <65 | I/II | Unknown | Unknown | SD | |
| APCS | SNV | Missense_Mutation | c.581N>T | p.Gly194Val | p.G194V | P02743 | protein_coding | deleterious(0) | probably_damaging(0.961) | TCGA-CA-5797-01 | Colorectum | colon adenocarcinoma | Male | <65 | I/II | Unknown | Unknown | SD | |
| APCS | SNV | Missense_Mutation | rs761743822 | c.313N>A | p.Glu105Lys | p.E105K | P02743 | protein_coding | tolerated(0.05) | possibly_damaging(0.849) | TCGA-CA-6718-01 | Colorectum | colon adenocarcinoma | Male | <65 | I/II | Unknown | Unknown | PD |
| APCS | SNV | Missense_Mutation | rs757884673 | c.323C>T | p.Pro108Leu | p.P108L | P02743 | protein_coding | tolerated(0.63) | benign(0.078) | TCGA-AG-A002-01 | Colorectum | rectum adenocarcinoma | Male | <65 | I/II | Unknown | Unknown | SD |
| Page: 1 2 3 4 5 |
Top |
Related drugs of malignant transformation related genes |
| Identification of chemicals and drugs interact with genes involved in malignant transfromation |
| (DGIdb 4.0) |
| Entrez ID | Symbol | Category | Interaction Types | Drug Claim Name | Drug Name | PMIDs |
| 325 | APCS | TRANSPORTER, DRUGGABLE GENOME | GSK2398852 | DEZAMIZUMAB | ||
| 325 | APCS | TRANSPORTER, DRUGGABLE GENOME | GSK-2315698 | MIRIDESAP | 26225229 | |
| 325 | APCS | TRANSPORTER, DRUGGABLE GENOME | inhibitor | 249565936 | MIRIDESAP | |
| 325 | APCS | TRANSPORTER, DRUGGABLE GENOME | CPHPC | MIRIDESAP | ||
| 325 | APCS | TRANSPORTER, DRUGGABLE GENOME | antibody | 249565935 | DEZAMIZUMAB |
| Page: 1 |

Copyright 2023-Present -The University of Texas Health Science Center at Houston |