Schematic overview of the cellular and molecular mechanisms involved in the cancer progression, including the proposed cellular and molecular mechanisms in cancer cells trajectory. AT1: alveolar type 1 cells; AT2: alveolar type 2 cells; AAH: atypical adenomatous hyperplasia; AIS: adenocarcinoma in situ; MIA: minimally invasive adenocarcinoma; IA: invasive adenocarcinoma; EMT: epithelial-mesenchymal transition

Home

Download

Statistics

Help

Contact

Center for Computational Systems Medicine
leaf

Gene summary

leaf

Malignant transformation analysis

leaf

Malignant transformation related pathway analysis

leaf

Cell-cell communication analysis

leaf

Single-cell gene regulatory network inference analysis

leaf

Somatic mutation of malignant transformation related genes

leaf

Related drugs of malignant transformation related genes

Gene: APCDD1

Gene summary for APCDD1

check button Gene summary.

Gene informationSpeciesHuman
Gene symbol

APCDD1

Gene ID

147495

Gene nameAPC down-regulated 1
Gene AliasB7323
Cytomap18p11.22
Gene Typeprotein-coding
GO ID

GO:0001942

UniProtAcc

Q8J025


Top

Malignant transformation analysis

check button Identification of the aberrant gene expression in precancerous and cancerous lesions by comparing the gene expression of stem-like cells in diseased tissues with normal stem cells
check button Malignant transformation involving gene list.
Entrez IDSymbolReplicatesSpeciesOrganTissueAdj P-valueLog2FCMalignancy
147495APCDD1HTA11_3410_2000001011HumanColorectumAD8.26e-154.63e-010.0155
147495APCDD1HTA11_2951_2000001011HumanColorectumAD2.17e-095.05e-010.0216
147495APCDD1HTA11_696_2000001011HumanColorectumAD1.58e-136.06e-01-0.1464
147495APCDD1HTA11_1391_2000001011HumanColorectumAD2.57e-053.45e-01-0.059
147495APCDD1HTA11_546_2000001011HumanColorectumAD4.17e-024.18e-01-0.0842
147495APCDD1HTA11_866_3004761011HumanColorectumAD8.37e-591.89e+000.096
147495APCDD1HTA11_10711_2000001011HumanColorectumAD3.65e-181.13e+000.0338
147495APCDD1HTA11_7696_3000711011HumanColorectumAD6.56e-266.44e-010.0674
147495APCDD1HTA11_11156_2000001011HumanColorectumAD9.65e-078.33e-010.0397
147495APCDD1HTA11_99999970781_79442HumanColorectumMSS1.21e-391.03e+000.294
147495APCDD1HTA11_99999971662_82457HumanColorectumMSS3.14e-461.29e+000.3859
147495APCDD1HTA11_99999973899_84307HumanColorectumMSS5.51e-094.38e-010.2585
147495APCDD1HTA11_99999974143_84620HumanColorectumMSS1.97e-1061.98e+000.3005
147495APCDD1F007HumanColorectumFAP7.74e-063.49e-010.1176
147495APCDD1A002-C-010HumanColorectumFAP6.99e-134.31e-010.242
147495APCDD1A001-C-207HumanColorectumFAP1.16e-145.44e-010.1278
147495APCDD1A015-C-203HumanColorectumFAP6.20e-207.45e-01-0.1294
147495APCDD1A015-C-204HumanColorectumFAP3.59e-053.20e-01-0.0228
147495APCDD1A002-C-201HumanColorectumFAP3.85e-032.22e-010.0324
147495APCDD1A002-C-203HumanColorectumFAP8.13e-031.93e-010.2786
Page: 1 2 3 4 5 6 

check button Transcriptomic changes along malignancy continuum.
TissueExpression DynamicsAbbreviation
Colorectum (GSE201348)The image shows the transcriptomic changes along malignancy continuum.log2FC in expression of this searched gene in stem-like cells from each diseased tissue sample relative to stem-like cells in normal samples in each tissue plotted against the malignancy continuum. Samples are colored based on if they are from different disease stage.FAP: Familial adenomatous polyposis
CRC: Colorectal cancer
Colorectum (HTA11)The image shows the transcriptomic changes along malignancy continuum.log2FC in expression of this searched gene in stem-like cells from each diseased tissue sample relative to stem-like cells in normal samples in each tissue plotted against the malignancy continuum. Samples are colored based on if they are from different disease stage.AD: Adenomas
SER: Sessile serrated lesions
MSI-H: Microsatellite-high colorectal cancer
MSS: Microsatellite stable colorectal cancer
EndometriumThe image shows the transcriptomic changes along malignancy continuum.log2FC in expression of this searched gene in stem-like cells from each diseased tissue sample relative to stem-like cells in normal samples in each tissue plotted against the malignancy continuum. Samples are colored based on if they are from different disease stage.
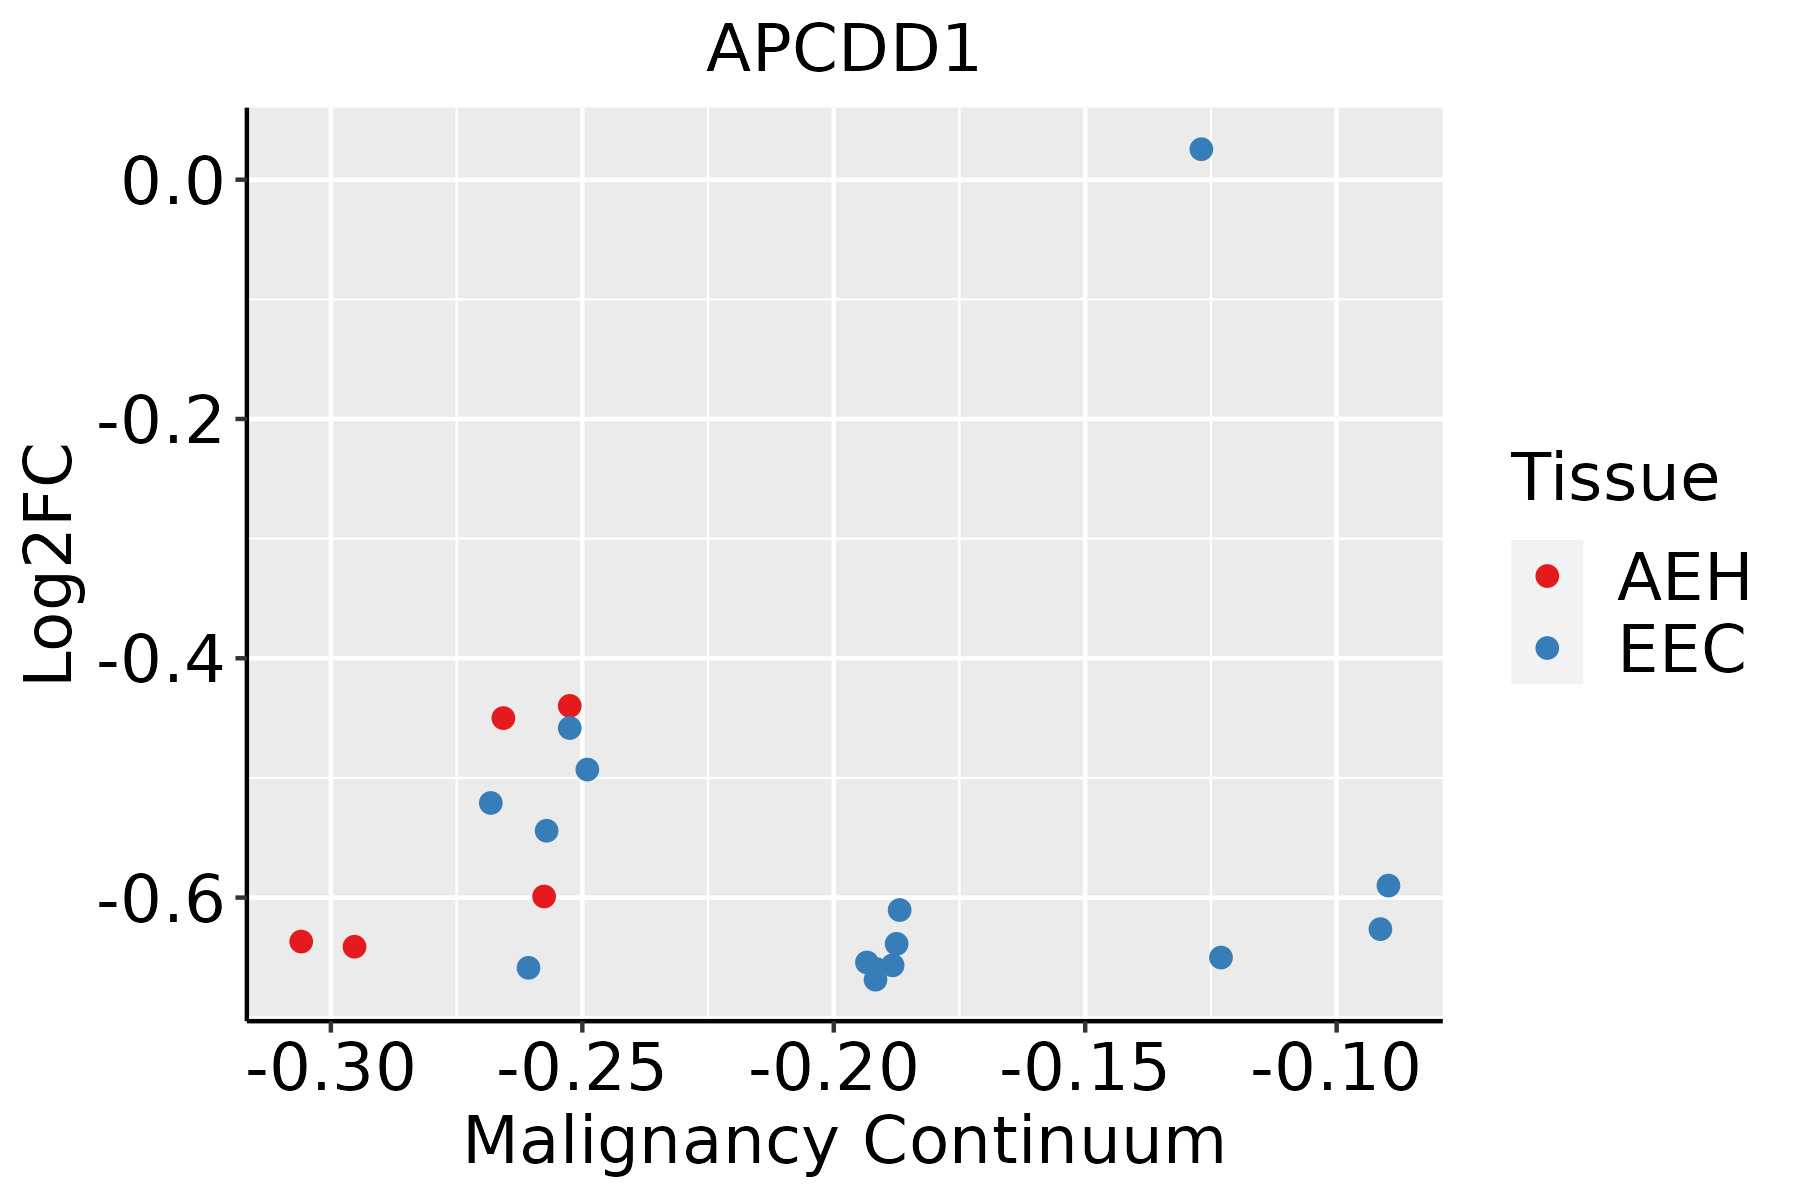
AEH: Atypical endometrial hyperplasia
EEC: Endometrioid Cancer
EsophagusThe image shows the transcriptomic changes along malignancy continuum.log2FC in expression of this searched gene in stem-like cells from each diseased tissue sample relative to stem-like cells in normal samples in each tissue plotted against the malignancy continuum. Samples are colored based on if they are from different disease stage.
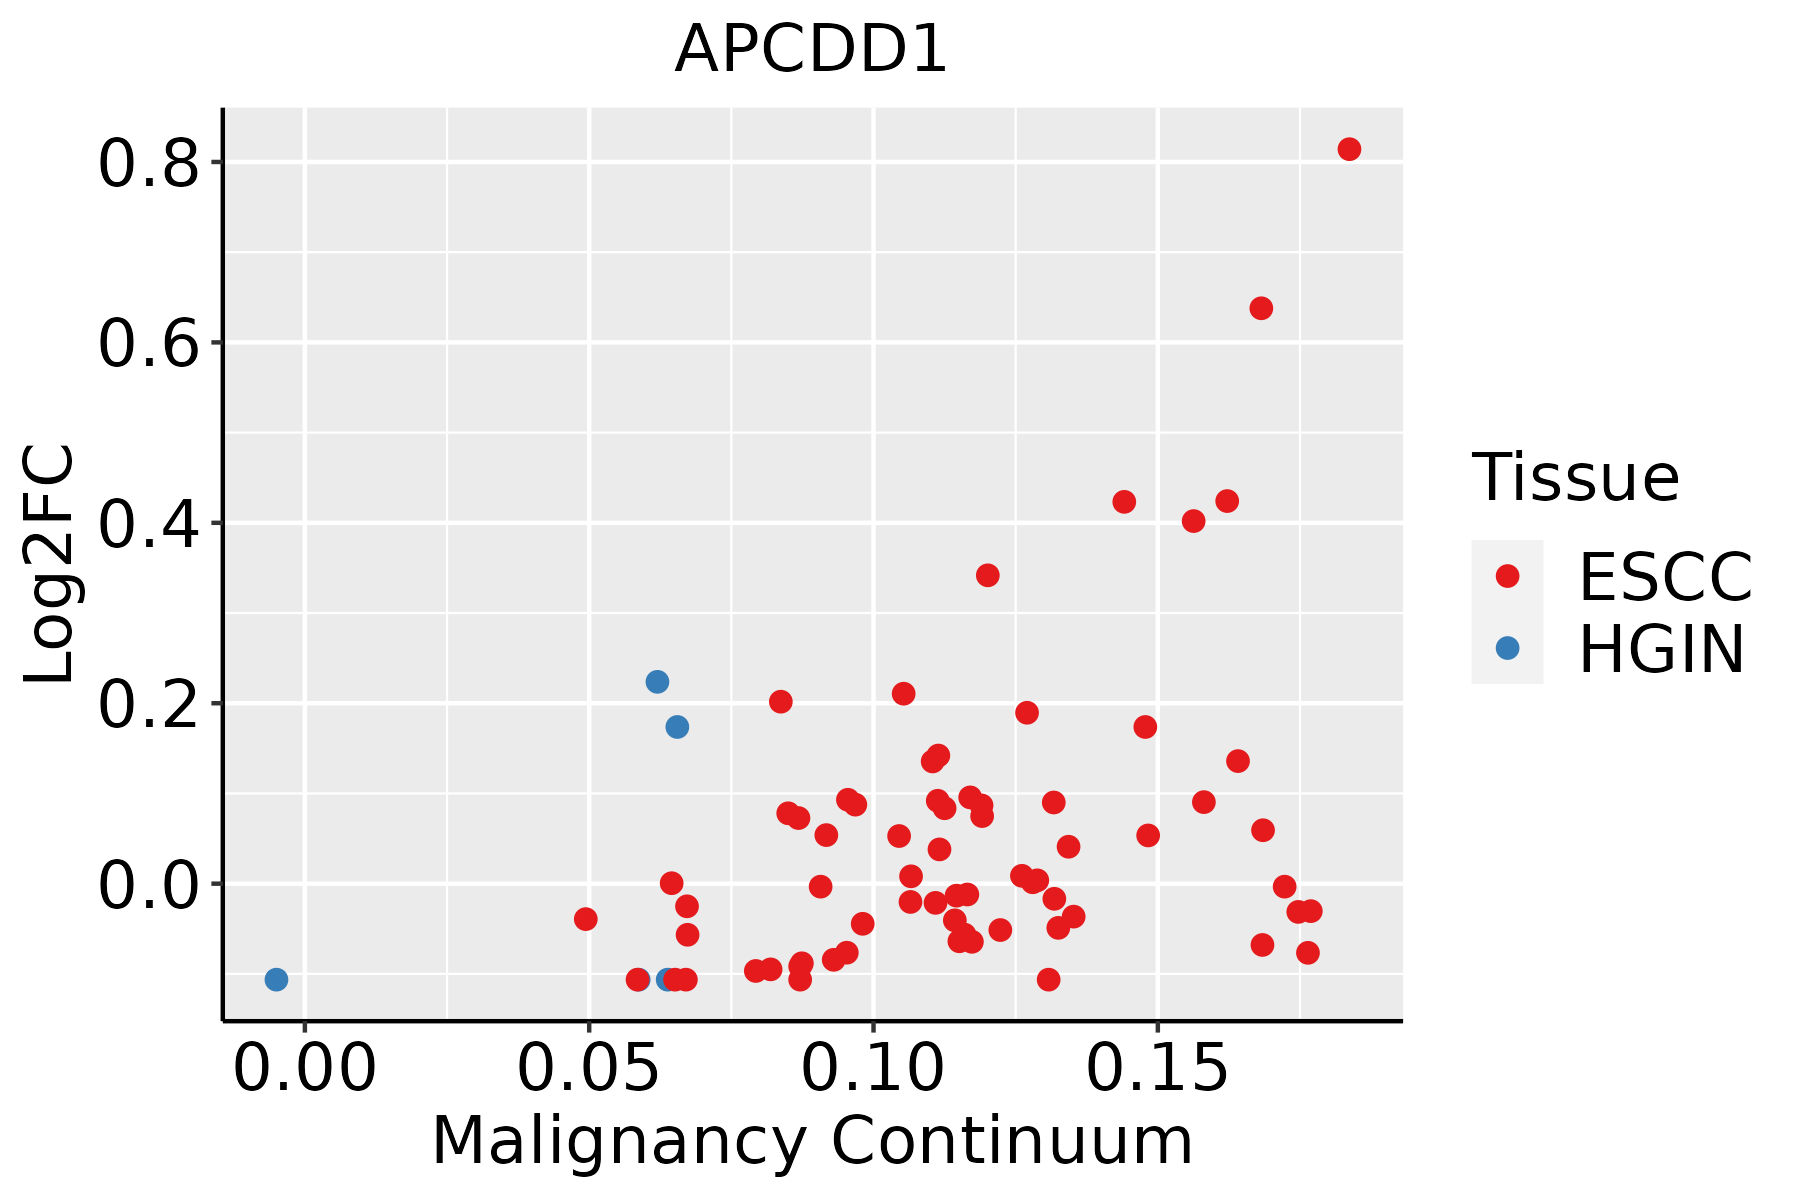
ESCC: Esophageal squamous cell carcinoma
HGIN: High-grade intraepithelial neoplasias
LGIN: Low-grade intraepithelial neoplasias
LiverThe image shows the transcriptomic changes along malignancy continuum.log2FC in expression of this searched gene in stem-like cells from each diseased tissue sample relative to stem-like cells in normal samples in each tissue plotted against the malignancy continuum. Samples are colored based on if they are from different disease stage.HCC: Hepatocellular carcinoma
NAFLD: Non-alcoholic fatty liver disease
Oral CavityThe image shows the transcriptomic changes along malignancy continuum.log2FC in expression of this searched gene in stem-like cells from each diseased tissue sample relative to stem-like cells in normal samples in each tissue plotted against the malignancy continuum. Samples are colored based on if they are from different disease stage.
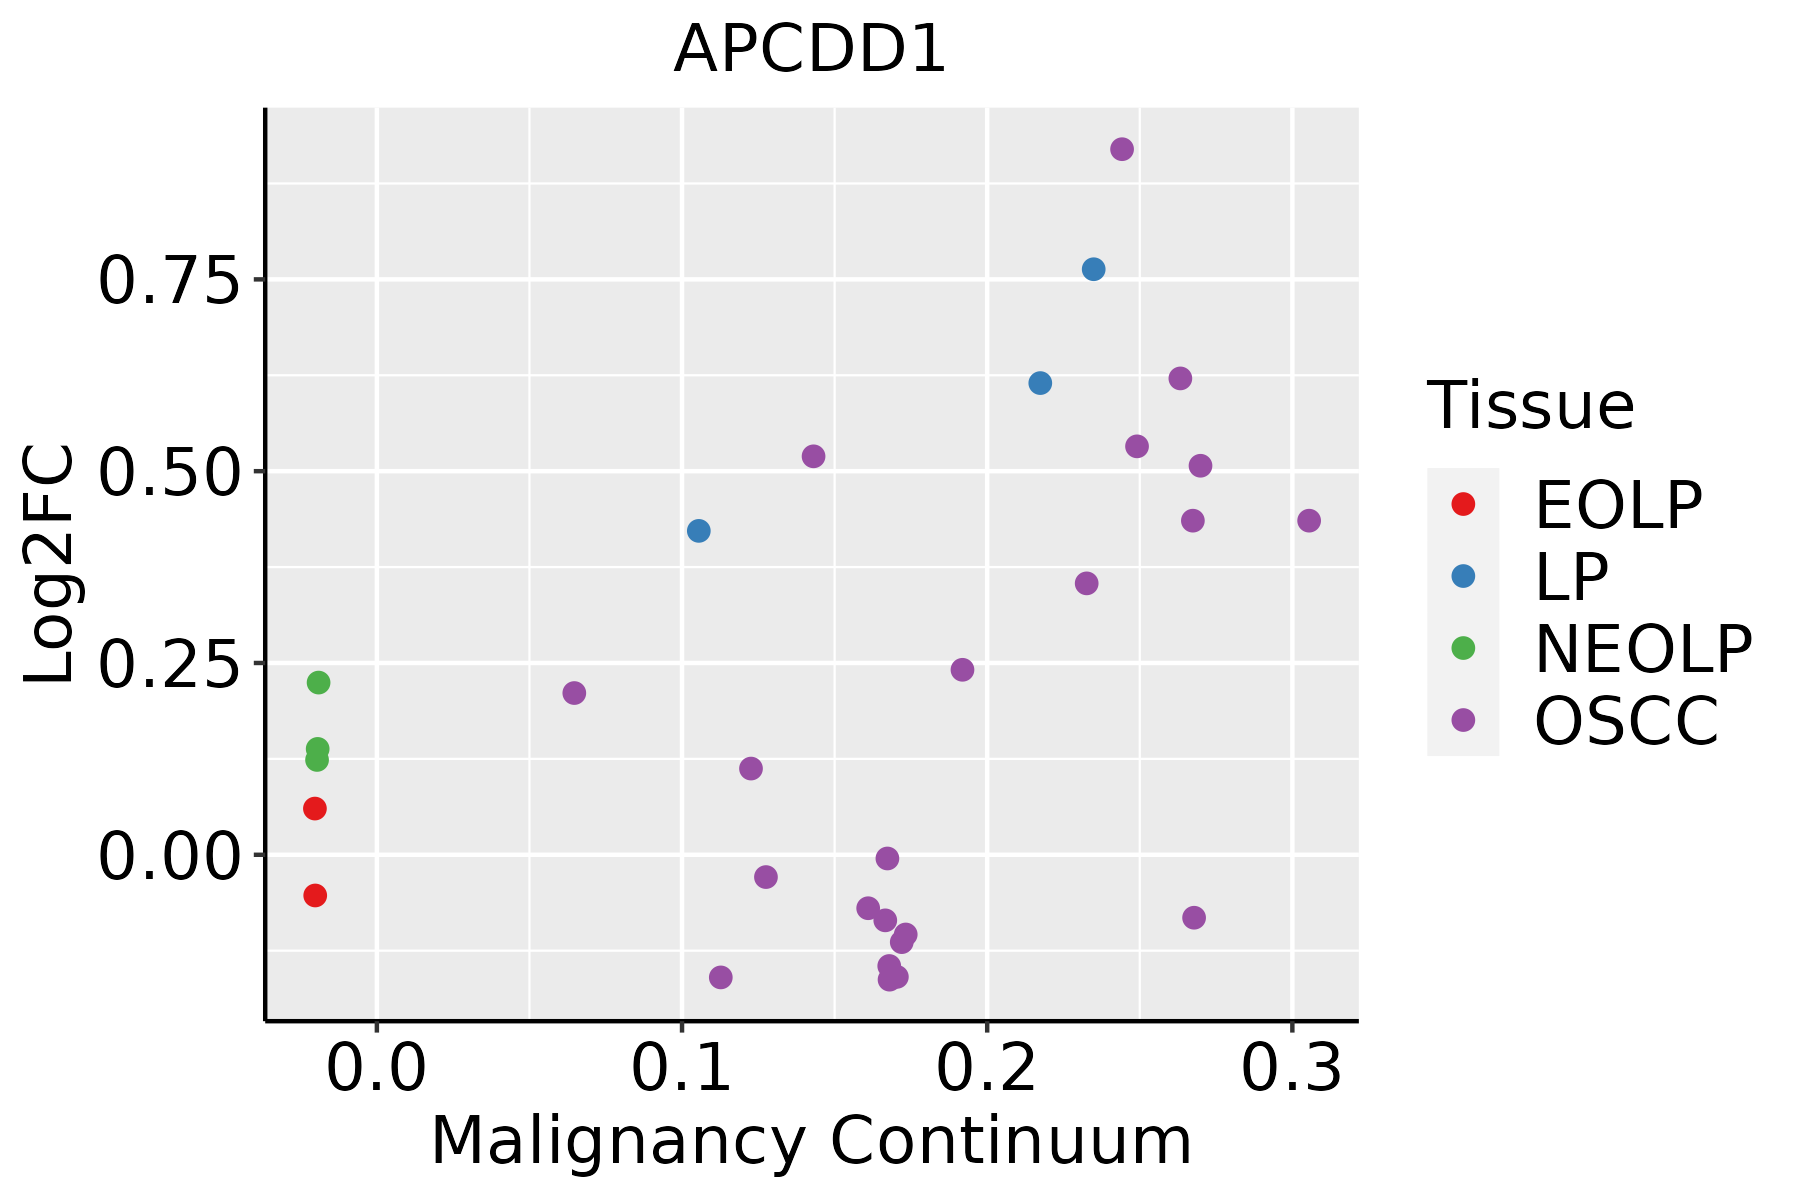
EOLP: Erosive Oral lichen planus
LP: leukoplakia
NEOLP: Non-erosive oral lichen planus
OSCC: Oral squamous cell carcinoma
SkinThe image shows the transcriptomic changes along malignancy continuum.log2FC in expression of this searched gene in stem-like cells from each diseased tissue sample relative to stem-like cells in normal samples in each tissue plotted against the malignancy continuum. Samples are colored based on if they are from different disease stage.AK: Actinic keratosis
cSCC: Cutaneous squamous cell carcinoma
SCCIS:squamous cell carcinoma in situ
ThyroidThe image shows the transcriptomic changes along malignancy continuum.log2FC in expression of this searched gene in stem-like cells from each diseased tissue sample relative to stem-like cells in normal samples in each tissue plotted against the malignancy continuum. Samples are colored based on if they are from different disease stage.
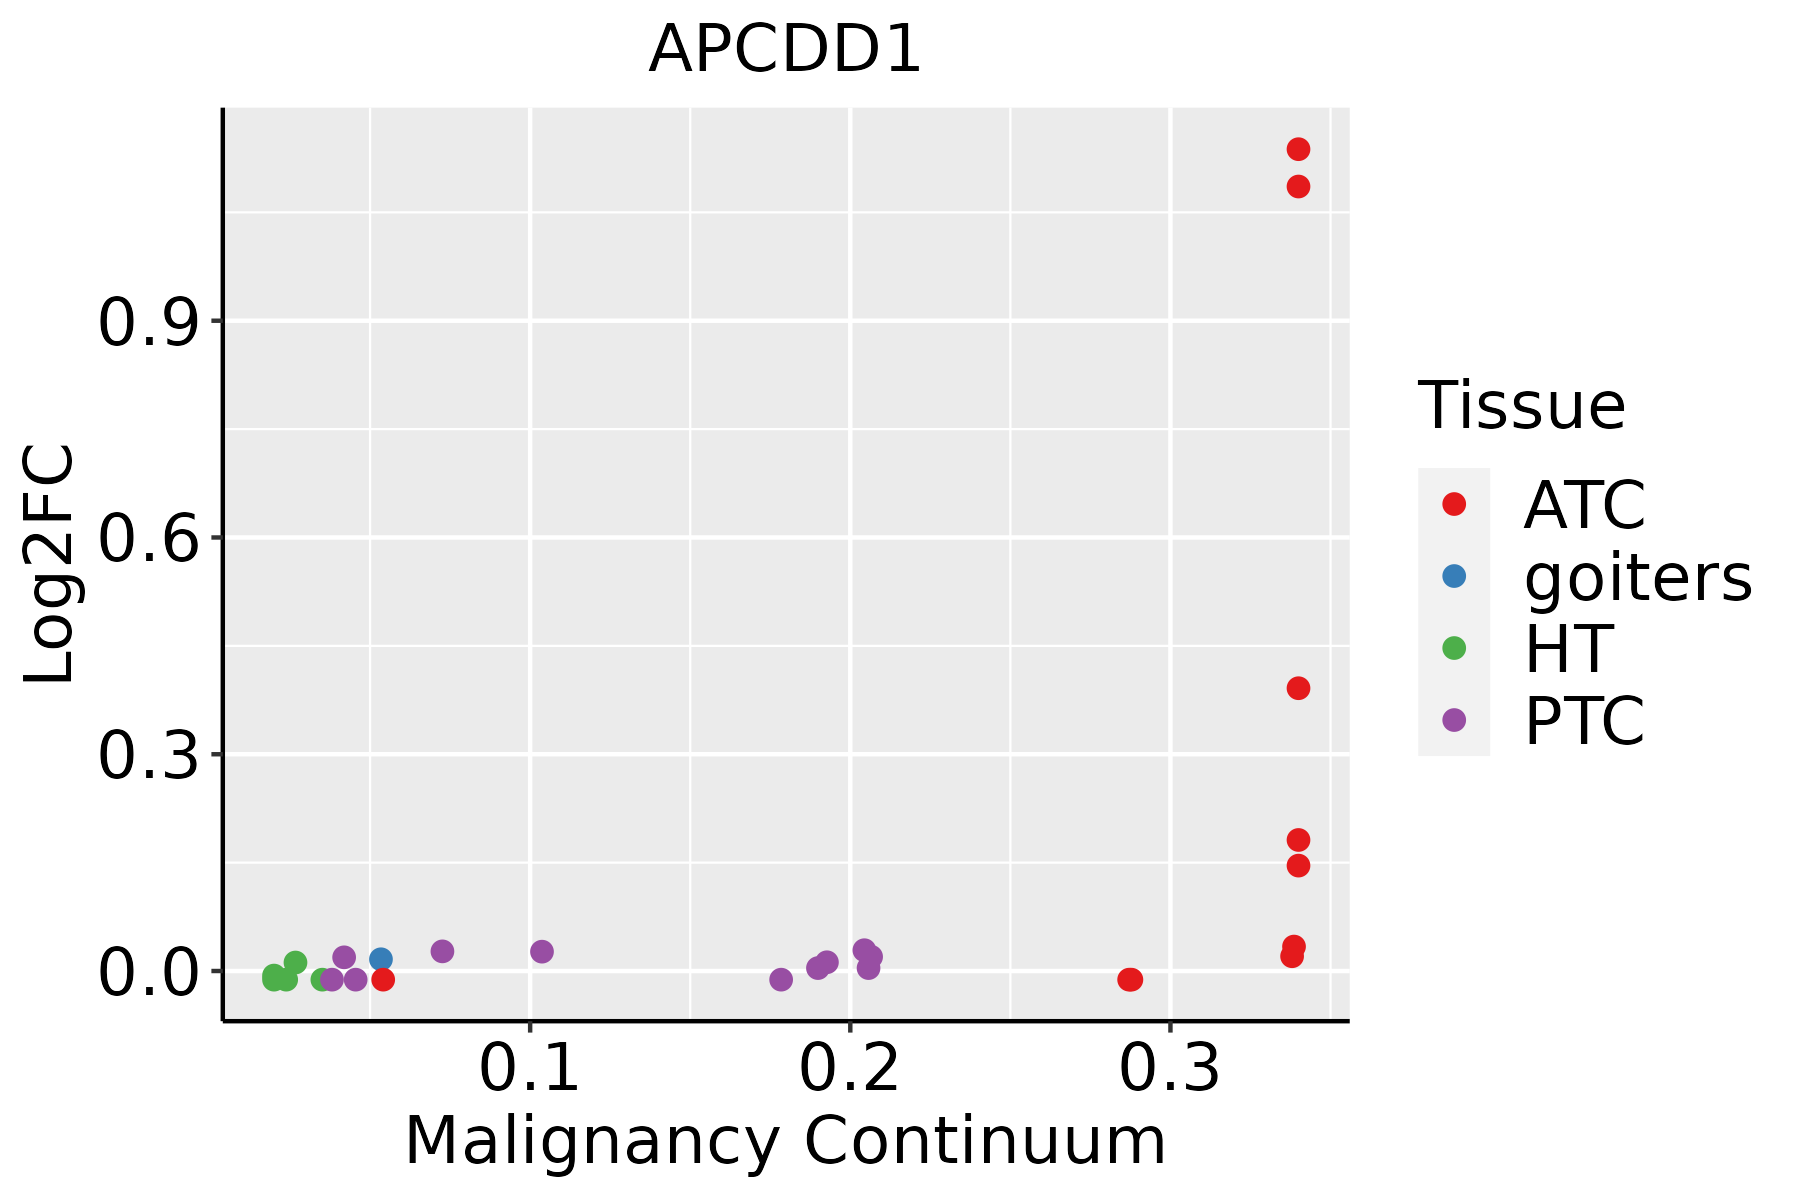
ATC: Anaplastic thyroid cancer
HT: Hashimoto's thyroiditis
PTC: Papillary thyroid cancer
∗log2FC in expression of this searched gene in stem-like cells from each diseased tissue sample relative to stem-like cells in normal samples in each tissue plotted against the malignancy continuum. Samples are colored based on if they are from different disease stage.

Top

Malignant transformation related pathway analysis

check buttonFind out the enriched GO biological processes and KEGG pathways involved in transition from healthy to precancer to cancer
check button Figure of enriched GO biological processes.
TissueDisease StageEnriched GO biological Processes
ColorectumADGO analysis - Figure of enriched GO biological processes: Top 15 enriched GO BP terms are showed in the bar plot of each disease state in each tissue. Each row represents a significant GO biological process which is colored according to the -log10(p.adjust).
ColorectumSERGO analysis - Figure of enriched GO biological processes: Top 15 enriched GO BP terms are showed in the bar plot of each disease state in each tissue. Each row represents a significant GO biological process which is colored according to the -log10(p.adjust).
ColorectumMSSGO analysis - Figure of enriched GO biological processes: Top 15 enriched GO BP terms are showed in the bar plot of each disease state in each tissue. Each row represents a significant GO biological process which is colored according to the -log10(p.adjust).
ColorectumMSI-HGO analysis - Figure of enriched GO biological processes: Top 15 enriched GO BP terms are showed in the bar plot of each disease state in each tissue. Each row represents a significant GO biological process which is colored according to the -log10(p.adjust).
ColorectumFAPGO analysis - Figure of enriched GO biological processes: Top 15 enriched GO BP terms are showed in the bar plot of each disease state in each tissue. Each row represents a significant GO biological process which is colored according to the -log10(p.adjust).
∗Top 15 enriched GO BP terms are showed in the bar plot of each disease state in each tissue. Each row represents a significant GO biological process which is colored according to the -log10(p.adjust).
Page: 1 2 3 4 5 6 7 8 9 

check button Enriched GO biological processes.
GO IDTissueDisease StageDescriptionGene RatioBg Ratiopvaluep.adjustCount
GO:0030111ColorectumADregulation of Wnt signaling pathway102/3918328/187238.51e-062.03e-04102
GO:0016055ColorectumADWnt signaling pathway130/3918444/187231.60e-053.37e-04130
GO:0198738ColorectumADcell-cell signaling by wnt130/3918446/187232.02e-054.10e-04130
GO:0008544ColorectumADepidermis development87/3918324/187235.99e-033.76e-0287
GO:00301112ColorectumMSSregulation of Wnt signaling pathway98/3467328/187233.37e-071.36e-0598
GO:00160552ColorectumMSSWnt signaling pathway124/3467444/187236.06e-072.26e-05124
GO:01987382ColorectumMSScell-cell signaling by wnt124/3467446/187237.83e-072.77e-05124
GO:0030178ColorectumMSSnegative regulation of Wnt signaling pathway48/3467170/187231.23e-031.18e-0248
GO:00160553ColorectumFAPWnt signaling pathway104/2622444/187234.92e-083.92e-06104
GO:01987383ColorectumFAPcell-cell signaling by wnt104/2622446/187236.26e-084.54e-06104
GO:00301113ColorectumFAPregulation of Wnt signaling pathway81/2622328/187231.44e-079.03e-0681
GO:0043588ColorectumFAPskin development58/2622263/187232.44e-043.39e-0358
GO:00085441ColorectumFAPepidermis development66/2622324/187239.63e-049.51e-0366
GO:00301781ColorectumFAPnegative regulation of Wnt signaling pathway38/2622170/187232.06e-031.70e-0238
GO:0022404ColorectumFAPmolting cycle process21/262284/187235.10e-033.37e-0221
GO:0022405ColorectumFAPhair cycle process21/262284/187235.10e-033.37e-0221
GO:00160554ColorectumCRCWnt signaling pathway88/2078444/187233.91e-085.28e-0688
GO:01987384ColorectumCRCcell-cell signaling by wnt88/2078446/187234.85e-086.04e-0688
GO:00301114ColorectumCRCregulation of Wnt signaling pathway68/2078328/187232.41e-072.27e-0568
GO:00085442ColorectumCRCepidermis development57/2078324/187232.88e-044.59e-0357
Page: 1 2 3 4 5 

check button Enriched KEGG pathways.
Pathway IDTissueDisease StageDescriptionGene RatioBg Ratiopvaluep.adjustqvalueCount
Page: 1 

Top

Cell-cell communication analysis

check buttonIdentification of potential cell-cell interactions between two cell types and their ligand-receptor pairs for different disease states
LigandReceptorLRpairPathwayTissueDisease Stage
Page: 1 

Top

Single-cell gene regulatory network inference analysis

check buttonFind out the significant the regulons (TFs) and the target genes of each regulon across cell types for different disease states
TFCell TypeTissueDisease StageTarget GeneRSSRegulon Activity
∗The dot plots of a searched regulon are shown for all cell subpopulations in each disease state of each tissue based on the regulon specific score inferred using pySCENIC and by calculating the average expression.
Page: 1 

Top

Somatic mutation of malignant transformation related genes

check buttonAnnotation of somatic variants for genes involved in malignant transformation
Hugo SymbolVariant ClassVariant ClassificationdbSNP RSHGVScHGVSpHGVSp ShortSWISSPROTBIOTYPESIFTPolyPhenTumor Sample BarcodeTissueHistologySexAgeStageTherapy TypesDrugsOutcome
APCDD1SNVMissense_Mutationrs746711951c.638N>Ap.Arg213Glnp.R213QQ8J025protein_codingdeleterious(0)probably_damaging(0.993)TCGA-A2-A0YJ-01Breastbreast invasive carcinomaFemale<65III/IVChemotherapycytoxanPD
APCDD1SNVMissense_Mutationc.1127N>Ap.Ala376Glup.A376EQ8J025protein_codingtolerated(1)benign(0.028)TCGA-A2-A25D-01Breastbreast invasive carcinomaFemale>=65III/IVHormone TherapytamoxiphenSD
APCDD1SNVMissense_Mutationc.265N>Cp.Glu89Glnp.E89QQ8J025protein_codingdeleterious(0.04)possibly_damaging(0.747)TCGA-D8-A1JA-01Breastbreast invasive carcinomaFemale<65III/IVChemotherapyadriamycinPD
APCDD1SNVMissense_Mutationc.165G>Tp.Met55Ilep.M55IQ8J025protein_codingtolerated(0.14)possibly_damaging(0.62)TCGA-D8-A1XQ-01Breastbreast invasive carcinomaFemale>=65I/IIUnknownUnknownSD
APCDD1insertionIn_Frame_Insnovelc.906_907insTCCACATCACACCTGAAATGTTTGCGTAGGTCTGTACTGTCAGGCAAAp.Val302_Arg303insSerThrSerHisLeuLysCysLeuArgArgSerValLeuSerGlyLysp.V302_R303insSTSHLKCLRRSVLSGKQ8J025protein_codingTCGA-AR-A0TY-01Breastbreast invasive carcinomaFemale<65I/IIUnspecificPaclitaxelPD
APCDD1deletionFrame_Shift_Delnovelc.1515delNp.Pro506LeufsTer62p.P506Lfs*62Q8J025protein_codingTCGA-D8-A27V-01Breastbreast invasive carcinomaFemale<65I/IIHormone TherapytamoxiphenSD
APCDD1SNVMissense_Mutationrs758081145c.1300N>Tp.Arg434Cysp.R434CQ8J025protein_codingdeleterious(0)probably_damaging(0.944)TCGA-A6-5665-01Colorectumcolon adenocarcinomaFemale>=65I/IIUnknownUnknownPD
APCDD1SNVMissense_Mutationrs374082304c.908N>Ap.Arg303Hisp.R303HQ8J025protein_codingdeleterious(0.01)possibly_damaging(0.736)TCGA-AA-3821-01Colorectumcolon adenocarcinomaFemale>=65I/IIUnknownUnknownSD
APCDD1SNVMissense_Mutationrs758870123c.932N>Ap.Arg311Hisp.R311HQ8J025protein_codingdeleterious(0)probably_damaging(1)TCGA-AA-3952-01Colorectumcolon adenocarcinomaMale>=65III/IVUnknownUnknownPD
APCDD1SNVMissense_Mutationrs149564774c.120N>Tp.Glu40Aspp.E40DQ8J025protein_codingtolerated(0.07)benign(0.011)TCGA-AA-3977-01Colorectumcolon adenocarcinomaMale>=65I/IIUnknownUnknownSD
Page: 1 2 3 4 5 6 

Top

Related drugs of malignant transformation related genes

check buttonIdentification of chemicals and drugs interact with genes involved in malignant transfromation
(DGIdb 4.0)
Entrez IDSymbolCategoryInteraction TypesDrug Claim NameDrug NamePMIDs
Page: 1