
|
|||||
|
 | |
| |
| |
| |
| |
| |
|
Gene: APC |
Gene summary for APC |
| Gene information | Species | Human | Gene symbol | APC | Gene ID | 324 |
| Gene name | APC regulator of WNT signaling pathway | |
| Gene Alias | BTPS2 | |
| Cytomap | 5q22.2 | |
| Gene Type | protein-coding | GO ID | GO:0000070 | UniProtAcc | P25054 |
Top |
Malignant transformation analysis |
| Identification of the aberrant gene expression in precancerous and cancerous lesions by comparing the gene expression of stem-like cells in diseased tissues with normal stem cells |
| Entrez ID | Symbol | Replicates | Species | Organ | Tissue | Adj P-value | Log2FC | Malignancy |
| 324 | APC | LZE2T | Human | Esophagus | ESCC | 3.53e-10 | 7.05e-01 | 0.082 |
| 324 | APC | LZE4T | Human | Esophagus | ESCC | 1.67e-11 | 3.30e-01 | 0.0811 |
| 324 | APC | LZE7T | Human | Esophagus | ESCC | 2.63e-02 | 2.34e-01 | 0.0667 |
| 324 | APC | LZE8T | Human | Esophagus | ESCC | 1.81e-03 | 1.24e-01 | 0.067 |
| 324 | APC | LZE24T | Human | Esophagus | ESCC | 5.77e-10 | 3.29e-01 | 0.0596 |
| 324 | APC | P1T-E | Human | Esophagus | ESCC | 1.28e-04 | 2.99e-01 | 0.0875 |
| 324 | APC | P2T-E | Human | Esophagus | ESCC | 8.50e-37 | 5.69e-01 | 0.1177 |
| 324 | APC | P4T-E | Human | Esophagus | ESCC | 7.78e-15 | 3.72e-01 | 0.1323 |
| 324 | APC | P5T-E | Human | Esophagus | ESCC | 7.73e-09 | 1.08e-01 | 0.1327 |
| 324 | APC | P8T-E | Human | Esophagus | ESCC | 4.33e-17 | 3.01e-01 | 0.0889 |
| 324 | APC | P9T-E | Human | Esophagus | ESCC | 1.49e-05 | 1.83e-01 | 0.1131 |
| 324 | APC | P10T-E | Human | Esophagus | ESCC | 9.88e-17 | 3.59e-01 | 0.116 |
| 324 | APC | P11T-E | Human | Esophagus | ESCC | 1.67e-05 | 2.62e-01 | 0.1426 |
| 324 | APC | P12T-E | Human | Esophagus | ESCC | 5.75e-22 | 4.89e-01 | 0.1122 |
| 324 | APC | P15T-E | Human | Esophagus | ESCC | 4.38e-39 | 8.27e-01 | 0.1149 |
| 324 | APC | P16T-E | Human | Esophagus | ESCC | 5.19e-06 | 1.07e-01 | 0.1153 |
| 324 | APC | P17T-E | Human | Esophagus | ESCC | 4.10e-08 | 3.83e-01 | 0.1278 |
| 324 | APC | P19T-E | Human | Esophagus | ESCC | 6.30e-04 | 3.13e-01 | 0.1662 |
| 324 | APC | P20T-E | Human | Esophagus | ESCC | 6.01e-14 | 3.47e-01 | 0.1124 |
| 324 | APC | P21T-E | Human | Esophagus | ESCC | 1.05e-05 | 1.87e-01 | 0.1617 |
| Page: 1 2 3 4 5 6 |
| Tissue | Expression Dynamics | Abbreviation |
| Esophagus | 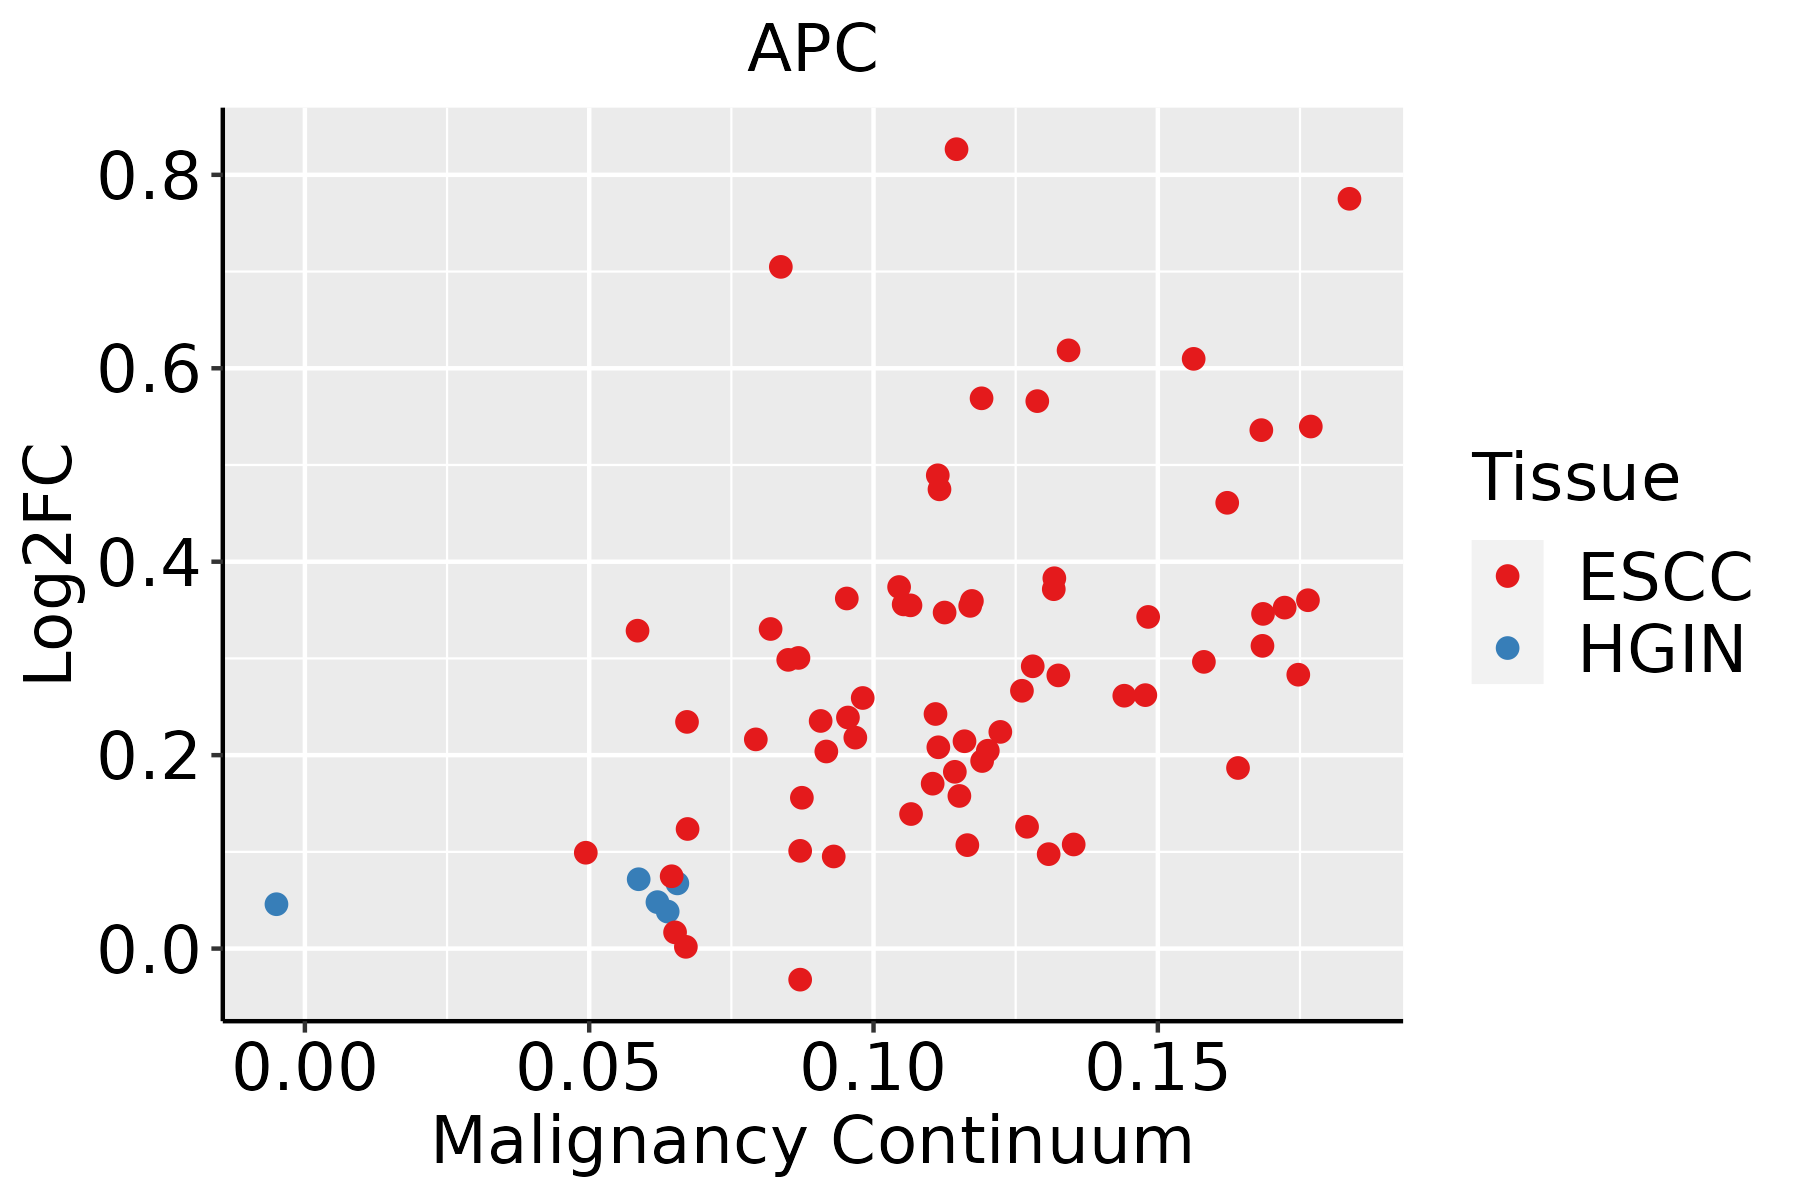 | ESCC: Esophageal squamous cell carcinoma |
| HGIN: High-grade intraepithelial neoplasias | ||
| LGIN: Low-grade intraepithelial neoplasias | ||
| Liver | 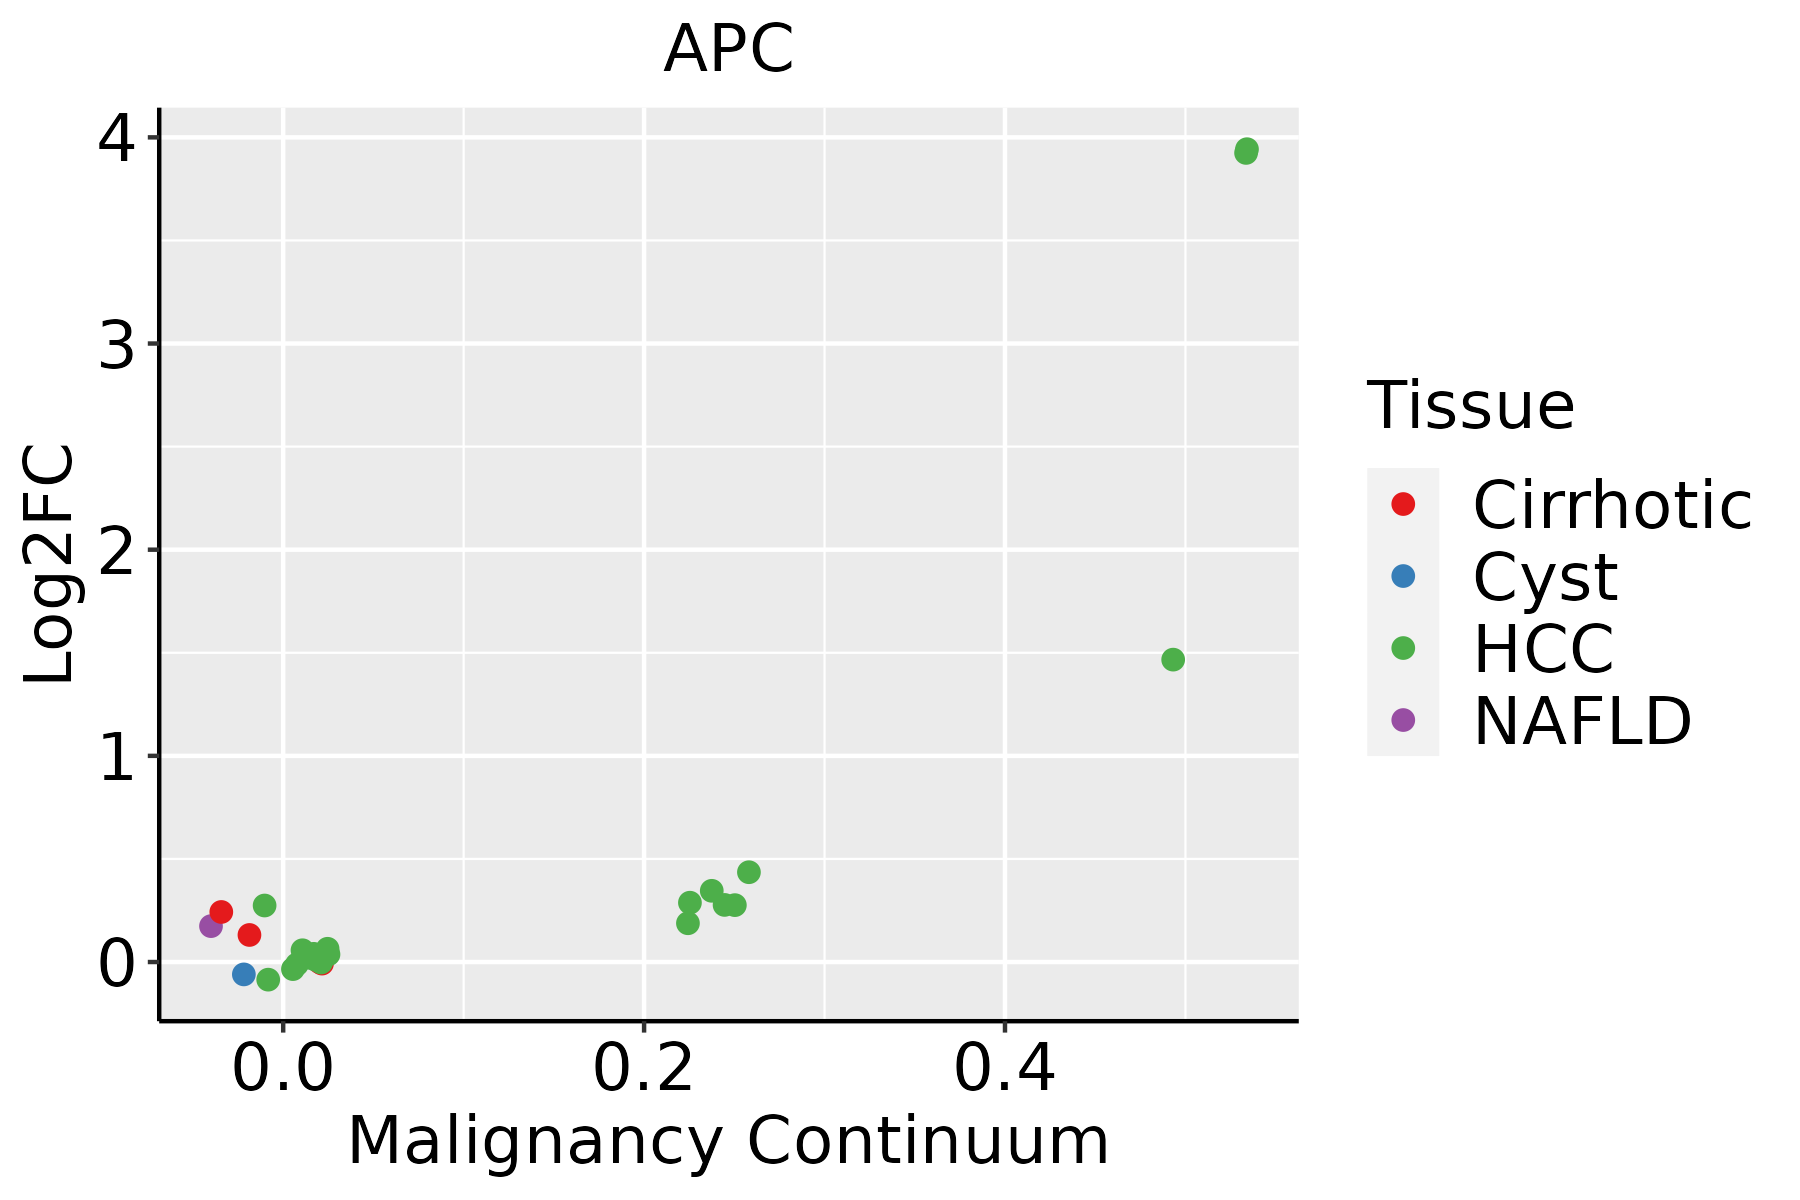 | HCC: Hepatocellular carcinoma |
| NAFLD: Non-alcoholic fatty liver disease | ||
| Prostate |  | BPH: Benign Prostatic Hyperplasia |
| Skin |  | AK: Actinic keratosis |
| cSCC: Cutaneous squamous cell carcinoma | ||
| SCCIS:squamous cell carcinoma in situ | ||
| Thyroid | 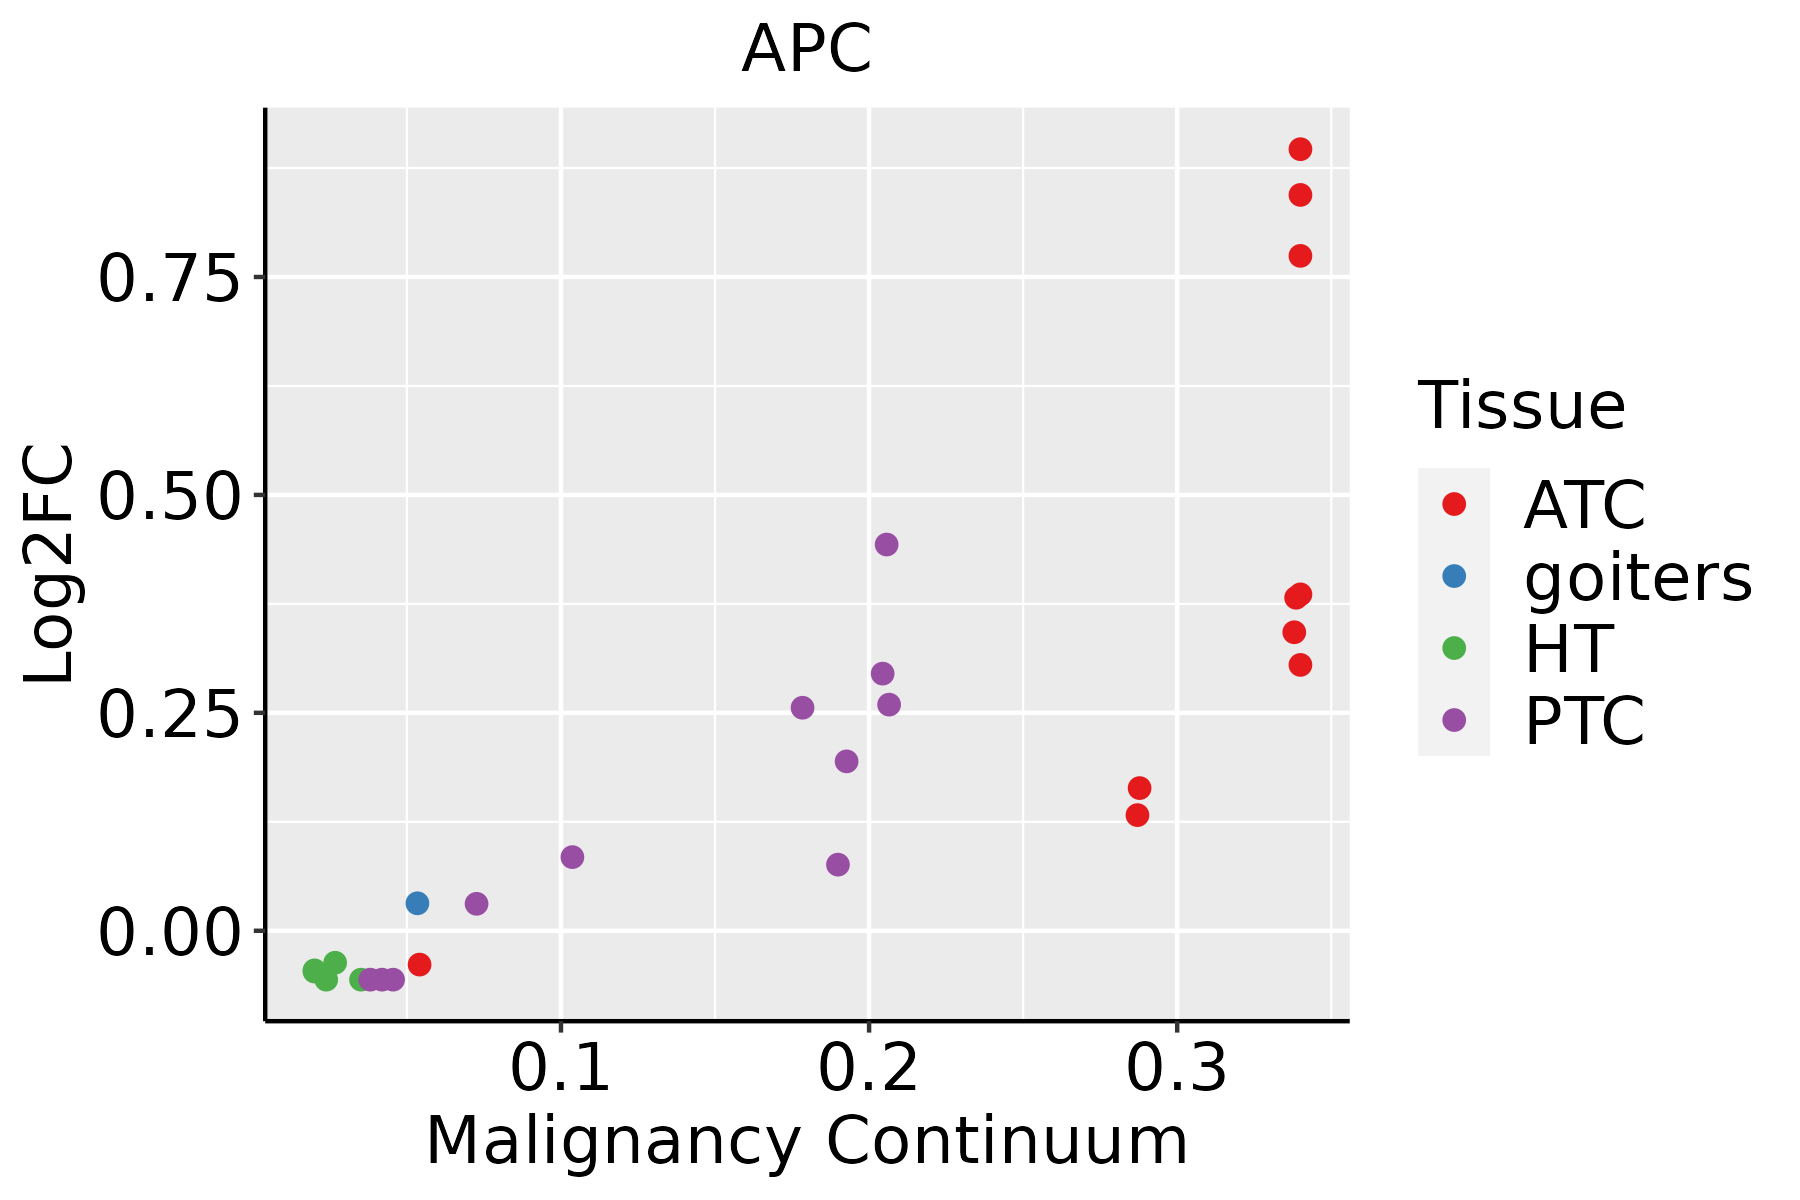 | ATC: Anaplastic thyroid cancer |
| HT: Hashimoto's thyroiditis | ||
| PTC: Papillary thyroid cancer |
| ∗log2FC in expression of this searched gene in stem-like cells from each diseased tissue sample relative to stem-like cells in normal samples in each tissue plotted against the malignancy continuum. Samples are colored based on if they are from different disease stage. |
Top |
Malignant transformation related pathway analysis |
| Find out the enriched GO biological processes and KEGG pathways involved in transition from healthy to precancer to cancer |
| Tissue | Disease Stage | Enriched GO biological Processes |
| Colorectum | AD |  |
| Colorectum | SER |  |
| Colorectum | MSS |  |
| Colorectum | MSI-H |  |
| Colorectum | FAP |  |
| ∗Top 15 enriched GO BP terms are showed in the bar plot of each disease state in each tissue. Each row represents a significant GO biological process which is colored according to the -log10(p.adjust). |
| Page: 1 2 3 4 5 6 7 8 9 |
| GO ID | Tissue | Disease Stage | Description | Gene Ratio | Bg Ratio | pvalue | p.adjust | Count |
| GO:00104989 | Breast | Precancer | proteasomal protein catabolic process | 58/1080 | 490/18723 | 1.54e-07 | 8.05e-06 | 58 |
| GO:00431619 | Breast | Precancer | proteasome-mediated ubiquitin-dependent protein catabolic process | 42/1080 | 412/18723 | 2.49e-04 | 3.72e-03 | 42 |
| GO:001049814 | Breast | IDC | proteasomal protein catabolic process | 75/1434 | 490/18723 | 5.59e-09 | 4.41e-07 | 75 |
| GO:004316114 | Breast | IDC | proteasome-mediated ubiquitin-dependent protein catabolic process | 57/1434 | 412/18723 | 9.55e-06 | 2.68e-04 | 57 |
| GO:00330445 | Breast | IDC | regulation of chromosome organization | 26/1434 | 187/18723 | 2.22e-03 | 2.06e-02 | 26 |
| GO:00073465 | Breast | IDC | regulation of mitotic cell cycle | 51/1434 | 457/18723 | 4.30e-03 | 3.35e-02 | 51 |
| GO:00459315 | Breast | IDC | positive regulation of mitotic cell cycle | 18/1434 | 121/18723 | 4.90e-03 | 3.73e-02 | 18 |
| GO:001049824 | Breast | DCIS | proteasomal protein catabolic process | 75/1390 | 490/18723 | 1.44e-09 | 1.40e-07 | 75 |
| GO:004316124 | Breast | DCIS | proteasome-mediated ubiquitin-dependent protein catabolic process | 57/1390 | 412/18723 | 3.76e-06 | 1.16e-04 | 57 |
| GO:000734612 | Breast | DCIS | regulation of mitotic cell cycle | 52/1390 | 457/18723 | 1.38e-03 | 1.43e-02 | 52 |
| GO:003304412 | Breast | DCIS | regulation of chromosome organization | 26/1390 | 187/18723 | 1.44e-03 | 1.47e-02 | 26 |
| GO:004593112 | Breast | DCIS | positive regulation of mitotic cell cycle | 19/1390 | 121/18723 | 1.47e-03 | 1.49e-02 | 19 |
| GO:00447724 | Breast | DCIS | mitotic cell cycle phase transition | 46/1390 | 424/18723 | 6.16e-03 | 4.39e-02 | 46 |
| GO:001049810 | Cervix | CC | proteasomal protein catabolic process | 111/2311 | 490/18723 | 8.98e-11 | 1.58e-08 | 111 |
| GO:004316110 | Cervix | CC | proteasome-mediated ubiquitin-dependent protein catabolic process | 91/2311 | 412/18723 | 1.65e-08 | 1.25e-06 | 91 |
| GO:00002097 | Cervix | CC | protein polyubiquitination | 58/2311 | 236/18723 | 1.57e-07 | 7.41e-06 | 58 |
| GO:00447725 | Cervix | CC | mitotic cell cycle phase transition | 89/2311 | 424/18723 | 2.70e-07 | 1.12e-05 | 89 |
| GO:00457876 | Cervix | CC | positive regulation of cell cycle | 66/2311 | 313/18723 | 7.78e-06 | 1.81e-04 | 66 |
| GO:00073466 | Cervix | CC | regulation of mitotic cell cycle | 88/2311 | 457/18723 | 1.26e-05 | 2.60e-04 | 88 |
| GO:19019903 | Cervix | CC | regulation of mitotic cell cycle phase transition | 63/2311 | 299/18723 | 1.27e-05 | 2.60e-04 | 63 |
| Page: 1 2 3 4 5 6 7 8 9 10 11 12 13 14 15 16 17 18 19 20 21 22 23 24 25 26 27 28 29 30 31 32 33 34 35 36 37 38 39 40 41 42 43 44 45 46 47 48 49 50 51 52 53 54 55 56 57 58 59 60 61 62 63 64 65 66 67 |
| Pathway ID | Tissue | Disease Stage | Description | Gene Ratio | Bg Ratio | pvalue | p.adjust | qvalue | Count |
| hsa05010210 | Esophagus | ESCC | Alzheimer disease | 263/4205 | 384/8465 | 1.80e-14 | 5.47e-13 | 2.80e-13 | 263 |
| hsa0521020 | Esophagus | ESCC | Colorectal cancer | 69/4205 | 86/8465 | 4.06e-09 | 4.13e-08 | 2.11e-08 | 69 |
| hsa0516510 | Esophagus | ESCC | Human papillomavirus infection | 215/4205 | 331/8465 | 7.86e-09 | 7.12e-08 | 3.65e-08 | 215 |
| hsa0521320 | Esophagus | ESCC | Endometrial cancer | 45/4205 | 58/8465 | 1.14e-05 | 5.98e-05 | 3.06e-05 | 45 |
| hsa0522518 | Esophagus | ESCC | Hepatocellular carcinoma | 109/4205 | 168/8465 | 4.27e-05 | 1.88e-04 | 9.64e-05 | 109 |
| hsa0481028 | Esophagus | ESCC | Regulation of actin cytoskeleton | 133/4205 | 229/8465 | 5.94e-03 | 1.48e-02 | 7.56e-03 | 133 |
| hsa0439018 | Esophagus | ESCC | Hippo signaling pathway | 92/4205 | 157/8465 | 1.46e-02 | 3.31e-02 | 1.69e-02 | 92 |
| hsa0501038 | Esophagus | ESCC | Alzheimer disease | 263/4205 | 384/8465 | 1.80e-14 | 5.47e-13 | 2.80e-13 | 263 |
| hsa05210110 | Esophagus | ESCC | Colorectal cancer | 69/4205 | 86/8465 | 4.06e-09 | 4.13e-08 | 2.11e-08 | 69 |
| hsa0516515 | Esophagus | ESCC | Human papillomavirus infection | 215/4205 | 331/8465 | 7.86e-09 | 7.12e-08 | 3.65e-08 | 215 |
| hsa05213110 | Esophagus | ESCC | Endometrial cancer | 45/4205 | 58/8465 | 1.14e-05 | 5.98e-05 | 3.06e-05 | 45 |
| hsa0522519 | Esophagus | ESCC | Hepatocellular carcinoma | 109/4205 | 168/8465 | 4.27e-05 | 1.88e-04 | 9.64e-05 | 109 |
| hsa04810112 | Esophagus | ESCC | Regulation of actin cytoskeleton | 133/4205 | 229/8465 | 5.94e-03 | 1.48e-02 | 7.56e-03 | 133 |
| hsa0439019 | Esophagus | ESCC | Hippo signaling pathway | 92/4205 | 157/8465 | 1.46e-02 | 3.31e-02 | 1.69e-02 | 92 |
| hsa0501022 | Liver | HCC | Alzheimer disease | 254/4020 | 384/8465 | 3.75e-14 | 8.97e-13 | 4.99e-13 | 254 |
| hsa0502222 | Liver | HCC | Pathways of neurodegeneration - multiple diseases | 298/4020 | 476/8465 | 6.59e-12 | 1.30e-10 | 7.22e-11 | 298 |
| hsa0521022 | Liver | HCC | Colorectal cancer | 65/4020 | 86/8465 | 8.85e-08 | 1.23e-06 | 6.87e-07 | 65 |
| hsa0521321 | Liver | HCC | Endometrial cancer | 44/4020 | 58/8465 | 9.34e-06 | 7.11e-05 | 3.95e-05 | 44 |
| hsa052258 | Liver | HCC | Hepatocellular carcinoma | 106/4020 | 168/8465 | 2.87e-05 | 1.85e-04 | 1.03e-04 | 106 |
| hsa051652 | Liver | HCC | Human papillomavirus infection | 188/4020 | 331/8465 | 3.34e-04 | 1.49e-03 | 8.29e-04 | 188 |
| Page: 1 2 3 4 |
Top |
Cell-cell communication analysis |
| Identification of potential cell-cell interactions between two cell types and their ligand-receptor pairs for different disease states |
| Ligand | Receptor | LRpair | Pathway | Tissue | Disease Stage |
| Page: 1 |
Top |
Single-cell gene regulatory network inference analysis |
| Find out the significant the regulons (TFs) and the target genes of each regulon across cell types for different disease states |
| TF | Cell Type | Tissue | Disease Stage | Target Gene | RSS | Regulon Activity |
| ∗The dot plots of a searched regulon are shown for all cell subpopulations in each disease state of each tissue based on the regulon specific score inferred using pySCENIC and by calculating the average expression. |
| Page: 1 |
Top |
Somatic mutation of malignant transformation related genes |
| Annotation of somatic variants for genes involved in malignant transformation |
| Hugo Symbol | Variant Class | Variant Classification | dbSNP RS | HGVSc | HGVSp | HGVSp Short | SWISSPROT | BIOTYPE | SIFT | PolyPhen | Tumor Sample Barcode | Tissue | Histology | Sex | Age | Stage | Therapy Types | Drugs | Outcome |
| APC | SNV | Missense_Mutation | novel | c.4157N>A | p.Arg1386Lys | p.R1386K | P25054 | protein_coding | deleterious(0) | probably_damaging(0.992) | TCGA-5L-AAT1-01 | Breast | breast invasive carcinoma | Female | <65 | III/IV | Hormone Therapy | letrozol | SD |
| APC | SNV | Missense_Mutation | rs878853472 | c.7915N>C | p.Glu2639Gln | p.E2639Q | P25054 | protein_coding | tolerated(0.23) | benign(0.094) | TCGA-5L-AAT1-01 | Breast | breast invasive carcinoma | Female | <65 | III/IV | Hormone Therapy | letrozol | SD |
| APC | SNV | Missense_Mutation | novel | c.7912G>T | p.Ala2638Ser | p.A2638S | P25054 | protein_coding | tolerated(0.6) | benign(0.006) | TCGA-A2-A0CM-01 | Breast | breast invasive carcinoma | Female | <65 | I/II | Chemotherapy | adriamycin | PD |
| APC | SNV | Missense_Mutation | c.5176N>C | p.Glu1726Gln | p.E1726Q | P25054 | protein_coding | deleterious_low_confidence(0) | probably_damaging(0.998) | TCGA-AC-A23H-01 | Breast | breast invasive carcinoma | Female | >=65 | I/II | Unknown | Unknown | PD | |
| APC | SNV | Missense_Mutation | c.8449N>C | p.Asp2817His | p.D2817H | P25054 | protein_coding | deleterious_low_confidence(0) | probably_damaging(0.986) | TCGA-AC-A23H-01 | Breast | breast invasive carcinoma | Female | >=65 | I/II | Unknown | Unknown | PD | |
| APC | SNV | Missense_Mutation | c.1225N>A | p.Leu409Ile | p.L409I | P25054 | protein_coding | tolerated(0.07) | benign(0.253) | TCGA-AN-A046-01 | Breast | breast invasive carcinoma | Female | >=65 | I/II | Unknown | Unknown | SD | |
| APC | SNV | Missense_Mutation | c.4097N>T | p.Ala1366Val | p.A1366V | P25054 | protein_coding | tolerated(0.23) | benign(0.021) | TCGA-AN-A046-01 | Breast | breast invasive carcinoma | Female | >=65 | I/II | Unknown | Unknown | SD | |
| APC | SNV | Missense_Mutation | rs267600319 | c.4199N>T | p.Ser1400Leu | p.S1400L | P25054 | protein_coding | deleterious(0) | probably_damaging(0.992) | TCGA-AN-A046-01 | Breast | breast invasive carcinoma | Female | >=65 | I/II | Unknown | Unknown | SD |
| APC | SNV | Missense_Mutation | novel | c.5415N>A | p.Phe1805Leu | p.F1805L | P25054 | protein_coding | tolerated_low_confidence(0.47) | benign(0.01) | TCGA-AN-A046-01 | Breast | breast invasive carcinoma | Female | >=65 | I/II | Unknown | Unknown | SD |
| APC | SNV | Missense_Mutation | novel | c.7295N>T | p.Ser2432Leu | p.S2432L | P25054 | protein_coding | deleterious(0.01) | probably_damaging(0.989) | TCGA-AN-A046-01 | Breast | breast invasive carcinoma | Female | >=65 | I/II | Unknown | Unknown | SD |
| Page: 1 2 3 4 5 6 7 8 9 10 11 12 13 14 15 16 17 18 19 20 21 22 23 24 25 26 27 28 29 30 31 32 33 34 35 36 37 38 39 40 41 42 43 44 45 46 47 48 |
Top |
Related drugs of malignant transformation related genes |
| Identification of chemicals and drugs interact with genes involved in malignant transfromation |
| (DGIdb 4.0) |
| Entrez ID | Symbol | Category | Interaction Types | Drug Claim Name | Drug Name | PMIDs |
| 324 | APC | CLINICALLY ACTIONABLE | K-756 | 27196752 | ||
| 324 | APC | CLINICALLY ACTIONABLE | Ibuprofen | IBUPROFEN | 17909047 | |
| 324 | APC | CLINICALLY ACTIONABLE | Sulindac | SULINDAC | 19755659 | |
| 324 | APC | CLINICALLY ACTIONABLE | NC043 | 21321609 | ||
| 324 | APC | CLINICALLY ACTIONABLE | JW67 | 21199802 | ||
| 324 | APC | CLINICALLY ACTIONABLE | Leucovorin | LEUCOVORIN | 27626067 | |
| 324 | APC | CLINICALLY ACTIONABLE | DIFLUOROMETHYLORNITHINE | 10766173 | ||
| 324 | APC | CLINICALLY ACTIONABLE | Niclosamide | NICLOSAMIDE | 21531761 | |
| 324 | APC | CLINICALLY ACTIONABLE | iCRT-14 | 21393571 | ||
| 324 | APC | CLINICALLY ACTIONABLE | CCT031374 | 20610623 |
| Page: 1 2 3 4 5 |

Copyright 2023-Present -The University of Texas Health Science Center at Houston |