
|
|||||
|
 | |
| |
| |
| |
| |
| |
|
Gene: APBB2 |
Gene summary for APBB2 |
| Gene information | Species | Human | Gene symbol | APBB2 | Gene ID | 323 |
| Gene name | amyloid beta precursor protein binding family B member 2 | |
| Gene Alias | FE65L | |
| Cytomap | 4p14-p13 | |
| Gene Type | protein-coding | GO ID | GO:0000122 | UniProtAcc | B4DJ88 |
Top |
Malignant transformation analysis |
| Identification of the aberrant gene expression in precancerous and cancerous lesions by comparing the gene expression of stem-like cells in diseased tissues with normal stem cells |
| Entrez ID | Symbol | Replicates | Species | Organ | Tissue | Adj P-value | Log2FC | Malignancy |
| 323 | APBB2 | HTA11_5212_2000001011 | Human | Colorectum | AD | 5.39e-04 | -6.89e-01 | -0.2061 |
| 323 | APBB2 | HTA11_5216_2000001011 | Human | Colorectum | SER | 2.84e-03 | -6.15e-01 | -0.1462 |
| 323 | APBB2 | HTA11_7663_2000001011 | Human | Colorectum | SER | 7.07e-03 | 7.22e-01 | 0.0131 |
| 323 | APBB2 | HTA11_7696_3000711011 | Human | Colorectum | AD | 4.04e-04 | 5.09e-01 | 0.0674 |
| 323 | APBB2 | HTA11_99999970781_79442 | Human | Colorectum | MSS | 2.05e-02 | 4.65e-01 | 0.294 |
| 323 | APBB2 | HTA11_99999965062_69753 | Human | Colorectum | MSI-H | 3.04e-10 | 1.15e+00 | 0.3487 |
| 323 | APBB2 | HTA11_99999971662_82457 | Human | Colorectum | MSS | 3.67e-03 | 5.69e-01 | 0.3859 |
| 323 | APBB2 | HTA11_99999973899_84307 | Human | Colorectum | MSS | 1.54e-02 | -5.67e-01 | 0.2585 |
| 323 | APBB2 | HTA11_99999974143_84620 | Human | Colorectum | MSS | 1.17e-06 | 7.02e-01 | 0.3005 |
| 323 | APBB2 | F007 | Human | Colorectum | FAP | 6.71e-03 | -4.80e-02 | 0.1176 |
| 323 | APBB2 | A002-C-010 | Human | Colorectum | FAP | 2.92e-05 | 1.30e-01 | 0.242 |
| 323 | APBB2 | A001-C-207 | Human | Colorectum | FAP | 3.50e-02 | 2.51e-02 | 0.1278 |
| 323 | APBB2 | A015-C-203 | Human | Colorectum | FAP | 9.19e-34 | -3.81e-01 | -0.1294 |
| 323 | APBB2 | A015-C-204 | Human | Colorectum | FAP | 1.12e-04 | -1.25e-01 | -0.0228 |
| 323 | APBB2 | A014-C-040 | Human | Colorectum | FAP | 1.05e-02 | -3.08e-01 | -0.1184 |
| 323 | APBB2 | A002-C-201 | Human | Colorectum | FAP | 8.65e-16 | -3.33e-01 | 0.0324 |
| 323 | APBB2 | A002-C-203 | Human | Colorectum | FAP | 2.76e-02 | -1.39e-01 | 0.2786 |
| 323 | APBB2 | A001-C-119 | Human | Colorectum | FAP | 1.30e-03 | -1.37e-01 | -0.1557 |
| 323 | APBB2 | A001-C-108 | Human | Colorectum | FAP | 5.19e-17 | -2.52e-01 | -0.0272 |
| 323 | APBB2 | A002-C-021 | Human | Colorectum | FAP | 1.17e-02 | 2.63e-01 | 0.1171 |
| Page: 1 2 3 4 5 6 7 8 |
| Tissue | Expression Dynamics | Abbreviation |
| Colorectum (GSE201348) | 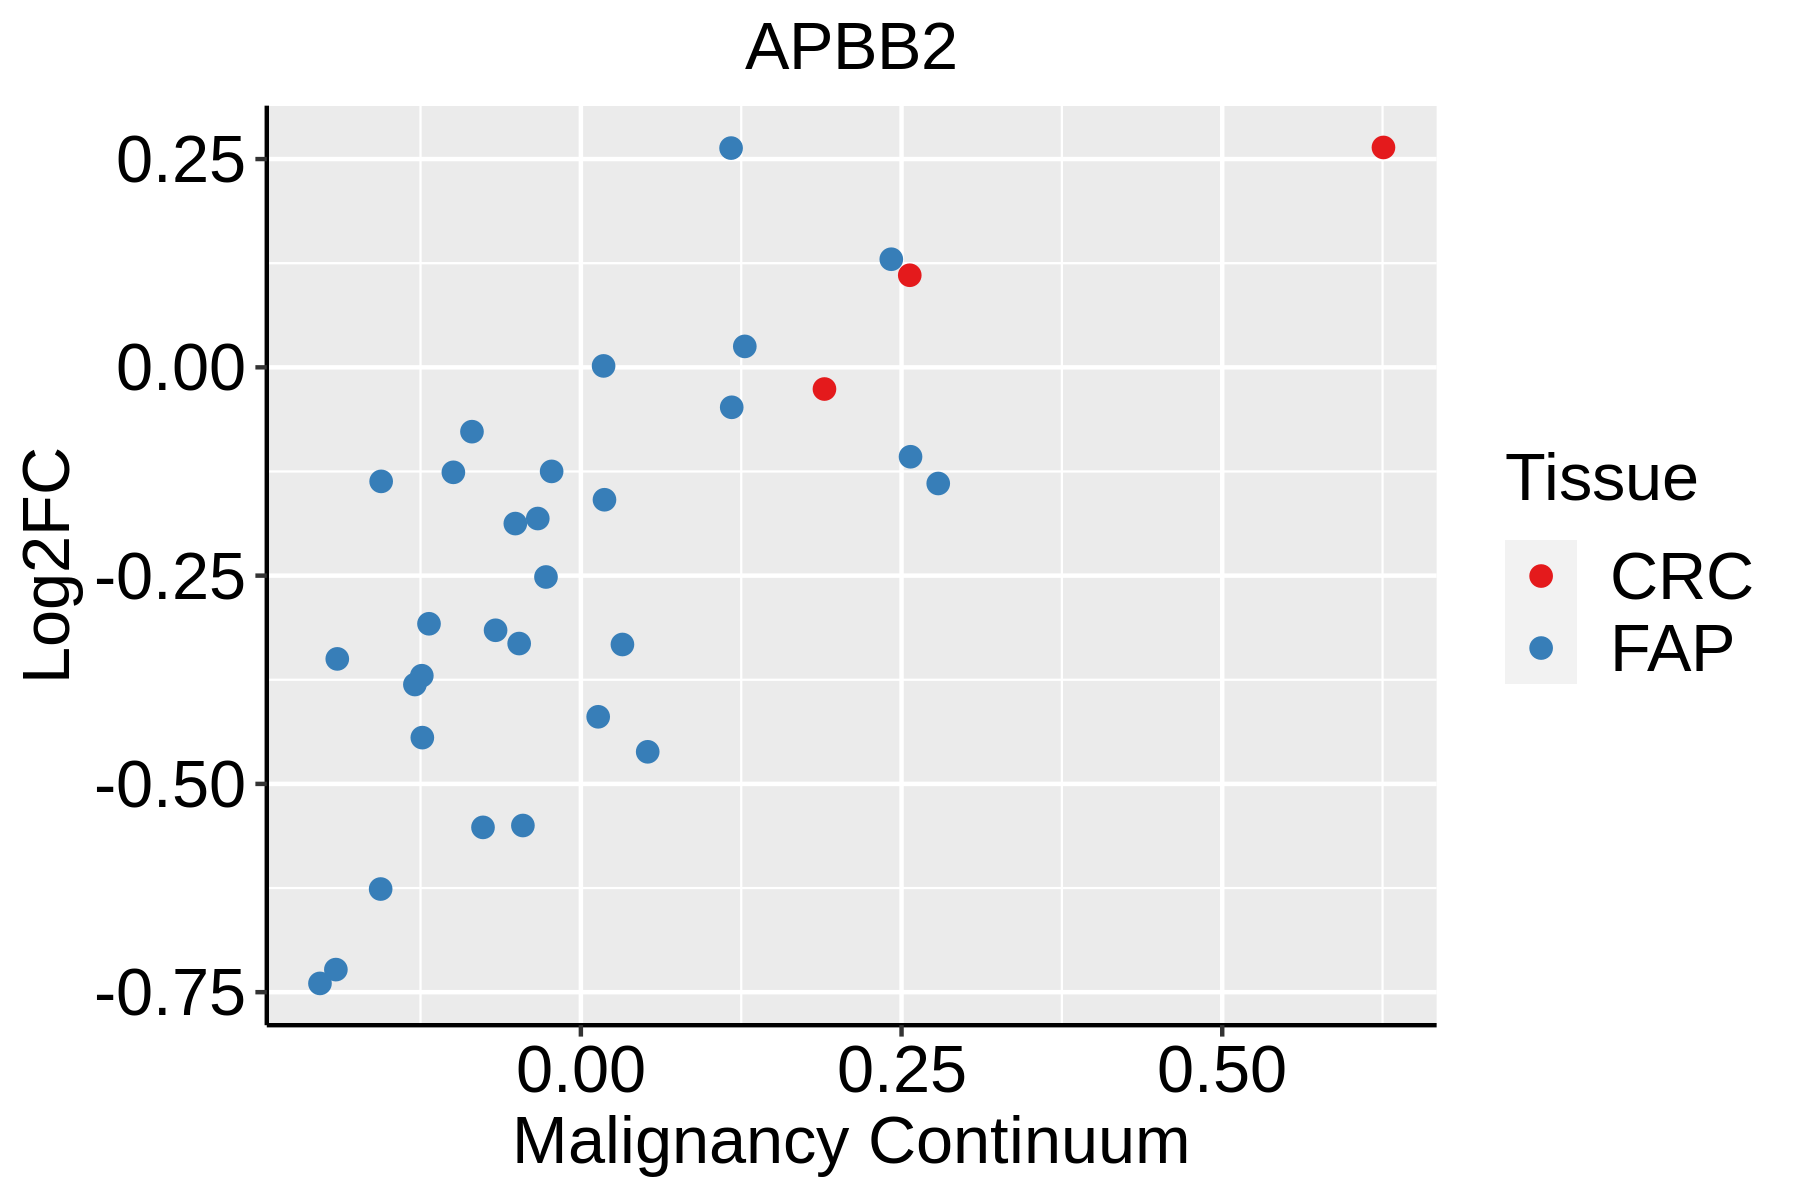 | FAP: Familial adenomatous polyposis |
| CRC: Colorectal cancer | ||
| Colorectum (HTA11) |  | AD: Adenomas |
| SER: Sessile serrated lesions | ||
| MSI-H: Microsatellite-high colorectal cancer | ||
| MSS: Microsatellite stable colorectal cancer | ||
| Endometrium |  | AEH: Atypical endometrial hyperplasia |
| EEC: Endometrioid Cancer | ||
| Esophagus | 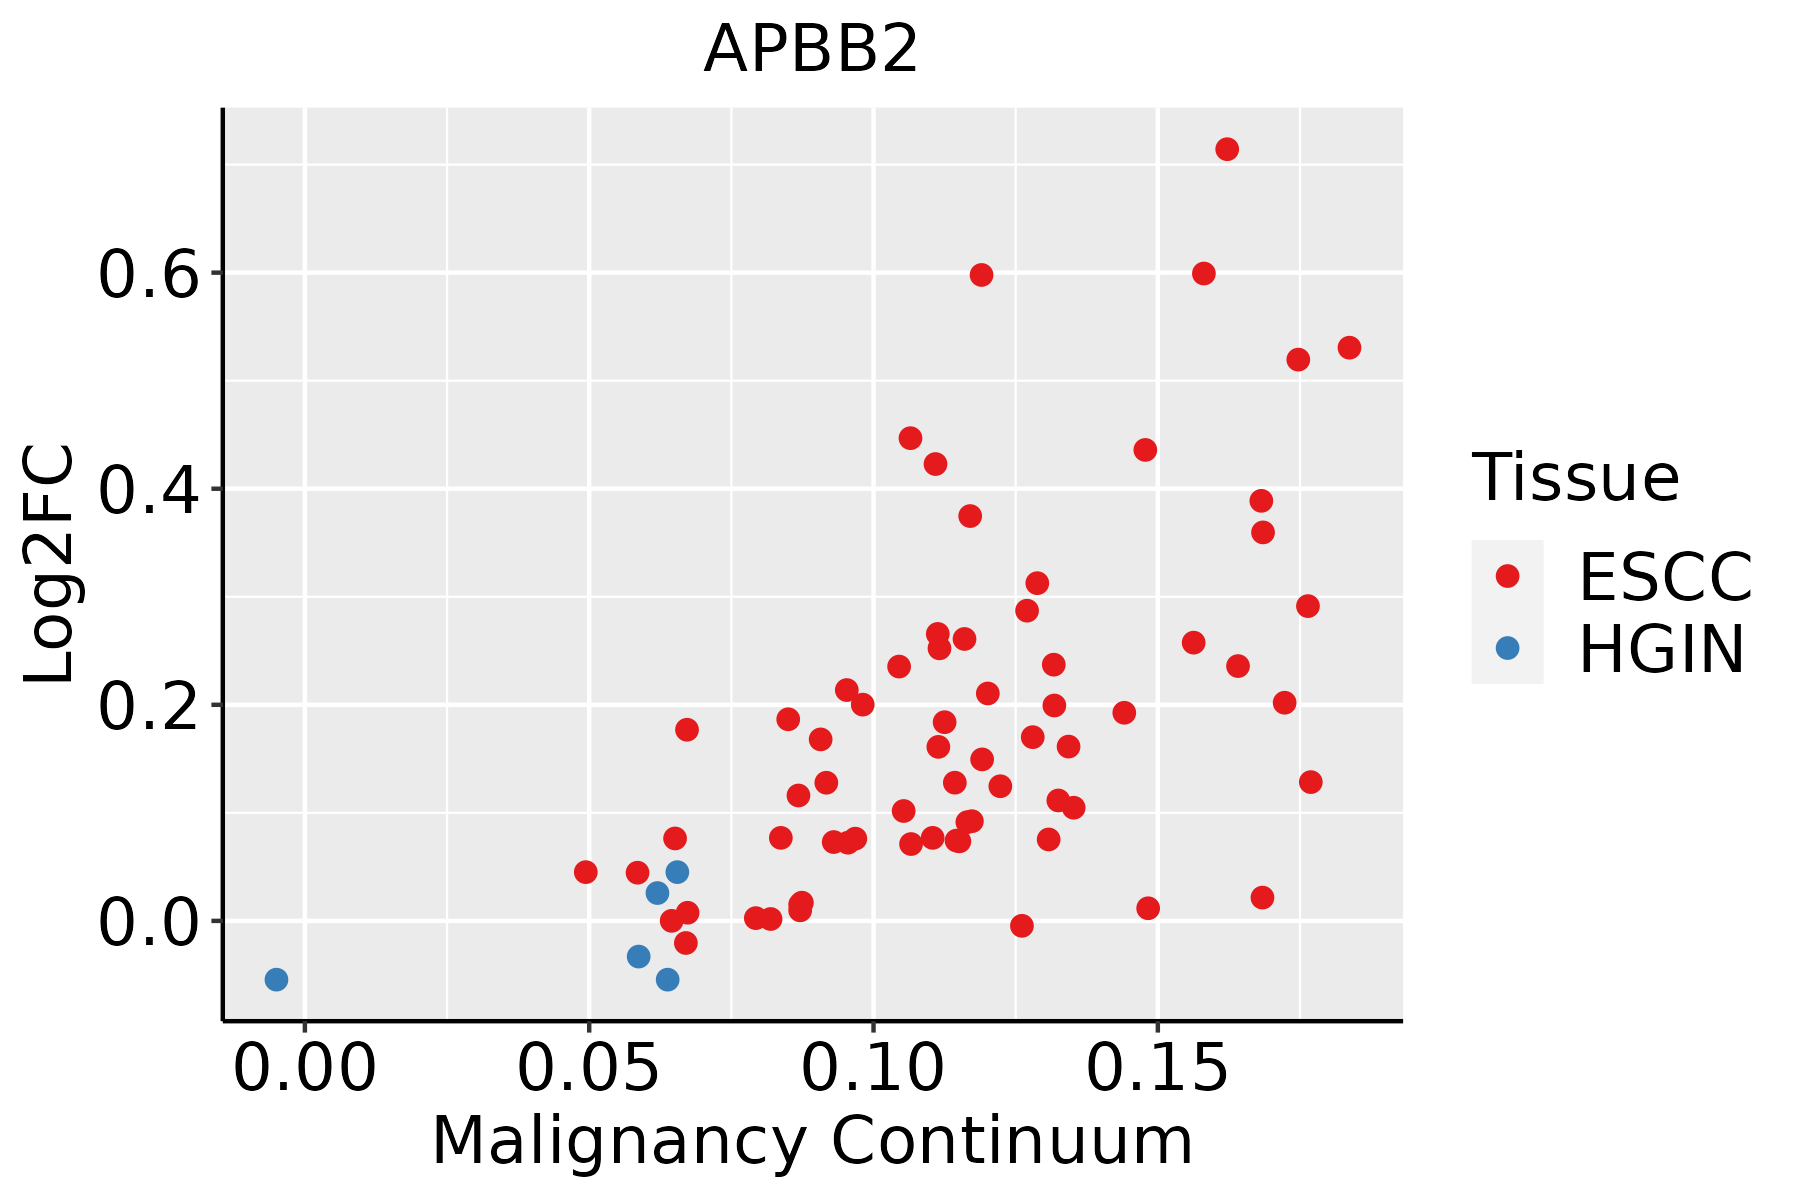 | ESCC: Esophageal squamous cell carcinoma |
| HGIN: High-grade intraepithelial neoplasias | ||
| LGIN: Low-grade intraepithelial neoplasias | ||
| Lung | 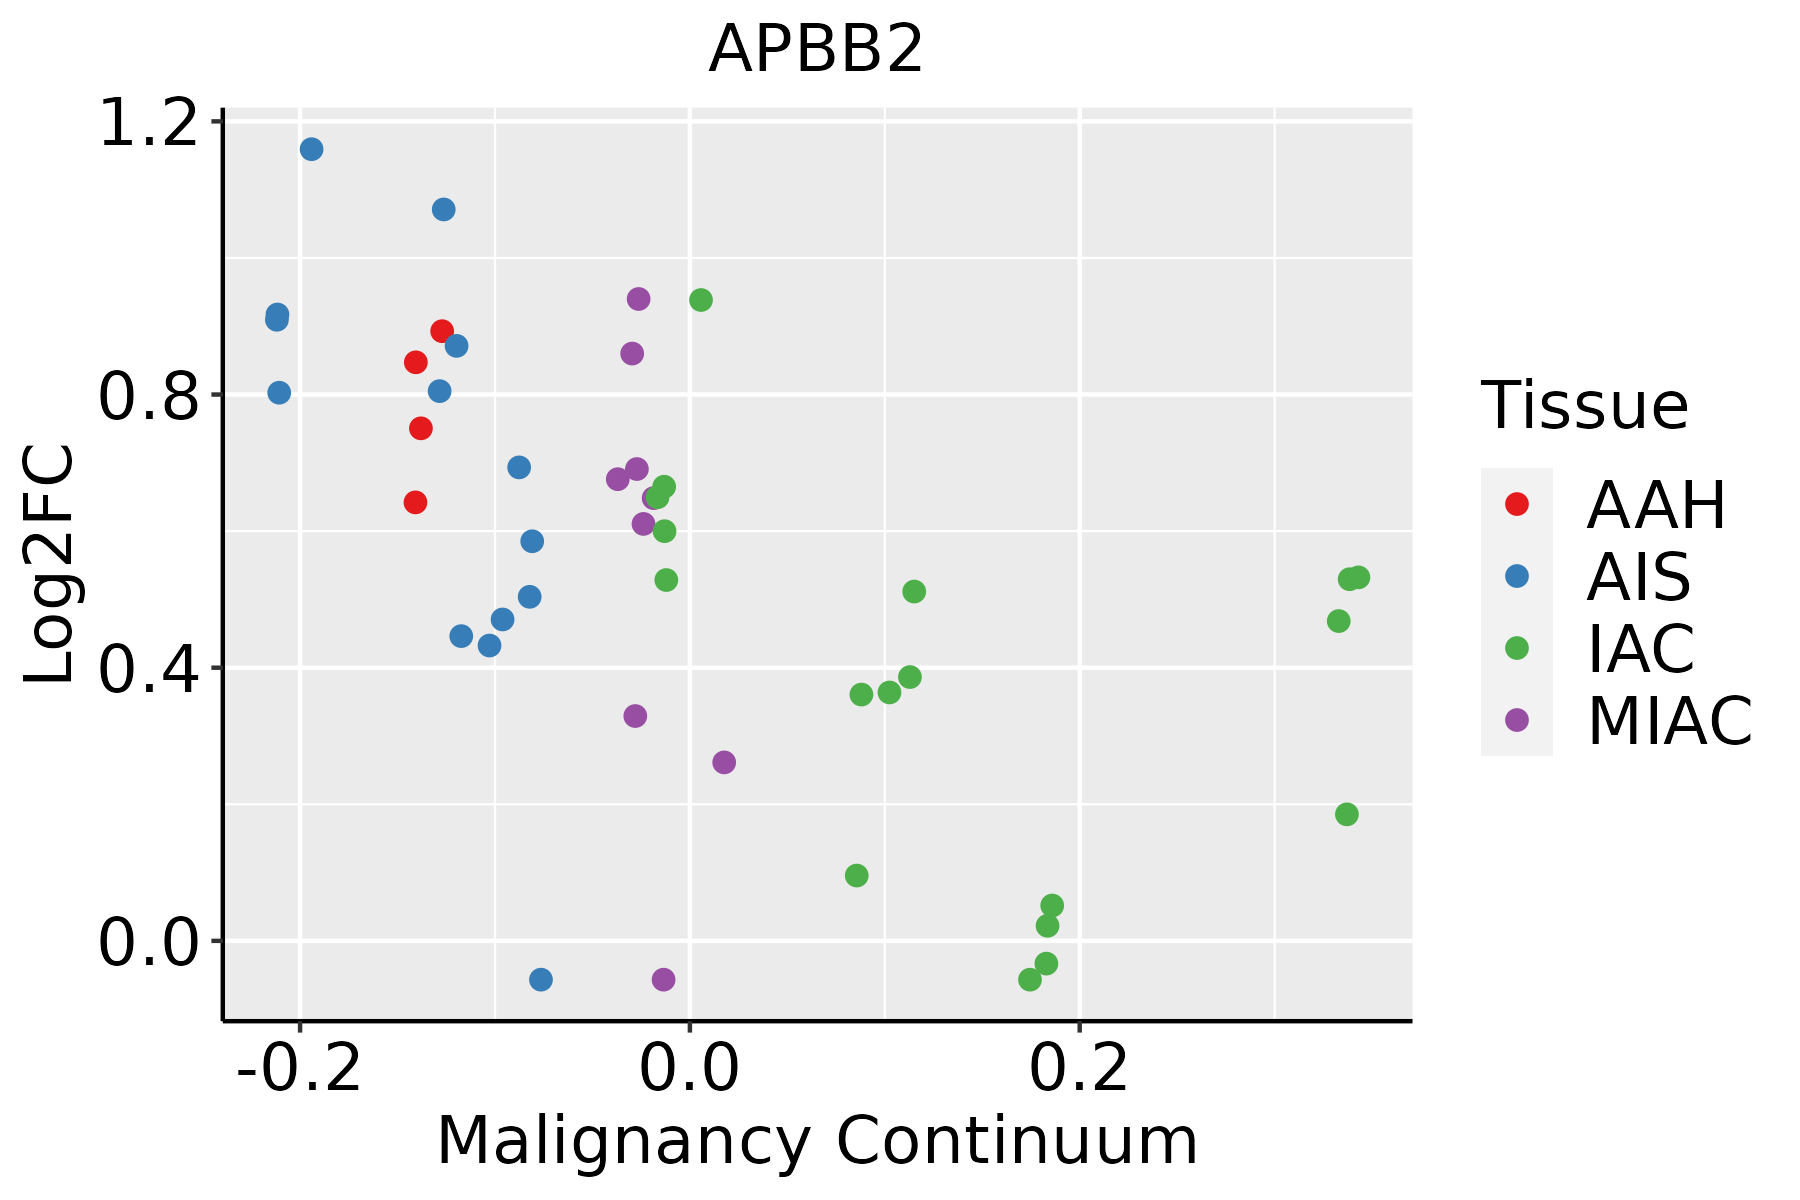 | AAH: Atypical adenomatous hyperplasia |
| AIS: Adenocarcinoma in situ | ||
| IAC: Invasive lung adenocarcinoma | ||
| MIA: Minimally invasive adenocarcinoma | ||
| Oral Cavity | 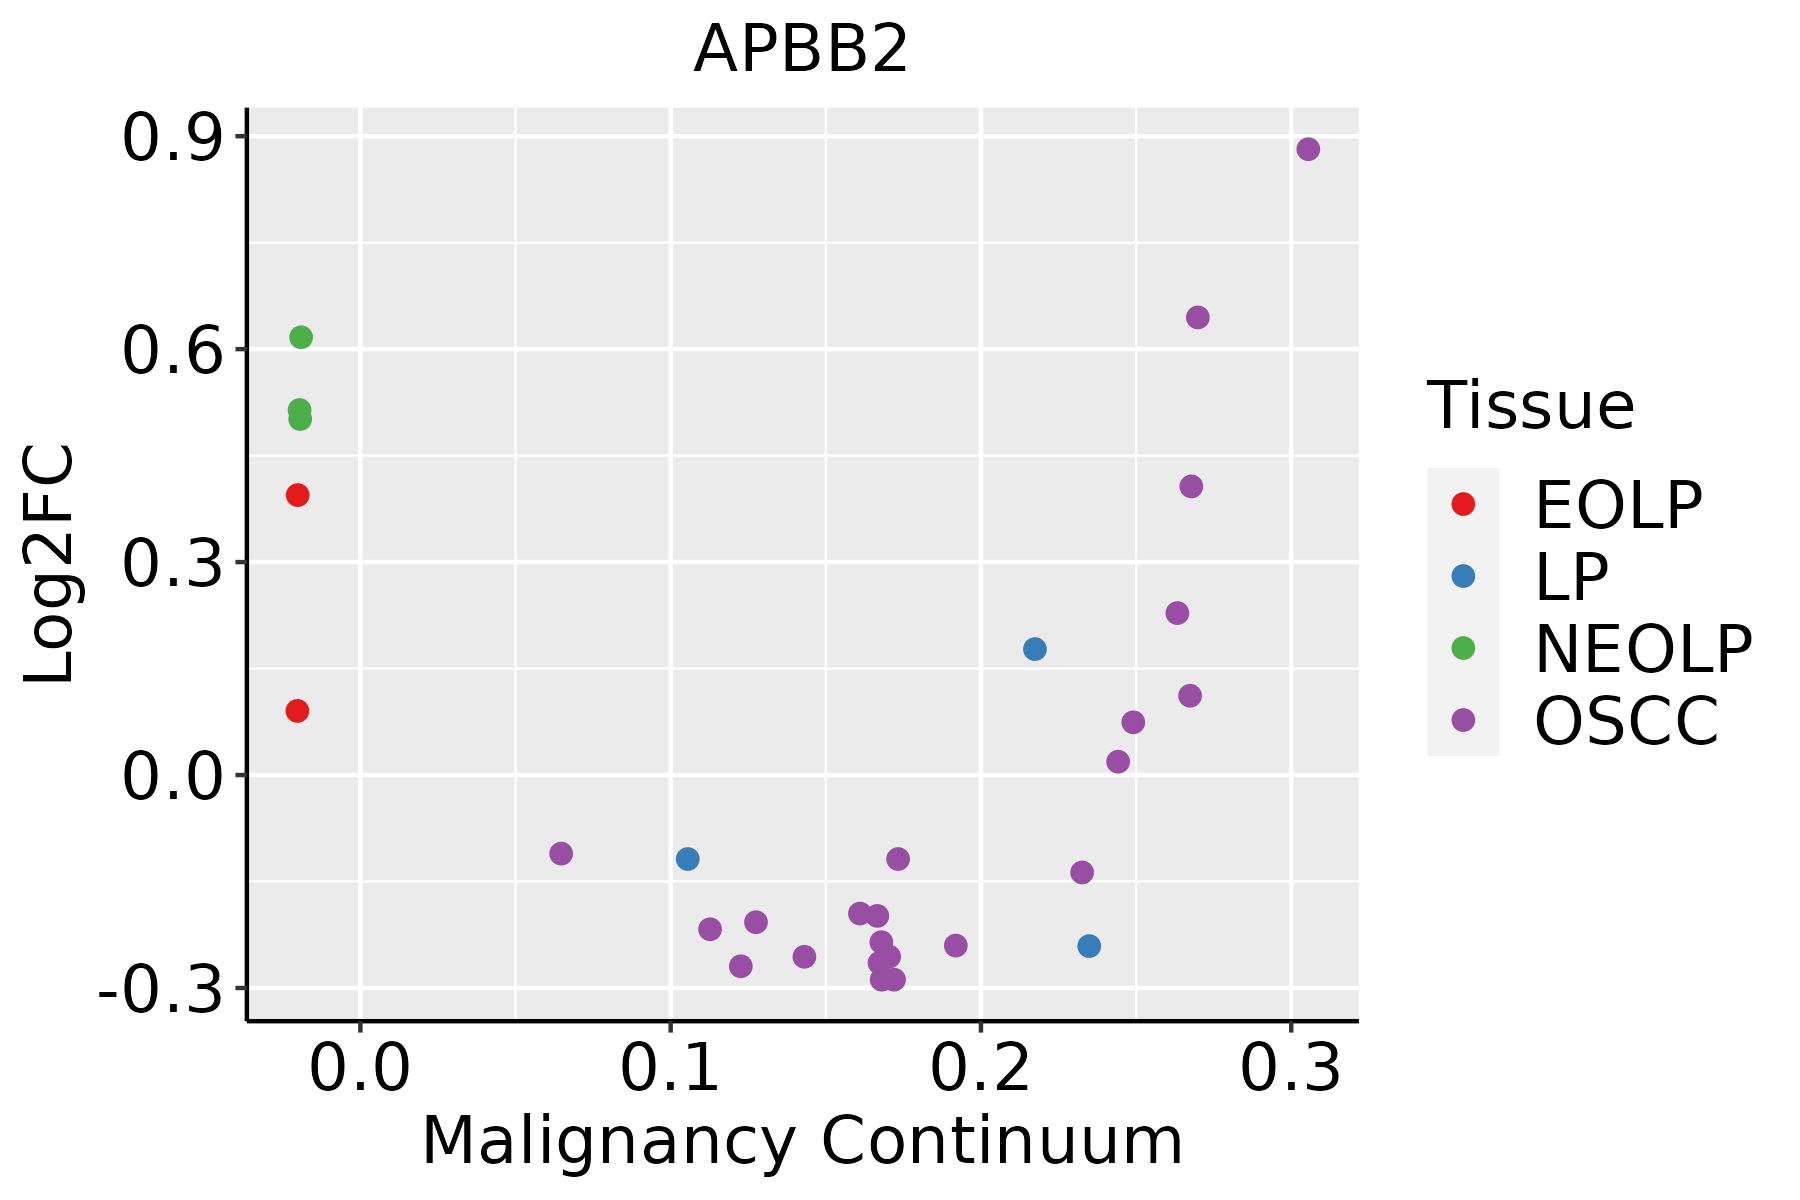 | EOLP: Erosive Oral lichen planus |
| LP: leukoplakia | ||
| NEOLP: Non-erosive oral lichen planus | ||
| OSCC: Oral squamous cell carcinoma | ||
| Skin | 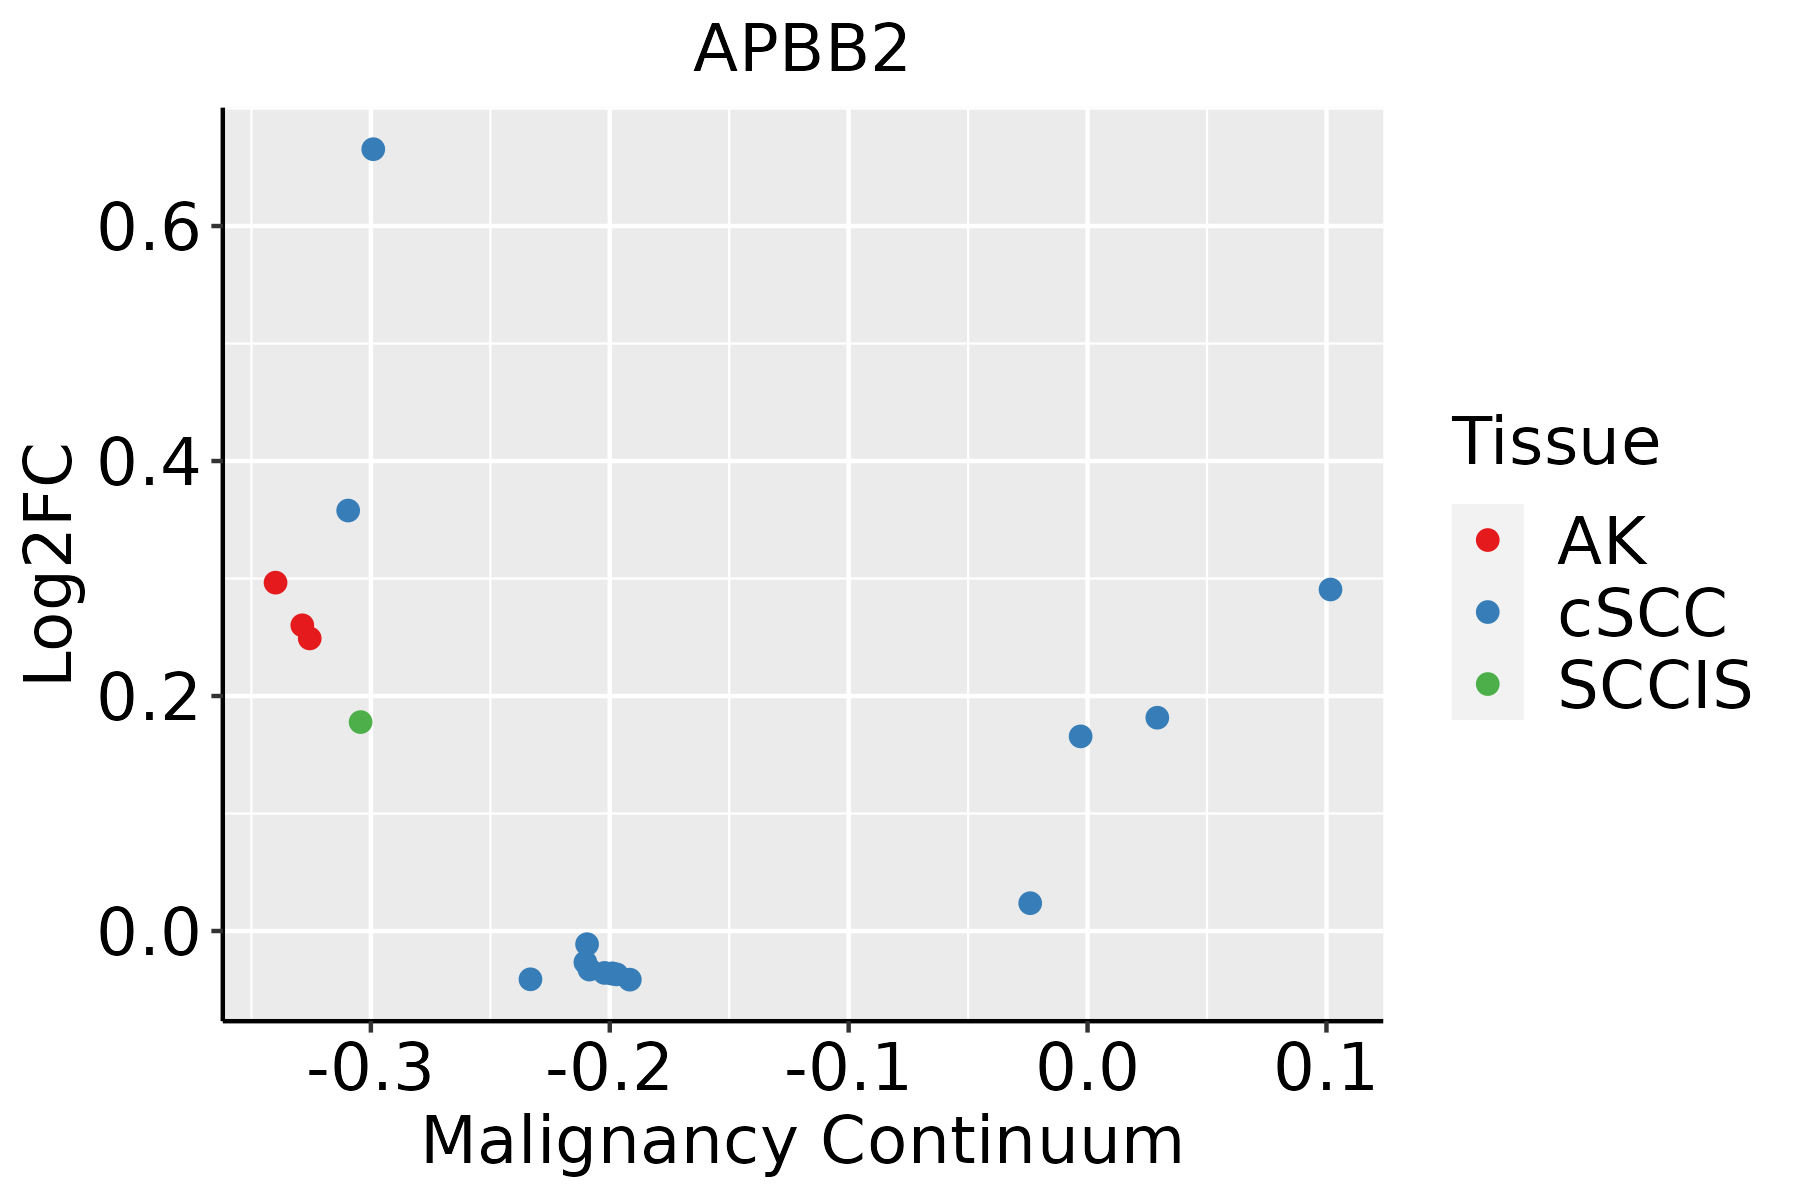 | AK: Actinic keratosis |
| cSCC: Cutaneous squamous cell carcinoma | ||
| SCCIS:squamous cell carcinoma in situ | ||
| Thyroid | 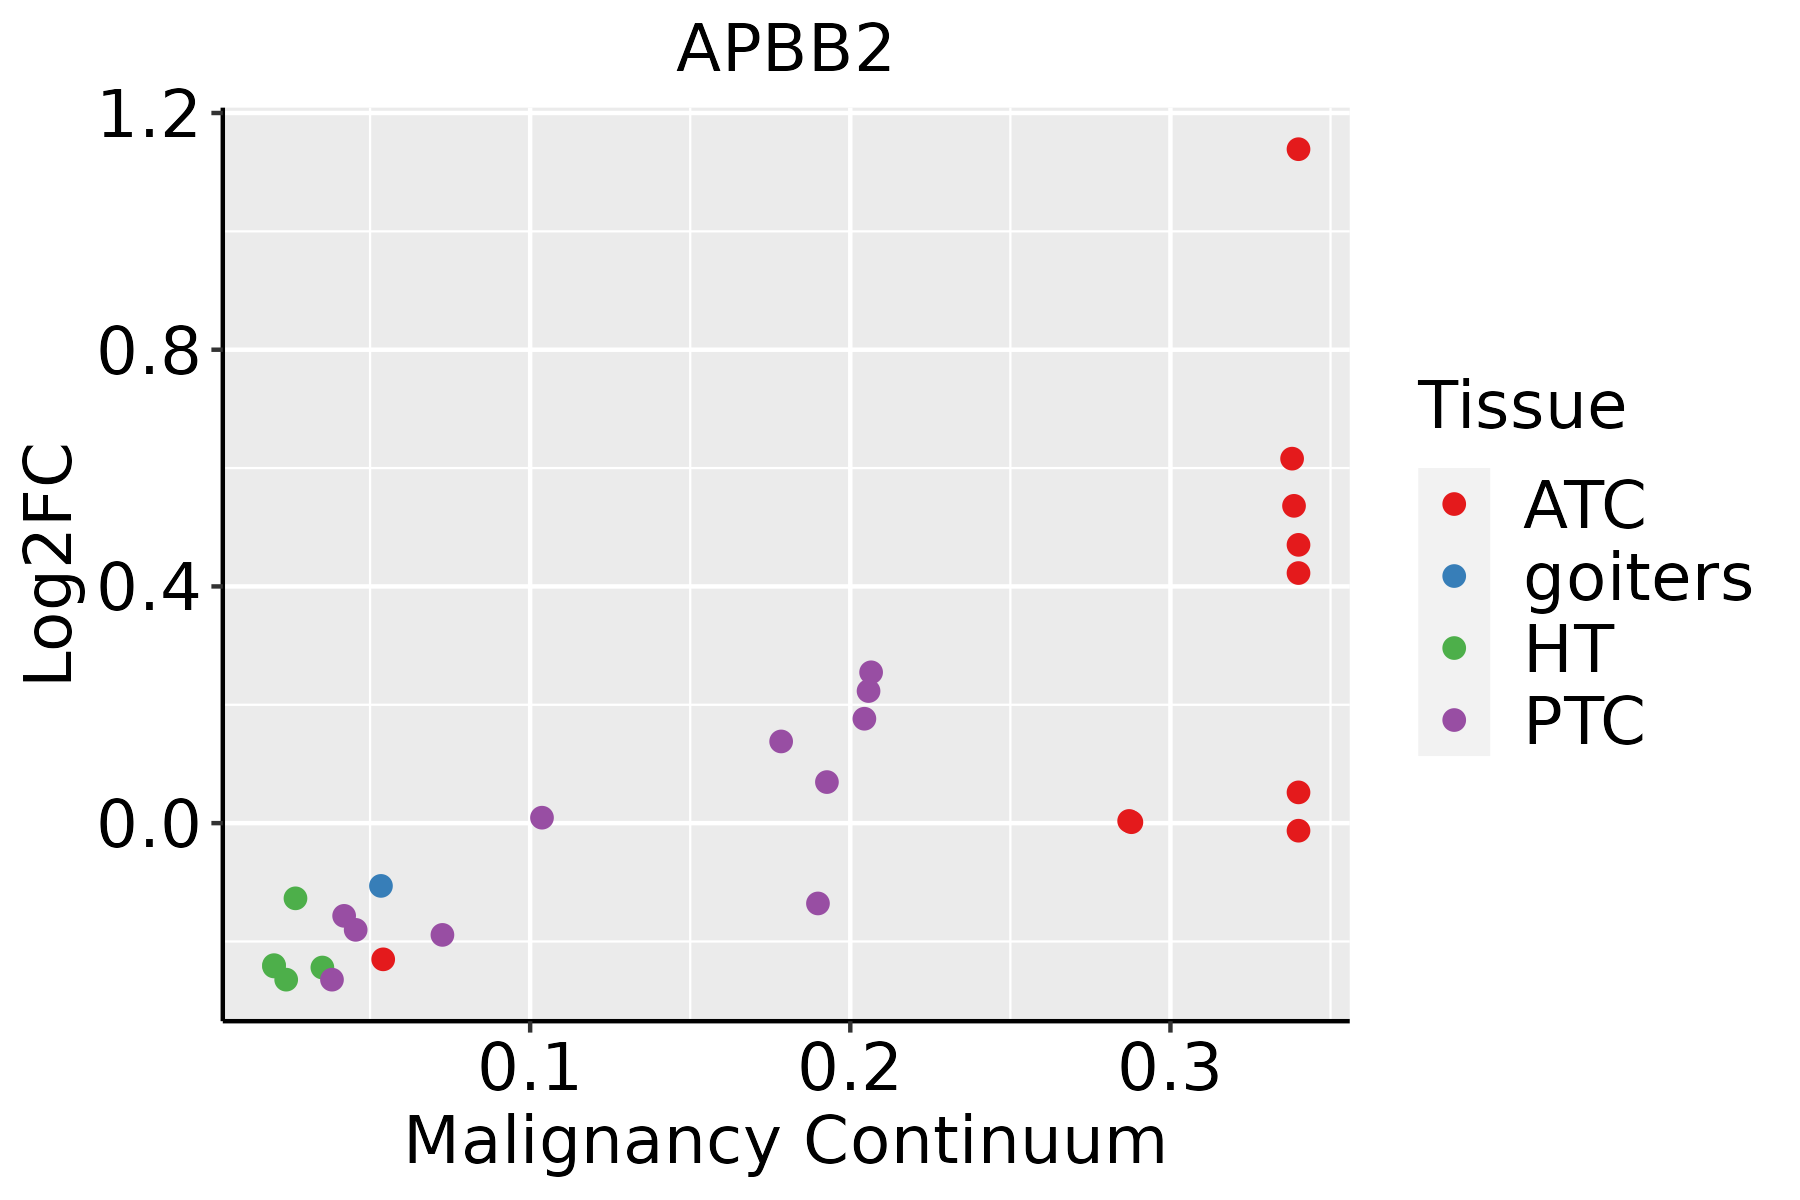 | ATC: Anaplastic thyroid cancer |
| HT: Hashimoto's thyroiditis | ||
| PTC: Papillary thyroid cancer |
| ∗log2FC in expression of this searched gene in stem-like cells from each diseased tissue sample relative to stem-like cells in normal samples in each tissue plotted against the malignancy continuum. Samples are colored based on if they are from different disease stage. |
Top |
Malignant transformation related pathway analysis |
| Find out the enriched GO biological processes and KEGG pathways involved in transition from healthy to precancer to cancer |
| Tissue | Disease Stage | Enriched GO biological Processes |
| Colorectum | AD |  |
| Colorectum | SER |  |
| Colorectum | MSS |  |
| Colorectum | MSI-H |  |
| Colorectum | FAP |  |
| ∗Top 15 enriched GO BP terms are showed in the bar plot of each disease state in each tissue. Each row represents a significant GO biological process which is colored according to the -log10(p.adjust). |
| Page: 1 2 3 4 5 6 7 8 9 |
| GO ID | Tissue | Disease Stage | Description | Gene Ratio | Bg Ratio | pvalue | p.adjust | Count |
| GO:0060249 | Colorectum | AD | anatomical structure homeostasis | 94/3918 | 314/18723 | 9.37e-05 | 1.42e-03 | 94 |
| GO:0001894 | Colorectum | AD | tissue homeostasis | 81/3918 | 268/18723 | 1.96e-04 | 2.62e-03 | 81 |
| GO:0050808 | Colorectum | AD | synapse organization | 112/3918 | 426/18723 | 4.25e-03 | 2.92e-02 | 112 |
| GO:00018941 | Colorectum | SER | tissue homeostasis | 66/2897 | 268/18723 | 5.87e-05 | 1.37e-03 | 66 |
| GO:00602491 | Colorectum | SER | anatomical structure homeostasis | 74/2897 | 314/18723 | 1.01e-04 | 2.13e-03 | 74 |
| GO:0003012 | Colorectum | SER | muscle system process | 92/2897 | 452/18723 | 2.98e-03 | 2.63e-02 | 92 |
| GO:00508081 | Colorectum | SER | synapse organization | 85/2897 | 426/18723 | 7.17e-03 | 4.99e-02 | 85 |
| GO:00602492 | Colorectum | MSS | anatomical structure homeostasis | 84/3467 | 314/18723 | 1.87e-04 | 2.64e-03 | 84 |
| GO:00018942 | Colorectum | MSS | tissue homeostasis | 72/3467 | 268/18723 | 4.53e-04 | 5.40e-03 | 72 |
| GO:00508082 | Colorectum | MSS | synapse organization | 101/3467 | 426/18723 | 3.96e-03 | 2.89e-02 | 101 |
| GO:00030121 | Colorectum | MSS | muscle system process | 105/3467 | 452/18723 | 6.39e-03 | 4.26e-02 | 105 |
| GO:00602493 | Colorectum | MSI-H | anatomical structure homeostasis | 38/1319 | 314/18723 | 7.73e-04 | 1.44e-02 | 38 |
| GO:00018943 | Colorectum | MSI-H | tissue homeostasis | 33/1319 | 268/18723 | 1.24e-03 | 2.00e-02 | 33 |
| GO:00508083 | Colorectum | FAP | synapse organization | 91/2622 | 426/18723 | 1.90e-05 | 4.74e-04 | 91 |
| GO:00018944 | Colorectum | FAP | tissue homeostasis | 61/2622 | 268/18723 | 6.71e-05 | 1.28e-03 | 61 |
| GO:00602494 | Colorectum | FAP | anatomical structure homeostasis | 69/2622 | 314/18723 | 7.51e-05 | 1.37e-03 | 69 |
| GO:00030122 | Colorectum | FAP | muscle system process | 89/2622 | 452/18723 | 4.63e-04 | 5.39e-03 | 89 |
| GO:00602495 | Colorectum | CRC | anatomical structure homeostasis | 57/2078 | 314/18723 | 1.24e-04 | 2.41e-03 | 57 |
| GO:00508084 | Colorectum | CRC | synapse organization | 71/2078 | 426/18723 | 3.02e-04 | 4.76e-03 | 71 |
| GO:00030123 | Colorectum | CRC | muscle system process | 74/2078 | 452/18723 | 3.92e-04 | 5.80e-03 | 74 |
| Page: 1 2 3 4 5 |
| Pathway ID | Tissue | Disease Stage | Description | Gene Ratio | Bg Ratio | pvalue | p.adjust | qvalue | Count |
| Page: 1 |
Top |
Cell-cell communication analysis |
| Identification of potential cell-cell interactions between two cell types and their ligand-receptor pairs for different disease states |
| Ligand | Receptor | LRpair | Pathway | Tissue | Disease Stage |
| Page: 1 |
Top |
Single-cell gene regulatory network inference analysis |
| Find out the significant the regulons (TFs) and the target genes of each regulon across cell types for different disease states |
| TF | Cell Type | Tissue | Disease Stage | Target Gene | RSS | Regulon Activity |
| ∗The dot plots of a searched regulon are shown for all cell subpopulations in each disease state of each tissue based on the regulon specific score inferred using pySCENIC and by calculating the average expression. |
| Page: 1 |
Top |
Somatic mutation of malignant transformation related genes |
| Annotation of somatic variants for genes involved in malignant transformation |
| Hugo Symbol | Variant Class | Variant Classification | dbSNP RS | HGVSc | HGVSp | HGVSp Short | SWISSPROT | BIOTYPE | SIFT | PolyPhen | Tumor Sample Barcode | Tissue | Histology | Sex | Age | Stage | Therapy Types | Drugs | Outcome |
| APBB2 | SNV | Missense_Mutation | c.797C>T | p.Ser266Phe | p.S266F | Q92870 | protein_coding | deleterious(0) | probably_damaging(0.998) | TCGA-BH-A0AV-01 | Breast | breast invasive carcinoma | Female | <65 | I/II | Chemotherapy | taxotere | CR | |
| APBB2 | SNV | Missense_Mutation | rs374033109 | c.1478C>T | p.Ser493Leu | p.S493L | Q92870 | protein_coding | deleterious(0.01) | benign(0.181) | TCGA-BH-A18G-01 | Breast | breast invasive carcinoma | Female | >=65 | I/II | Unknown | Unknown | SD |
| APBB2 | SNV | Missense_Mutation | novel | c.1210G>A | p.Asp404Asn | p.D404N | Q92870 | protein_coding | tolerated(0.16) | benign(0.367) | TCGA-BH-A28O-01 | Breast | breast invasive carcinoma | Female | <65 | III/IV | Chemotherapy | cytoxan | CR |
| APBB2 | insertion | In_Frame_Ins | novel | c.539_540insTGTTAAGTA | p.Gly180_Asn181insValLysTyr | p.G180_N181insVKY | Q92870 | protein_coding | TCGA-A7-A0CJ-01 | Breast | breast invasive carcinoma | Female | <65 | I/II | Chemotherapy | cytoxan | SD | ||
| APBB2 | insertion | Frame_Shift_Ins | novel | c.1976_1977insTGAAGTAA | p.Phe660GlufsTer56 | p.F660Efs*56 | Q92870 | protein_coding | TCGA-A8-A09D-01 | Breast | breast invasive carcinoma | Female | <65 | I/II | Chemotherapy | doxorubicin | CR | ||
| APBB2 | insertion | Nonsense_Mutation | novel | c.1975_1976insTTTTCACCAATTGACATACTACTGAT | p.Ser659PhefsTer5 | p.S659Ffs*5 | Q92870 | protein_coding | TCGA-A8-A09D-01 | Breast | breast invasive carcinoma | Female | <65 | I/II | Chemotherapy | doxorubicin | CR | ||
| APBB2 | insertion | Nonsense_Mutation | novel | c.1935_1936insCAGTTATGATAAACAGATTACATCTCCAAAGGCCAGAACTC | p.Glu646GlnfsTer3 | p.E646Qfs*3 | Q92870 | protein_coding | TCGA-BH-A0H6-01 | Breast | breast invasive carcinoma | Female | >=65 | I/II | Unknown | Unknown | SD | ||
| APBB2 | deletion | Frame_Shift_Del | novel | c.2233delN | p.Leu745SerfsTer5 | p.L745Sfs*5 | Q92870 | protein_coding | TCGA-EW-A2FV-01 | Breast | breast invasive carcinoma | Female | <65 | III/IV | Chemotherapy | docetaxel | SD | ||
| APBB2 | SNV | Missense_Mutation | c.1893N>C | p.Met631Ile | p.M631I | Q92870 | protein_coding | tolerated(0.07) | benign(0.007) | TCGA-C5-A1BM-01 | Cervix | cervical & endocervical cancer | Female | >=65 | I/II | Unknown | Unknown | SD | |
| APBB2 | SNV | Missense_Mutation | c.106N>A | p.Pro36Thr | p.P36T | Q92870 | protein_coding | deleterious(0.01) | probably_damaging(0.999) | TCGA-FU-A23L-01 | Cervix | cervical & endocervical cancer | Female | <65 | I/II | Chemotherapy | cisplatin | CR |
| Page: 1 2 3 4 5 6 |
Top |
Related drugs of malignant transformation related genes |
| Identification of chemicals and drugs interact with genes involved in malignant transfromation |
| (DGIdb 4.0) |
| Entrez ID | Symbol | Category | Interaction Types | Drug Claim Name | Drug Name | PMIDs |
| Page: 1 |

Copyright 2023-Present -The University of Texas Health Science Center at Houston |