
|
|||||
|
 | |
| |
| |
| |
| |
| |
|
Gene: APBA3 |
Gene summary for APBA3 |
| Gene information | Species | Human | Gene symbol | APBA3 | Gene ID | 9546 |
| Gene name | amyloid beta precursor protein binding family A member 3 | |
| Gene Alias | MGC:15815 | |
| Cytomap | 19p13.3 | |
| Gene Type | protein-coding | GO ID | GO:0001701 | UniProtAcc | O96018 |
Top |
Malignant transformation analysis |
| Identification of the aberrant gene expression in precancerous and cancerous lesions by comparing the gene expression of stem-like cells in diseased tissues with normal stem cells |
| Entrez ID | Symbol | Replicates | Species | Organ | Tissue | Adj P-value | Log2FC | Malignancy |
| 9546 | APBA3 | LZE4T | Human | Esophagus | ESCC | 4.20e-02 | 7.51e-02 | 0.0811 |
| 9546 | APBA3 | LZE8T | Human | Esophagus | ESCC | 4.80e-04 | 1.43e-01 | 0.067 |
| 9546 | APBA3 | LZE22T | Human | Esophagus | ESCC | 5.98e-03 | 1.98e-01 | 0.068 |
| 9546 | APBA3 | LZE24T | Human | Esophagus | ESCC | 6.55e-11 | 3.36e-01 | 0.0596 |
| 9546 | APBA3 | P2T-E | Human | Esophagus | ESCC | 1.24e-07 | 1.67e-01 | 0.1177 |
| 9546 | APBA3 | P4T-E | Human | Esophagus | ESCC | 2.79e-08 | 1.52e-01 | 0.1323 |
| 9546 | APBA3 | P8T-E | Human | Esophagus | ESCC | 6.98e-07 | 1.48e-01 | 0.0889 |
| 9546 | APBA3 | P9T-E | Human | Esophagus | ESCC | 8.28e-09 | 1.77e-01 | 0.1131 |
| 9546 | APBA3 | P10T-E | Human | Esophagus | ESCC | 6.97e-13 | 2.02e-01 | 0.116 |
| 9546 | APBA3 | P11T-E | Human | Esophagus | ESCC | 6.15e-09 | 3.25e-01 | 0.1426 |
| 9546 | APBA3 | P12T-E | Human | Esophagus | ESCC | 1.41e-15 | 2.80e-01 | 0.1122 |
| 9546 | APBA3 | P15T-E | Human | Esophagus | ESCC | 1.68e-03 | 1.62e-01 | 0.1149 |
| 9546 | APBA3 | P16T-E | Human | Esophagus | ESCC | 2.13e-23 | 1.72e-01 | 0.1153 |
| 9546 | APBA3 | P17T-E | Human | Esophagus | ESCC | 2.15e-09 | 3.48e-01 | 0.1278 |
| 9546 | APBA3 | P20T-E | Human | Esophagus | ESCC | 2.12e-07 | 1.96e-01 | 0.1124 |
| 9546 | APBA3 | P21T-E | Human | Esophagus | ESCC | 1.34e-10 | 1.71e-01 | 0.1617 |
| 9546 | APBA3 | P22T-E | Human | Esophagus | ESCC | 4.02e-12 | 2.01e-01 | 0.1236 |
| 9546 | APBA3 | P23T-E | Human | Esophagus | ESCC | 7.90e-12 | 3.82e-01 | 0.108 |
| 9546 | APBA3 | P24T-E | Human | Esophagus | ESCC | 6.06e-08 | 1.99e-01 | 0.1287 |
| 9546 | APBA3 | P26T-E | Human | Esophagus | ESCC | 6.73e-15 | 2.88e-01 | 0.1276 |
| Page: 1 2 3 |
| Tissue | Expression Dynamics | Abbreviation |
| Esophagus | 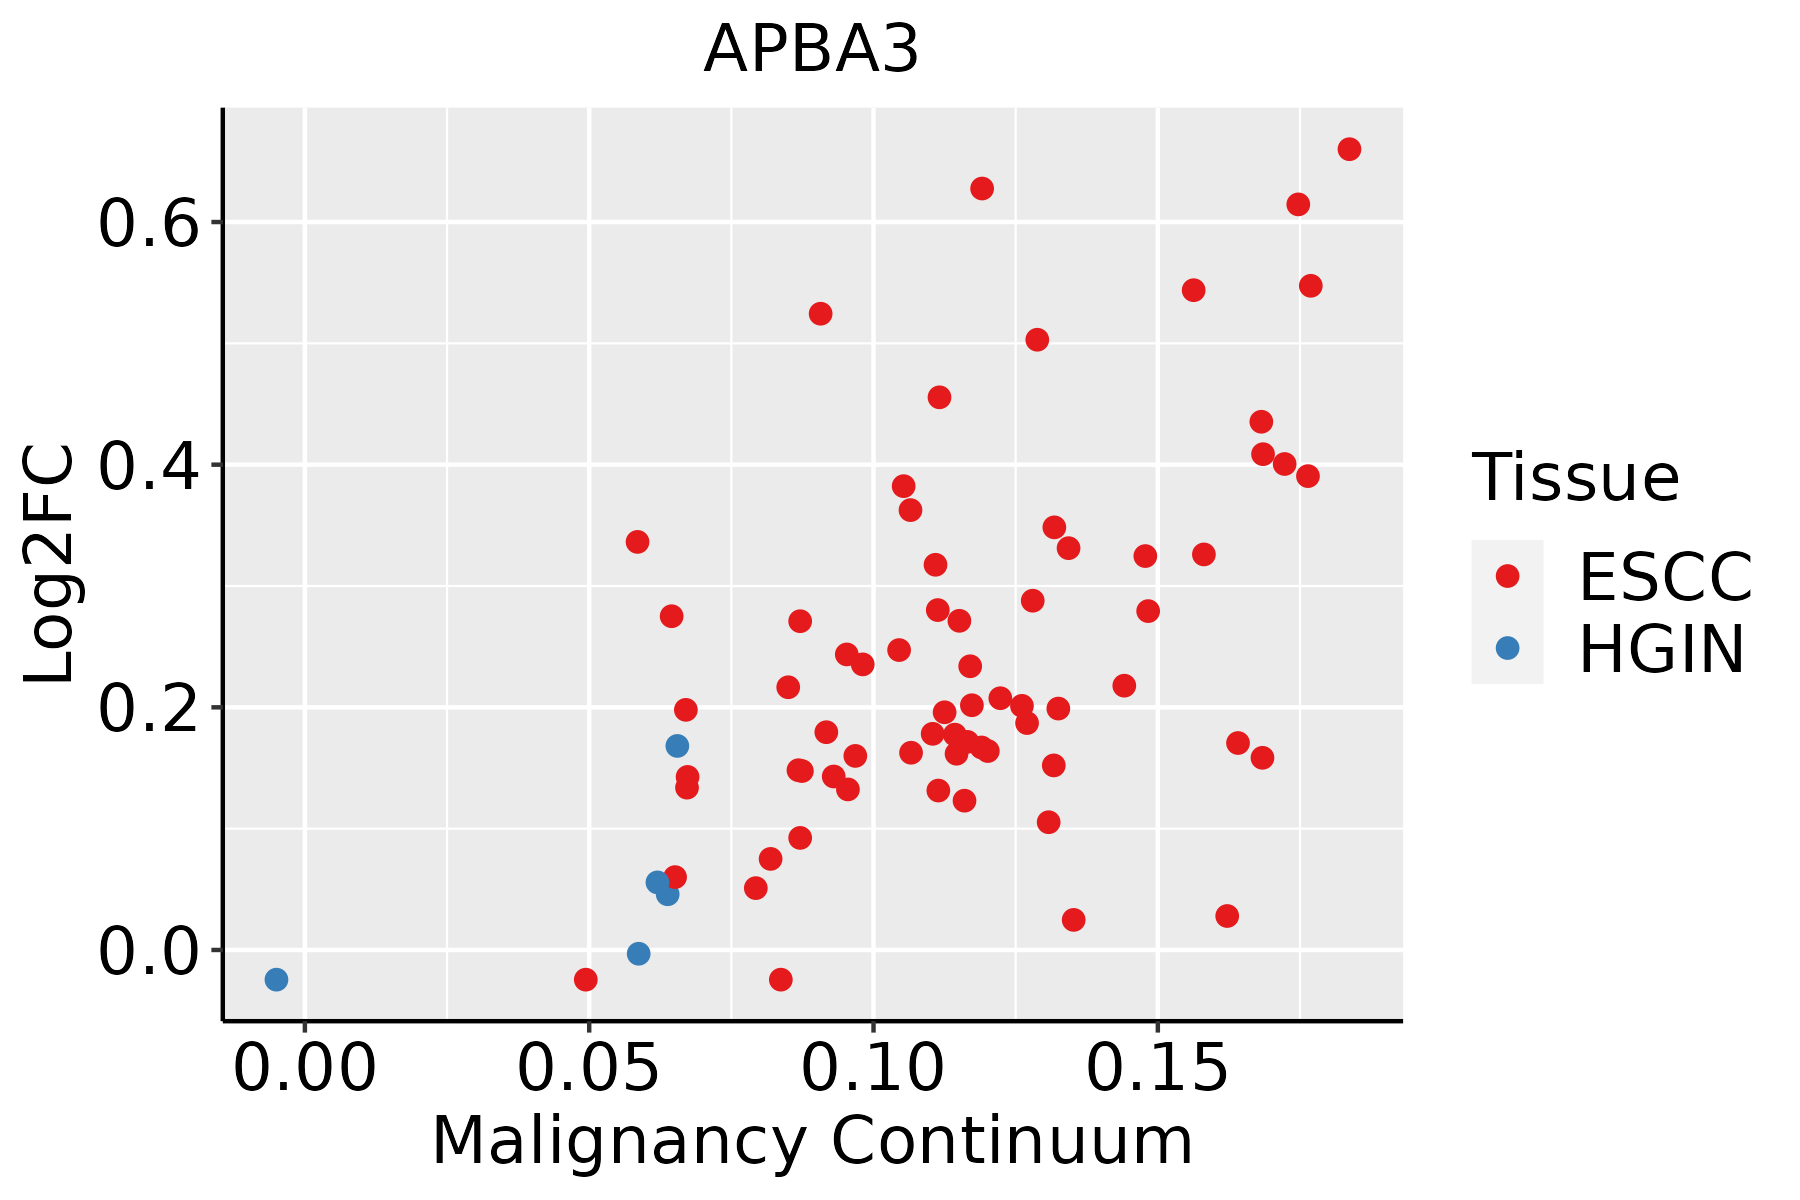 | ESCC: Esophageal squamous cell carcinoma |
| HGIN: High-grade intraepithelial neoplasias | ||
| LGIN: Low-grade intraepithelial neoplasias |
| ∗log2FC in expression of this searched gene in stem-like cells from each diseased tissue sample relative to stem-like cells in normal samples in each tissue plotted against the malignancy continuum. Samples are colored based on if they are from different disease stage. |
Top |
Malignant transformation related pathway analysis |
| Find out the enriched GO biological processes and KEGG pathways involved in transition from healthy to precancer to cancer |
| Tissue | Disease Stage | Enriched GO biological Processes |
| Colorectum | AD |  |
| Colorectum | SER |  |
| Colorectum | MSS |  |
| Colorectum | MSI-H |  |
| Colorectum | FAP |  |
| ∗Top 15 enriched GO BP terms are showed in the bar plot of each disease state in each tissue. Each row represents a significant GO biological process which is colored according to the -log10(p.adjust). |
| Page: 1 2 3 4 5 6 7 8 9 |
| GO ID | Tissue | Disease Stage | Description | Gene Ratio | Bg Ratio | pvalue | p.adjust | Count |
| GO:000170119 | Esophagus | ESCC | in utero embryonic development | 243/8552 | 367/18723 | 1.00e-15 | 6.86e-14 | 243 |
| Page: 1 |
| Pathway ID | Tissue | Disease Stage | Description | Gene Ratio | Bg Ratio | pvalue | p.adjust | qvalue | Count |
| Page: 1 |
Top |
Cell-cell communication analysis |
| Identification of potential cell-cell interactions between two cell types and their ligand-receptor pairs for different disease states |
| Ligand | Receptor | LRpair | Pathway | Tissue | Disease Stage |
| Page: 1 |
Top |
Single-cell gene regulatory network inference analysis |
| Find out the significant the regulons (TFs) and the target genes of each regulon across cell types for different disease states |
| TF | Cell Type | Tissue | Disease Stage | Target Gene | RSS | Regulon Activity |
| ∗The dot plots of a searched regulon are shown for all cell subpopulations in each disease state of each tissue based on the regulon specific score inferred using pySCENIC and by calculating the average expression. |
| Page: 1 |
Top |
Somatic mutation of malignant transformation related genes |
| Annotation of somatic variants for genes involved in malignant transformation |
| Hugo Symbol | Variant Class | Variant Classification | dbSNP RS | HGVSc | HGVSp | HGVSp Short | SWISSPROT | BIOTYPE | SIFT | PolyPhen | Tumor Sample Barcode | Tissue | Histology | Sex | Age | Stage | Therapy Types | Drugs | Outcome |
| APBA3 | SNV | Missense_Mutation | novel | c.1118N>A | p.Pro373Gln | p.P373Q | O96018 | protein_coding | tolerated(0.46) | benign(0) | TCGA-AC-A3W6-01 | Breast | breast invasive carcinoma | Female | >=65 | III/IV | Unknown | Unknown | SD |
| APBA3 | SNV | Missense_Mutation | novel | c.556G>A | p.Glu186Lys | p.E186K | O96018 | protein_coding | tolerated(0.13) | benign(0.02) | TCGA-E2-A1IN-01 | Breast | breast invasive carcinoma | Female | <65 | I/II | Hormone Therapy | arimidex | SD |
| APBA3 | SNV | Missense_Mutation | c.899N>G | p.Ile300Ser | p.I300S | O96018 | protein_coding | deleterious(0) | probably_damaging(0.996) | TCGA-E9-A1RH-01 | Breast | breast invasive carcinoma | Female | <65 | I/II | Chemotherapy | 5-fluorouracil | SD | |
| APBA3 | deletion | Frame_Shift_Del | novel | c.1511delN | p.Gly504AlafsTer113 | p.G504Afs*113 | O96018 | protein_coding | TCGA-EW-A2FV-01 | Breast | breast invasive carcinoma | Female | <65 | III/IV | Chemotherapy | docetaxel | SD | ||
| APBA3 | SNV | Missense_Mutation | novel | c.343N>A | p.Leu115Ile | p.L115I | O96018 | protein_coding | deleterious_low_confidence(0) | possibly_damaging(0.563) | TCGA-2W-A8YY-01 | Cervix | cervical & endocervical cancer | Female | <65 | I/II | Chemotherapy | cisplatin | CR |
| APBA3 | SNV | Missense_Mutation | c.466N>A | p.Glu156Lys | p.E156K | O96018 | protein_coding | tolerated(0.06) | benign(0.014) | TCGA-EK-A2RA-01 | Cervix | cervical & endocervical cancer | Female | >=65 | I/II | Unknown | Unknown | SD | |
| APBA3 | SNV | Missense_Mutation | c.541N>G | p.Leu181Val | p.L181V | O96018 | protein_coding | tolerated(0.06) | possibly_damaging(0.646) | TCGA-VS-A8QC-01 | Cervix | cervical & endocervical cancer | Female | <65 | I/II | Chemotherapy | paclitaxel | PD | |
| APBA3 | deletion | Frame_Shift_Del | novel | c.472delG | p.Ala158ProfsTer24 | p.A158Pfs*24 | O96018 | protein_coding | TCGA-EA-A410-01 | Cervix | cervical & endocervical cancer | Female | <65 | I/II | Unknown | Unknown | SD | ||
| APBA3 | SNV | Missense_Mutation | rs376088061 | c.1432G>A | p.Val478Ile | p.V478I | O96018 | protein_coding | tolerated(0.07) | benign(0.009) | TCGA-5M-AAT6-01 | Colorectum | colon adenocarcinoma | Female | <65 | III/IV | Unknown | Unknown | PD |
| APBA3 | SNV | Missense_Mutation | novel | c.790A>G | p.Thr264Ala | p.T264A | O96018 | protein_coding | deleterious(0.03) | benign(0.236) | TCGA-5M-AAT6-01 | Colorectum | colon adenocarcinoma | Female | <65 | III/IV | Unknown | Unknown | PD |
| Page: 1 2 3 4 5 |
Top |
Related drugs of malignant transformation related genes |
| Identification of chemicals and drugs interact with genes involved in malignant transfromation |
| (DGIdb 4.0) |
| Entrez ID | Symbol | Category | Interaction Types | Drug Claim Name | Drug Name | PMIDs |
| Page: 1 |

Copyright 2023-Present -The University of Texas Health Science Center at Houston |