
|
|||||
|
 | |
| |
| |
| |
| |
| |
|
Gene: APBA1 |
Gene summary for APBA1 |
| Gene information | Species | Human | Gene symbol | APBA1 | Gene ID | 320 |
| Gene name | amyloid beta precursor protein binding family A member 1 | |
| Gene Alias | D9S411E | |
| Cytomap | 9q21.12 | |
| Gene Type | protein-coding | GO ID | GO:0001505 | UniProtAcc | Q02410 |
Top |
Malignant transformation analysis |
| Identification of the aberrant gene expression in precancerous and cancerous lesions by comparing the gene expression of stem-like cells in diseased tissues with normal stem cells |
| Entrez ID | Symbol | Replicates | Species | Organ | Tissue | Adj P-value | Log2FC | Malignancy |
| 320 | APBA1 | NAFLD1 | Human | Liver | NAFLD | 6.22e-09 | 8.87e-01 | -0.04 |
| 320 | APBA1 | S41 | Human | Liver | Cirrhotic | 1.58e-02 | 5.32e-01 | -0.0343 |
| 320 | APBA1 | S43 | Human | Liver | Cirrhotic | 2.32e-05 | -1.94e-01 | -0.0187 |
| 320 | APBA1 | HCC1_Meng | Human | Liver | HCC | 6.94e-05 | -2.15e-01 | 0.0246 |
| 320 | APBA1 | HCC2_Meng | Human | Liver | HCC | 9.71e-06 | -2.17e-01 | 0.0107 |
| 320 | APBA1 | cirrhotic1 | Human | Liver | Cirrhotic | 3.90e-05 | -1.95e-01 | 0.0202 |
| 320 | APBA1 | cirrhotic2 | Human | Liver | Cirrhotic | 8.10e-04 | -2.05e-01 | 0.0201 |
| 320 | APBA1 | cirrhotic3 | Human | Liver | Cirrhotic | 3.98e-02 | -2.16e-01 | 0.0215 |
| 320 | APBA1 | HCC5 | Human | Liver | HCC | 4.04e-11 | -1.16e-01 | 0.4932 |
| 320 | APBA1 | Pt13.a | Human | Liver | HCC | 2.38e-05 | -2.15e-01 | 0.021 |
| 320 | APBA1 | Pt14.d | Human | Liver | HCC | 1.90e-03 | -2.02e-01 | 0.0143 |
| 320 | APBA1 | S016 | Human | Liver | HCC | 8.11e-03 | -2.20e-01 | 0.2243 |
| Page: 1 |
| Tissue | Expression Dynamics | Abbreviation |
| Liver | 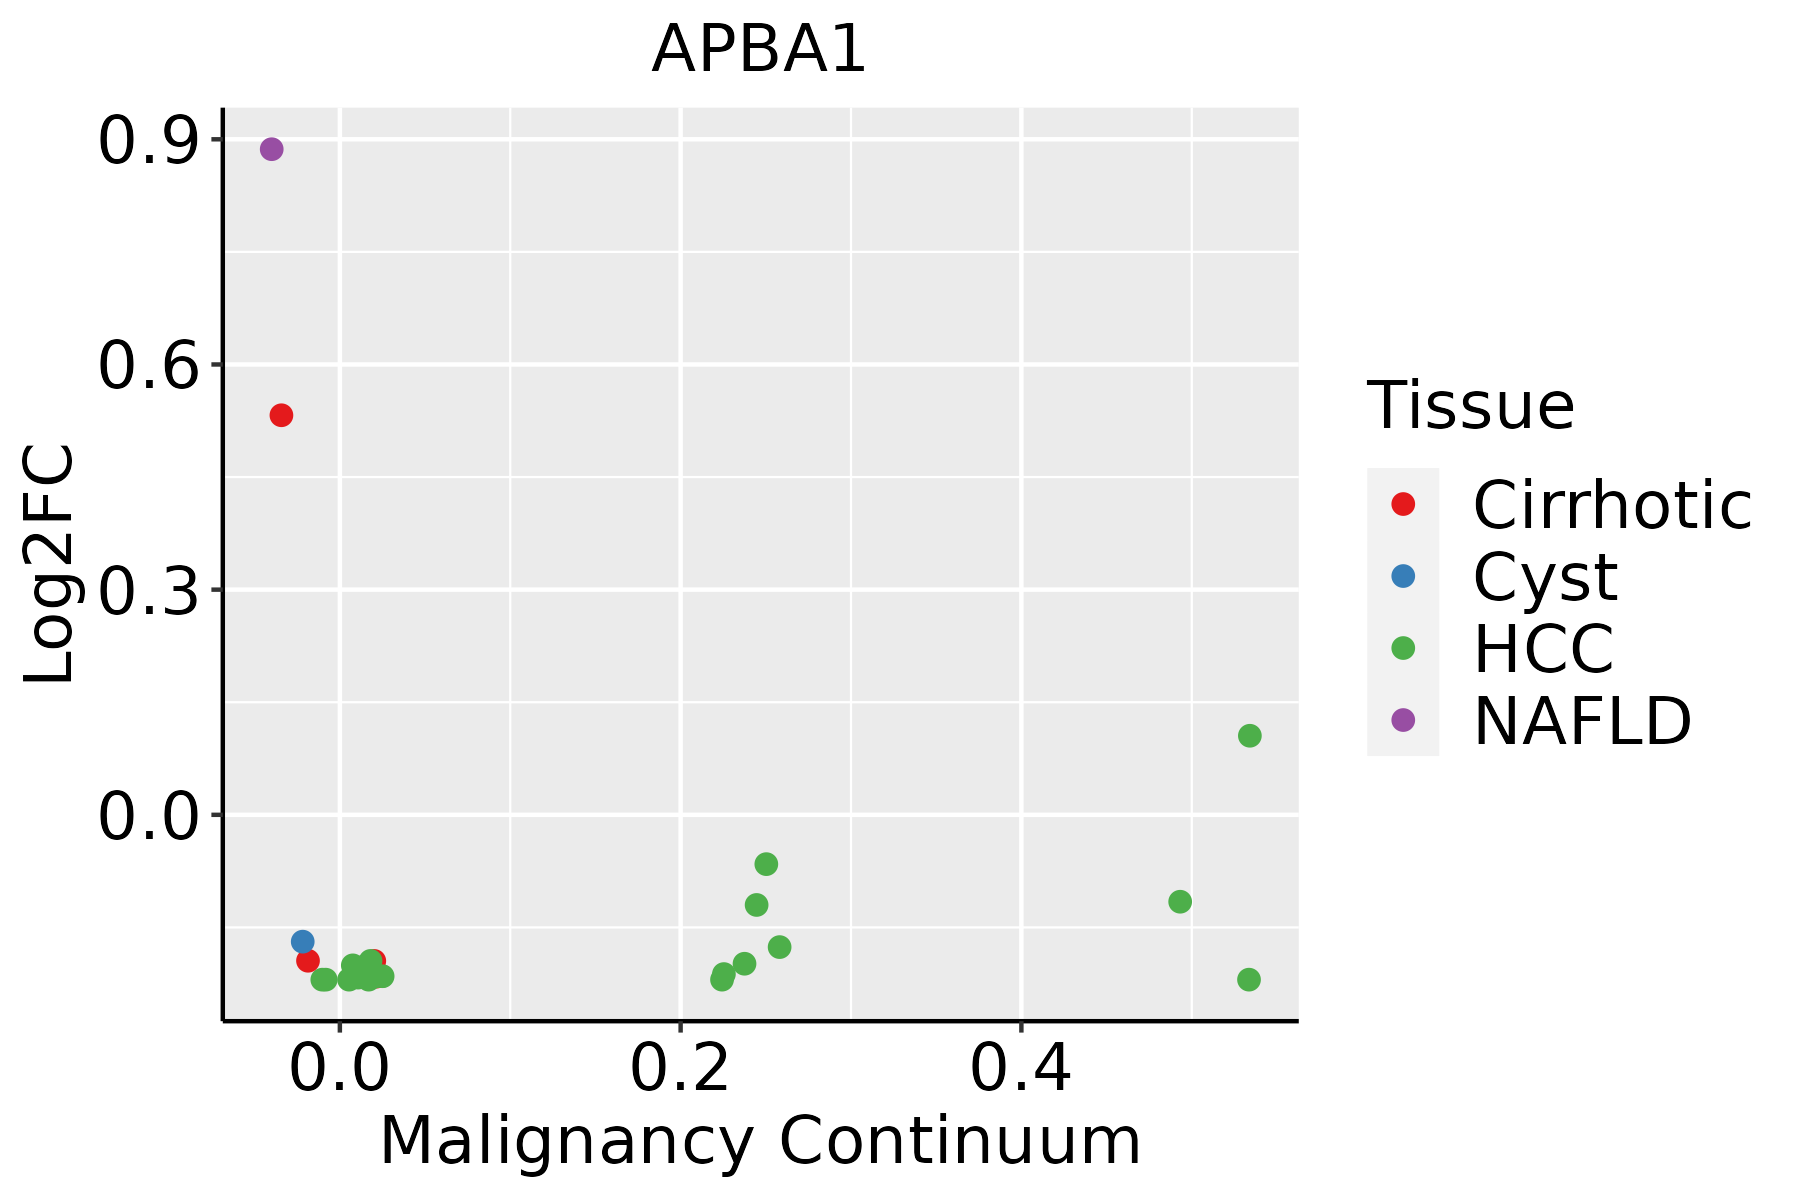 | HCC: Hepatocellular carcinoma |
| NAFLD: Non-alcoholic fatty liver disease |
| ∗log2FC in expression of this searched gene in stem-like cells from each diseased tissue sample relative to stem-like cells in normal samples in each tissue plotted against the malignancy continuum. Samples are colored based on if they are from different disease stage. |
Top |
Malignant transformation related pathway analysis |
| Find out the enriched GO biological processes and KEGG pathways involved in transition from healthy to precancer to cancer |
| Tissue | Disease Stage | Enriched GO biological Processes |
| Colorectum | AD |  |
| Colorectum | SER |  |
| Colorectum | MSS |  |
| Colorectum | MSI-H |  |
| Colorectum | FAP |  |
| ∗Top 15 enriched GO BP terms are showed in the bar plot of each disease state in each tissue. Each row represents a significant GO biological process which is colored according to the -log10(p.adjust). |
| Page: 1 2 3 4 5 6 7 8 9 |
| GO ID | Tissue | Disease Stage | Description | Gene Ratio | Bg Ratio | pvalue | p.adjust | Count |
| GO:00352643 | Liver | NAFLD | multicellular organism growth | 27/1882 | 132/18723 | 2.57e-04 | 4.19e-03 | 27 |
| GO:00307055 | Liver | NAFLD | cytoskeleton-dependent intracellular transport | 33/1882 | 195/18723 | 1.98e-03 | 1.98e-02 | 33 |
| GO:00109703 | Liver | NAFLD | transport along microtubule | 26/1882 | 155/18723 | 6.30e-03 | 4.69e-02 | 26 |
| GO:00080884 | Liver | NAFLD | axo-dendritic transport | 15/1882 | 75/18723 | 7.02e-03 | 4.91e-02 | 15 |
| GO:00017015 | Liver | Cirrhotic | in utero embryonic development | 134/4634 | 367/18723 | 2.78e-07 | 6.86e-06 | 134 |
| GO:003070511 | Liver | Cirrhotic | cytoskeleton-dependent intracellular transport | 68/4634 | 195/18723 | 9.54e-04 | 6.77e-03 | 68 |
| GO:003526411 | Liver | Cirrhotic | multicellular organism growth | 47/4634 | 132/18723 | 3.40e-03 | 1.89e-02 | 47 |
| GO:000808811 | Liver | Cirrhotic | axo-dendritic transport | 29/4634 | 75/18723 | 5.24e-03 | 2.69e-02 | 29 |
| GO:00109701 | Liver | Cirrhotic | transport along microtubule | 52/4634 | 155/18723 | 8.42e-03 | 3.91e-02 | 52 |
| GO:000170111 | Liver | HCC | in utero embryonic development | 204/7958 | 367/18723 | 2.44e-07 | 4.30e-06 | 204 |
| GO:00080882 | Liver | HCC | axo-dendritic transport | 52/7958 | 75/18723 | 2.34e-06 | 3.14e-05 | 52 |
| GO:003070521 | Liver | HCC | cytoskeleton-dependent intracellular transport | 111/7958 | 195/18723 | 3.25e-05 | 3.28e-04 | 111 |
| GO:00109702 | Liver | HCC | transport along microtubule | 90/7958 | 155/18723 | 6.49e-05 | 5.92e-04 | 90 |
| GO:003526421 | Liver | HCC | multicellular organism growth | 70/7958 | 132/18723 | 9.29e-03 | 3.57e-02 | 70 |
| Page: 1 |
| Pathway ID | Tissue | Disease Stage | Description | Gene Ratio | Bg Ratio | pvalue | p.adjust | qvalue | Count |
| Page: 1 |
Top |
Cell-cell communication analysis |
| Identification of potential cell-cell interactions between two cell types and their ligand-receptor pairs for different disease states |
| Ligand | Receptor | LRpair | Pathway | Tissue | Disease Stage |
| Page: 1 |
Top |
Single-cell gene regulatory network inference analysis |
| Find out the significant the regulons (TFs) and the target genes of each regulon across cell types for different disease states |
| TF | Cell Type | Tissue | Disease Stage | Target Gene | RSS | Regulon Activity |
| ∗The dot plots of a searched regulon are shown for all cell subpopulations in each disease state of each tissue based on the regulon specific score inferred using pySCENIC and by calculating the average expression. |
| Page: 1 |
Top |
Somatic mutation of malignant transformation related genes |
| Annotation of somatic variants for genes involved in malignant transformation |
| Hugo Symbol | Variant Class | Variant Classification | dbSNP RS | HGVSc | HGVSp | HGVSp Short | SWISSPROT | BIOTYPE | SIFT | PolyPhen | Tumor Sample Barcode | Tissue | Histology | Sex | Age | Stage | Therapy Types | Drugs | Outcome |
| APBA1 | SNV | Missense_Mutation | novel | c.472N>A | p.Glu158Lys | p.E158K | Q02410 | protein_coding | deleterious_low_confidence(0) | benign(0.164) | TCGA-5L-AAT1-01 | Breast | breast invasive carcinoma | Female | <65 | III/IV | Hormone Therapy | letrozol | SD |
| APBA1 | SNV | Missense_Mutation | c.2260N>C | p.Asp754His | p.D754H | Q02410 | protein_coding | tolerated(0.13) | probably_damaging(0.999) | TCGA-A8-A08L-01 | Breast | breast invasive carcinoma | Female | >=65 | III/IV | Unknown | Unknown | SD | |
| APBA1 | SNV | Missense_Mutation | rs370688256 | c.1682N>A | p.Arg561Gln | p.R561Q | Q02410 | protein_coding | deleterious(0) | probably_damaging(0.978) | TCGA-AR-A1AW-01 | Breast | breast invasive carcinoma | Female | >=65 | I/II | Chemotherapy | docetaxel | SD |
| APBA1 | SNV | Missense_Mutation | c.1495N>G | p.Leu499Val | p.L499V | Q02410 | protein_coding | tolerated(0.31) | benign(0.019) | TCGA-E2-A1IF-01 | Breast | breast invasive carcinoma | Female | >=65 | I/II | Hormone Therapy | arimidex | SD | |
| APBA1 | SNV | Missense_Mutation | rs750298305 | c.1177N>T | p.Asp393Tyr | p.D393Y | Q02410 | protein_coding | deleterious(0.02) | probably_damaging(0.921) | TCGA-E9-A22E-01 | Breast | breast invasive carcinoma | Female | <65 | III/IV | Chemotherapy | cyclophosphane | SD |
| APBA1 | deletion | Frame_Shift_Del | novel | c.1021delG | p.Glu341ArgfsTer20 | p.E341Rfs*20 | Q02410 | protein_coding | TCGA-EW-A2FV-01 | Breast | breast invasive carcinoma | Female | <65 | III/IV | Chemotherapy | docetaxel | SD | ||
| APBA1 | SNV | Missense_Mutation | rs561593212 | c.1387N>A | p.Ala463Thr | p.A463T | Q02410 | protein_coding | deleterious(0) | probably_damaging(0.999) | TCGA-2W-A8YY-01 | Cervix | cervical & endocervical cancer | Female | <65 | I/II | Chemotherapy | cisplatin | CR |
| APBA1 | SNV | Missense_Mutation | rs370688256 | c.1682N>A | p.Arg561Gln | p.R561Q | Q02410 | protein_coding | deleterious(0) | probably_damaging(0.978) | TCGA-C5-A1BE-01 | Cervix | cervical & endocervical cancer | Female | <65 | I/II | Chemotherapy | cisplatin | PD |
| APBA1 | SNV | Missense_Mutation | rs753725669 | c.1444N>T | p.Arg482Cys | p.R482C | Q02410 | protein_coding | deleterious(0) | probably_damaging(0.998) | TCGA-5M-AAT6-01 | Colorectum | colon adenocarcinoma | Female | <65 | III/IV | Unknown | Unknown | PD |
| APBA1 | SNV | Missense_Mutation | rs756578388 | c.1952N>T | p.Ser651Leu | p.S651L | Q02410 | protein_coding | deleterious(0) | probably_damaging(0.988) | TCGA-A6-3809-01 | Colorectum | colon adenocarcinoma | Female | >=65 | I/II | Unknown | Unknown | SD |
| Page: 1 2 3 4 5 6 7 8 9 10 11 12 |
Top |
Related drugs of malignant transformation related genes |
| Identification of chemicals and drugs interact with genes involved in malignant transfromation |
| (DGIdb 4.0) |
| Entrez ID | Symbol | Category | Interaction Types | Drug Claim Name | Drug Name | PMIDs |
| 320 | APBA1 | NA | HESPERIDIN | HESPERIDIN | ||
| 320 | APBA1 | NA | PHENAZINE-2,3-DIAMINE | CHEMBL274921 | ||
| 320 | APBA1 | NA | GNF-PF-3464 | CHEMBL602213 | ||
| 320 | APBA1 | NA | NSC-50654 | CHEMBL1372046 | ||
| 320 | APBA1 | NA | TCMDC-125221 | CHEMBL546649 | ||
| 320 | APBA1 | NA | BENZO[D]ISOTHIAZOL-3-ONE | CHEMBL297304 | ||
| 320 | APBA1 | NA | NSC-180246 | CHEMBL484640 | ||
| 320 | APBA1 | NA | NIFEDIPINE | NIFEDIPINE | ||
| 320 | APBA1 | NA | SLAZINIC ACID | SLAZINIC ACID |
| Page: 1 |

Copyright 2023-Present -The University of Texas Health Science Center at Houston |