
|
|||||
|
 | |
| |
| |
| |
| |
| |
|
Gene: AP4S1 |
Gene summary for AP4S1 |
| Gene information | Species | Human | Gene symbol | AP4S1 | Gene ID | 11154 |
| Gene name | adaptor related protein complex 4 subunit sigma 1 | |
| Gene Alias | AP47B | |
| Cytomap | 14q12 | |
| Gene Type | protein-coding | GO ID | GO:0006605 | UniProtAcc | Q9Y587 |
Top |
Malignant transformation analysis |
| Identification of the aberrant gene expression in precancerous and cancerous lesions by comparing the gene expression of stem-like cells in diseased tissues with normal stem cells |
| Entrez ID | Symbol | Replicates | Species | Organ | Tissue | Adj P-value | Log2FC | Malignancy |
| 11154 | AP4S1 | LZE4T | Human | Esophagus | ESCC | 6.24e-05 | 1.73e-01 | 0.0811 |
| 11154 | AP4S1 | LZE24T | Human | Esophagus | ESCC | 1.73e-05 | 1.20e-01 | 0.0596 |
| 11154 | AP4S1 | P2T-E | Human | Esophagus | ESCC | 3.71e-08 | 8.17e-02 | 0.1177 |
| 11154 | AP4S1 | P4T-E | Human | Esophagus | ESCC | 1.14e-08 | 1.93e-01 | 0.1323 |
| 11154 | AP4S1 | P5T-E | Human | Esophagus | ESCC | 4.77e-16 | 3.49e-01 | 0.1327 |
| 11154 | AP4S1 | P8T-E | Human | Esophagus | ESCC | 4.10e-26 | 5.39e-01 | 0.0889 |
| 11154 | AP4S1 | P10T-E | Human | Esophagus | ESCC | 6.40e-17 | 2.06e-01 | 0.116 |
| 11154 | AP4S1 | P11T-E | Human | Esophagus | ESCC | 6.82e-07 | 2.08e-01 | 0.1426 |
| 11154 | AP4S1 | P12T-E | Human | Esophagus | ESCC | 3.71e-17 | 3.02e-01 | 0.1122 |
| 11154 | AP4S1 | P15T-E | Human | Esophagus | ESCC | 1.64e-19 | 3.81e-01 | 0.1149 |
| 11154 | AP4S1 | P20T-E | Human | Esophagus | ESCC | 1.12e-03 | 7.20e-02 | 0.1124 |
| 11154 | AP4S1 | P21T-E | Human | Esophagus | ESCC | 1.30e-04 | 5.59e-02 | 0.1617 |
| 11154 | AP4S1 | P22T-E | Human | Esophagus | ESCC | 2.37e-06 | 6.86e-02 | 0.1236 |
| 11154 | AP4S1 | P23T-E | Human | Esophagus | ESCC | 4.61e-07 | 1.19e-01 | 0.108 |
| 11154 | AP4S1 | P26T-E | Human | Esophagus | ESCC | 2.08e-09 | 1.77e-01 | 0.1276 |
| 11154 | AP4S1 | P27T-E | Human | Esophagus | ESCC | 4.49e-08 | 1.73e-01 | 0.1055 |
| 11154 | AP4S1 | P28T-E | Human | Esophagus | ESCC | 7.90e-08 | 8.27e-02 | 0.1149 |
| 11154 | AP4S1 | P30T-E | Human | Esophagus | ESCC | 2.01e-08 | 2.13e-01 | 0.137 |
| 11154 | AP4S1 | P31T-E | Human | Esophagus | ESCC | 1.07e-05 | 1.46e-01 | 0.1251 |
| 11154 | AP4S1 | P36T-E | Human | Esophagus | ESCC | 7.70e-06 | 1.09e-01 | 0.1187 |
| Page: 1 2 3 |
| Tissue | Expression Dynamics | Abbreviation |
| Esophagus | 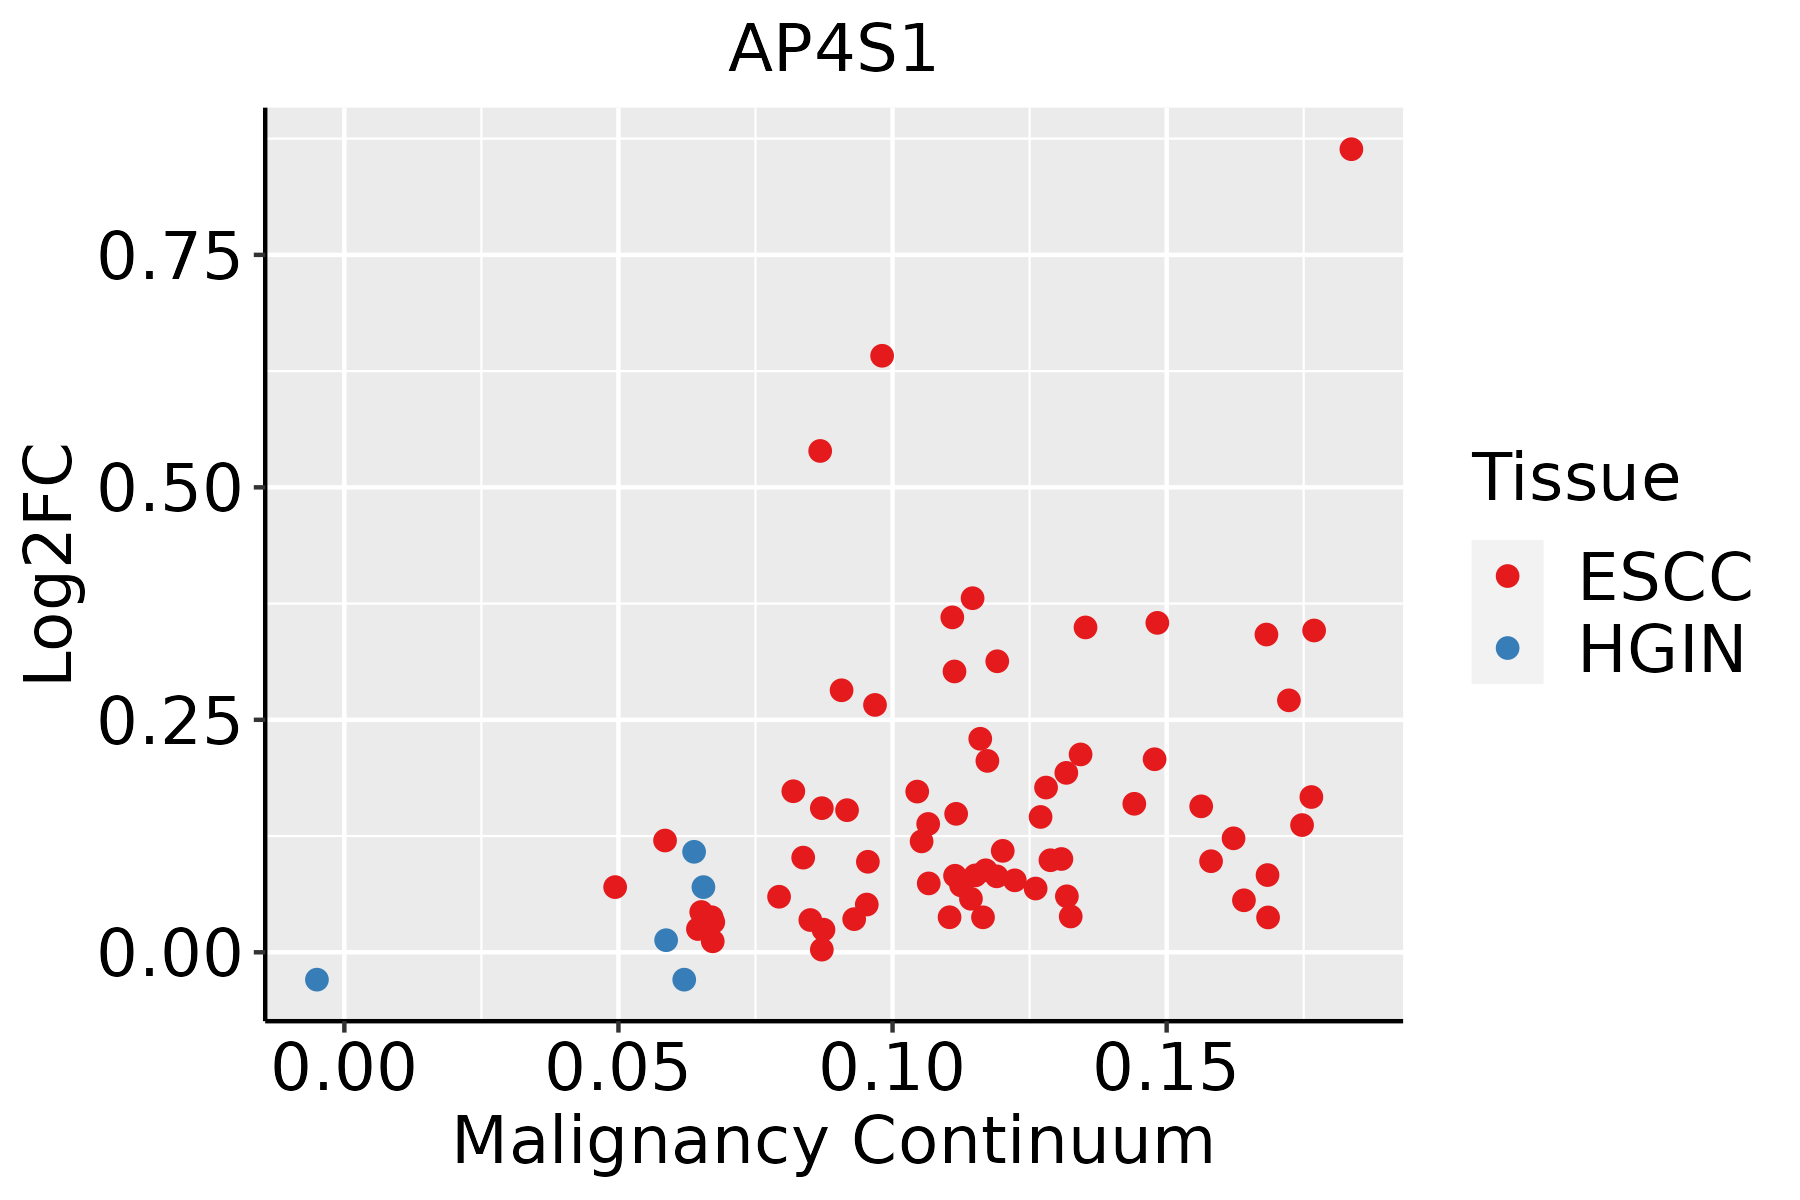 | ESCC: Esophageal squamous cell carcinoma |
| HGIN: High-grade intraepithelial neoplasias | ||
| LGIN: Low-grade intraepithelial neoplasias | ||
| Liver | 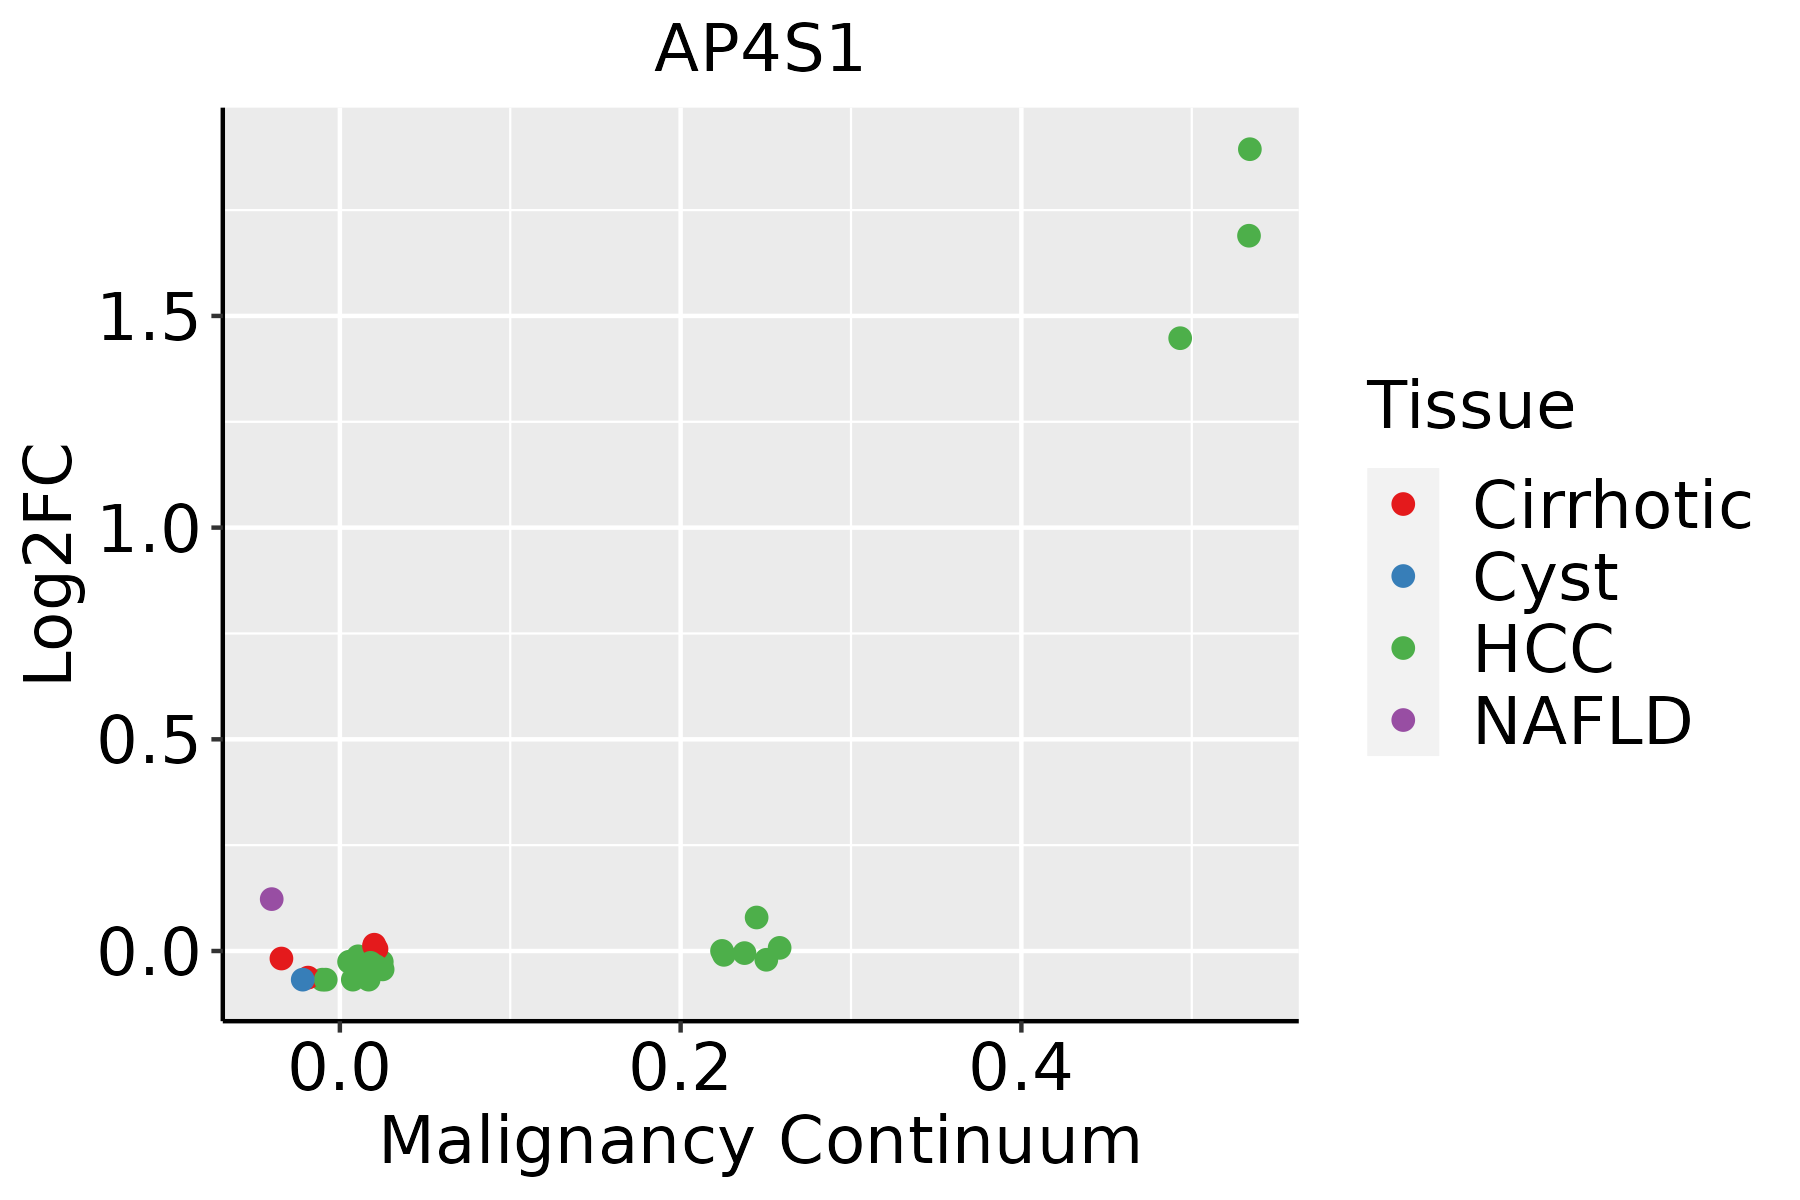 | HCC: Hepatocellular carcinoma |
| NAFLD: Non-alcoholic fatty liver disease |
| ∗log2FC in expression of this searched gene in stem-like cells from each diseased tissue sample relative to stem-like cells in normal samples in each tissue plotted against the malignancy continuum. Samples are colored based on if they are from different disease stage. |
Top |
Malignant transformation related pathway analysis |
| Find out the enriched GO biological processes and KEGG pathways involved in transition from healthy to precancer to cancer |
| Tissue | Disease Stage | Enriched GO biological Processes |
| Colorectum | AD |  |
| Colorectum | SER |  |
| Colorectum | MSS |  |
| Colorectum | MSI-H |  |
| Colorectum | FAP |  |
| ∗Top 15 enriched GO BP terms are showed in the bar plot of each disease state in each tissue. Each row represents a significant GO biological process which is colored according to the -log10(p.adjust). |
| Page: 1 2 3 4 5 6 7 8 9 |
| GO ID | Tissue | Disease Stage | Description | Gene Ratio | Bg Ratio | pvalue | p.adjust | Count |
| GO:0006605111 | Esophagus | ESCC | protein targeting | 229/8552 | 314/18723 | 4.93e-23 | 1.01e-20 | 229 |
| GO:000660512 | Liver | HCC | protein targeting | 219/7958 | 314/18723 | 7.74e-23 | 1.49e-20 | 219 |
| Page: 1 |
| Pathway ID | Tissue | Disease Stage | Description | Gene Ratio | Bg Ratio | pvalue | p.adjust | qvalue | Count |
| hsa0414222 | Esophagus | ESCC | Lysosome | 102/4205 | 132/8465 | 5.11e-11 | 7.13e-10 | 3.65e-10 | 102 |
| hsa0414232 | Esophagus | ESCC | Lysosome | 102/4205 | 132/8465 | 5.11e-11 | 7.13e-10 | 3.65e-10 | 102 |
| hsa041422 | Liver | HCC | Lysosome | 100/4020 | 132/8465 | 2.32e-11 | 4.31e-10 | 2.40e-10 | 100 |
| hsa041423 | Liver | HCC | Lysosome | 100/4020 | 132/8465 | 2.32e-11 | 4.31e-10 | 2.40e-10 | 100 |
| Page: 1 |
Top |
Cell-cell communication analysis |
| Identification of potential cell-cell interactions between two cell types and their ligand-receptor pairs for different disease states |
| Ligand | Receptor | LRpair | Pathway | Tissue | Disease Stage |
| Page: 1 |
Top |
Single-cell gene regulatory network inference analysis |
| Find out the significant the regulons (TFs) and the target genes of each regulon across cell types for different disease states |
| TF | Cell Type | Tissue | Disease Stage | Target Gene | RSS | Regulon Activity |
| ∗The dot plots of a searched regulon are shown for all cell subpopulations in each disease state of each tissue based on the regulon specific score inferred using pySCENIC and by calculating the average expression. |
| Page: 1 |
Top |
Somatic mutation of malignant transformation related genes |
| Annotation of somatic variants for genes involved in malignant transformation |
| Hugo Symbol | Variant Class | Variant Classification | dbSNP RS | HGVSc | HGVSp | HGVSp Short | SWISSPROT | BIOTYPE | SIFT | PolyPhen | Tumor Sample Barcode | Tissue | Histology | Sex | Age | Stage | Therapy Types | Drugs | Outcome |
| AP4S1 | SNV | Missense_Mutation | c.296N>C | p.Ser99Thr | p.S99T | Q9Y587 | protein_coding | deleterious(0.01) | benign(0.107) | TCGA-AC-A23H-01 | Breast | breast invasive carcinoma | Female | >=65 | I/II | Unknown | Unknown | PD | |
| AP4S1 | SNV | Missense_Mutation | novel | c.347N>G | p.Glu116Gly | p.E116G | Q9Y587 | protein_coding | deleterious(0) | probably_damaging(0.999) | TCGA-2W-A8YY-01 | Cervix | cervical & endocervical cancer | Female | <65 | I/II | Chemotherapy | cisplatin | CR |
| AP4S1 | SNV | Missense_Mutation | rs768444730 | c.353N>G | p.Ser118Cys | p.S118C | Q9Y587 | protein_coding | tolerated(0.12) | benign(0) | TCGA-C5-A1BQ-01 | Cervix | cervical & endocervical cancer | Female | >=65 | III/IV | Chemotherapy | cisplatin | CR |
| AP4S1 | SNV | Missense_Mutation | rs768444730 | c.353N>G | p.Ser118Cys | p.S118C | Q9Y587 | protein_coding | tolerated(0.12) | benign(0) | TCGA-C5-A3HL-01 | Cervix | cervical & endocervical cancer | Female | >=65 | I/II | Unknown | Unknown | SD |
| AP4S1 | SNV | Missense_Mutation | rs183487893 | c.290N>A | p.Arg97Gln | p.R97Q | Q9Y587 | protein_coding | tolerated(0.07) | benign(0.02) | TCGA-IR-A3LA-01 | Cervix | cervical & endocervical cancer | Female | <65 | I/II | Chemotherapy | cisplatin | CR |
| AP4S1 | SNV | Missense_Mutation | novel | c.316A>G | p.Asn106Asp | p.N106D | Q9Y587 | protein_coding | deleterious(0) | benign(0.123) | TCGA-AA-3947-01 | Colorectum | colon adenocarcinoma | Female | <65 | I/II | Unknown | Unknown | SD |
| AP4S1 | SNV | Missense_Mutation | novel | c.10N>G | p.Phe4Val | p.F4V | Q9Y587 | protein_coding | deleterious(0) | probably_damaging(0.974) | TCGA-AA-A010-01 | Colorectum | colon adenocarcinoma | Female | <65 | I/II | Chemotherapy | folinic | CR |
| AP4S1 | insertion | Frame_Shift_Ins | novel | c.5_6insA | p.Phe4IlefsTer7 | p.F4Ifs*7 | Q9Y587 | protein_coding | TCGA-AU-6004-01 | Colorectum | colon adenocarcinoma | Female | >=65 | I/II | Unknown | Unknown | SD | ||
| AP4S1 | SNV | Missense_Mutation | novel | c.12N>A | p.Phe4Leu | p.F4L | Q9Y587 | protein_coding | deleterious(0.02) | probably_damaging(0.922) | TCGA-AJ-A3EK-01 | Endometrium | uterine corpus endometrioid carcinoma | Female | <65 | I/II | Chemotherapy | carboplatin | CR |
| AP4S1 | SNV | Missense_Mutation | novel | c.223G>A | p.Glu75Lys | p.E75K | Q9Y587 | protein_coding | deleterious(0) | probably_damaging(0.998) | TCGA-AJ-A3TW-01 | Endometrium | uterine corpus endometrioid carcinoma | Female | >=65 | I/II | Unknown | Unknown | SD |
| Page: 1 2 |
Top |
Related drugs of malignant transformation related genes |
| Identification of chemicals and drugs interact with genes involved in malignant transfromation |
| (DGIdb 4.0) |
| Entrez ID | Symbol | Category | Interaction Types | Drug Claim Name | Drug Name | PMIDs |
| Page: 1 |

Copyright 2023-Present -The University of Texas Health Science Center at Houston |