
|
|||||
|
 | |
| |
| |
| |
| |
| |
|
Gene: AP4M1 |
Gene summary for AP4M1 |
| Gene information | Species | Human | Gene symbol | AP4M1 | Gene ID | 9179 |
| Gene name | adaptor related protein complex 4 subunit mu 1 | |
| Gene Alias | CPSQ3 | |
| Cytomap | 7q22.1 | |
| Gene Type | protein-coding | GO ID | GO:0006605 | UniProtAcc | O00189 |
Top |
Malignant transformation analysis |
| Identification of the aberrant gene expression in precancerous and cancerous lesions by comparing the gene expression of stem-like cells in diseased tissues with normal stem cells |
| Entrez ID | Symbol | Replicates | Species | Organ | Tissue | Adj P-value | Log2FC | Malignancy |
| 9179 | AP4M1 | LZE4T | Human | Esophagus | ESCC | 1.64e-02 | 1.14e-01 | 0.0811 |
| 9179 | AP4M1 | LZE7T | Human | Esophagus | ESCC | 2.73e-11 | 5.78e-01 | 0.0667 |
| 9179 | AP4M1 | LZE20T | Human | Esophagus | ESCC | 4.43e-07 | 2.43e-01 | 0.0662 |
| 9179 | AP4M1 | LZE24T | Human | Esophagus | ESCC | 1.04e-04 | 1.43e-01 | 0.0596 |
| 9179 | AP4M1 | P1T-E | Human | Esophagus | ESCC | 2.32e-15 | 5.12e-01 | 0.0875 |
| 9179 | AP4M1 | P2T-E | Human | Esophagus | ESCC | 3.01e-38 | 6.55e-01 | 0.1177 |
| 9179 | AP4M1 | P4T-E | Human | Esophagus | ESCC | 1.63e-18 | 4.09e-01 | 0.1323 |
| 9179 | AP4M1 | P5T-E | Human | Esophagus | ESCC | 1.67e-05 | 1.78e-01 | 0.1327 |
| 9179 | AP4M1 | P8T-E | Human | Esophagus | ESCC | 3.81e-08 | 1.77e-01 | 0.0889 |
| 9179 | AP4M1 | P9T-E | Human | Esophagus | ESCC | 1.17e-10 | 2.56e-01 | 0.1131 |
| 9179 | AP4M1 | P10T-E | Human | Esophagus | ESCC | 2.08e-22 | 4.48e-01 | 0.116 |
| 9179 | AP4M1 | P11T-E | Human | Esophagus | ESCC | 2.82e-09 | 4.00e-01 | 0.1426 |
| 9179 | AP4M1 | P12T-E | Human | Esophagus | ESCC | 5.49e-16 | 3.20e-01 | 0.1122 |
| 9179 | AP4M1 | P15T-E | Human | Esophagus | ESCC | 9.90e-15 | 3.28e-01 | 0.1149 |
| 9179 | AP4M1 | P16T-E | Human | Esophagus | ESCC | 1.34e-28 | 6.42e-01 | 0.1153 |
| 9179 | AP4M1 | P17T-E | Human | Esophagus | ESCC | 4.09e-10 | 4.28e-01 | 0.1278 |
| 9179 | AP4M1 | P20T-E | Human | Esophagus | ESCC | 1.03e-27 | 5.14e-01 | 0.1124 |
| 9179 | AP4M1 | P21T-E | Human | Esophagus | ESCC | 7.79e-15 | 3.64e-01 | 0.1617 |
| 9179 | AP4M1 | P22T-E | Human | Esophagus | ESCC | 2.13e-11 | 2.59e-01 | 0.1236 |
| 9179 | AP4M1 | P23T-E | Human | Esophagus | ESCC | 2.23e-20 | 5.37e-01 | 0.108 |
| Page: 1 2 3 4 5 |
| Tissue | Expression Dynamics | Abbreviation |
| Esophagus | 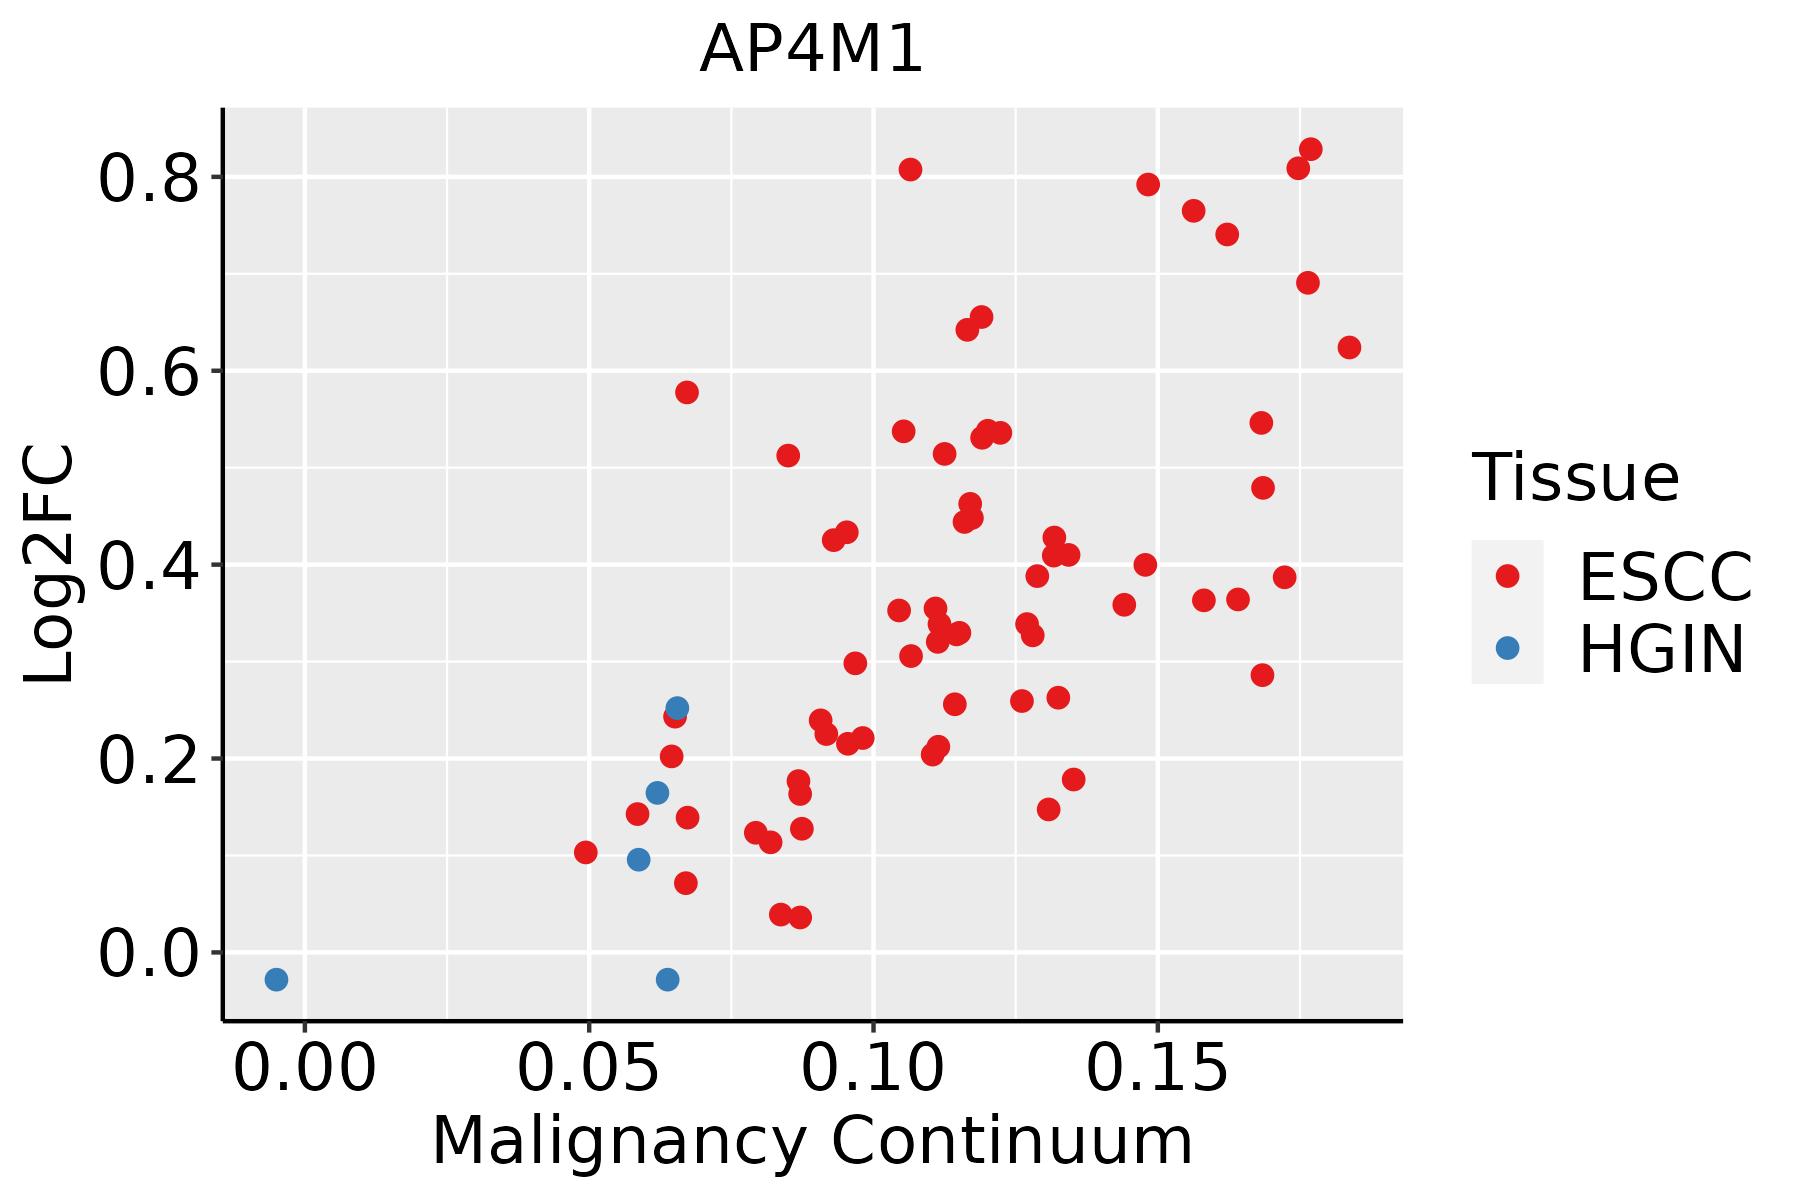 | ESCC: Esophageal squamous cell carcinoma |
| HGIN: High-grade intraepithelial neoplasias | ||
| LGIN: Low-grade intraepithelial neoplasias | ||
| Liver |  | HCC: Hepatocellular carcinoma |
| NAFLD: Non-alcoholic fatty liver disease | ||
| Oral Cavity | 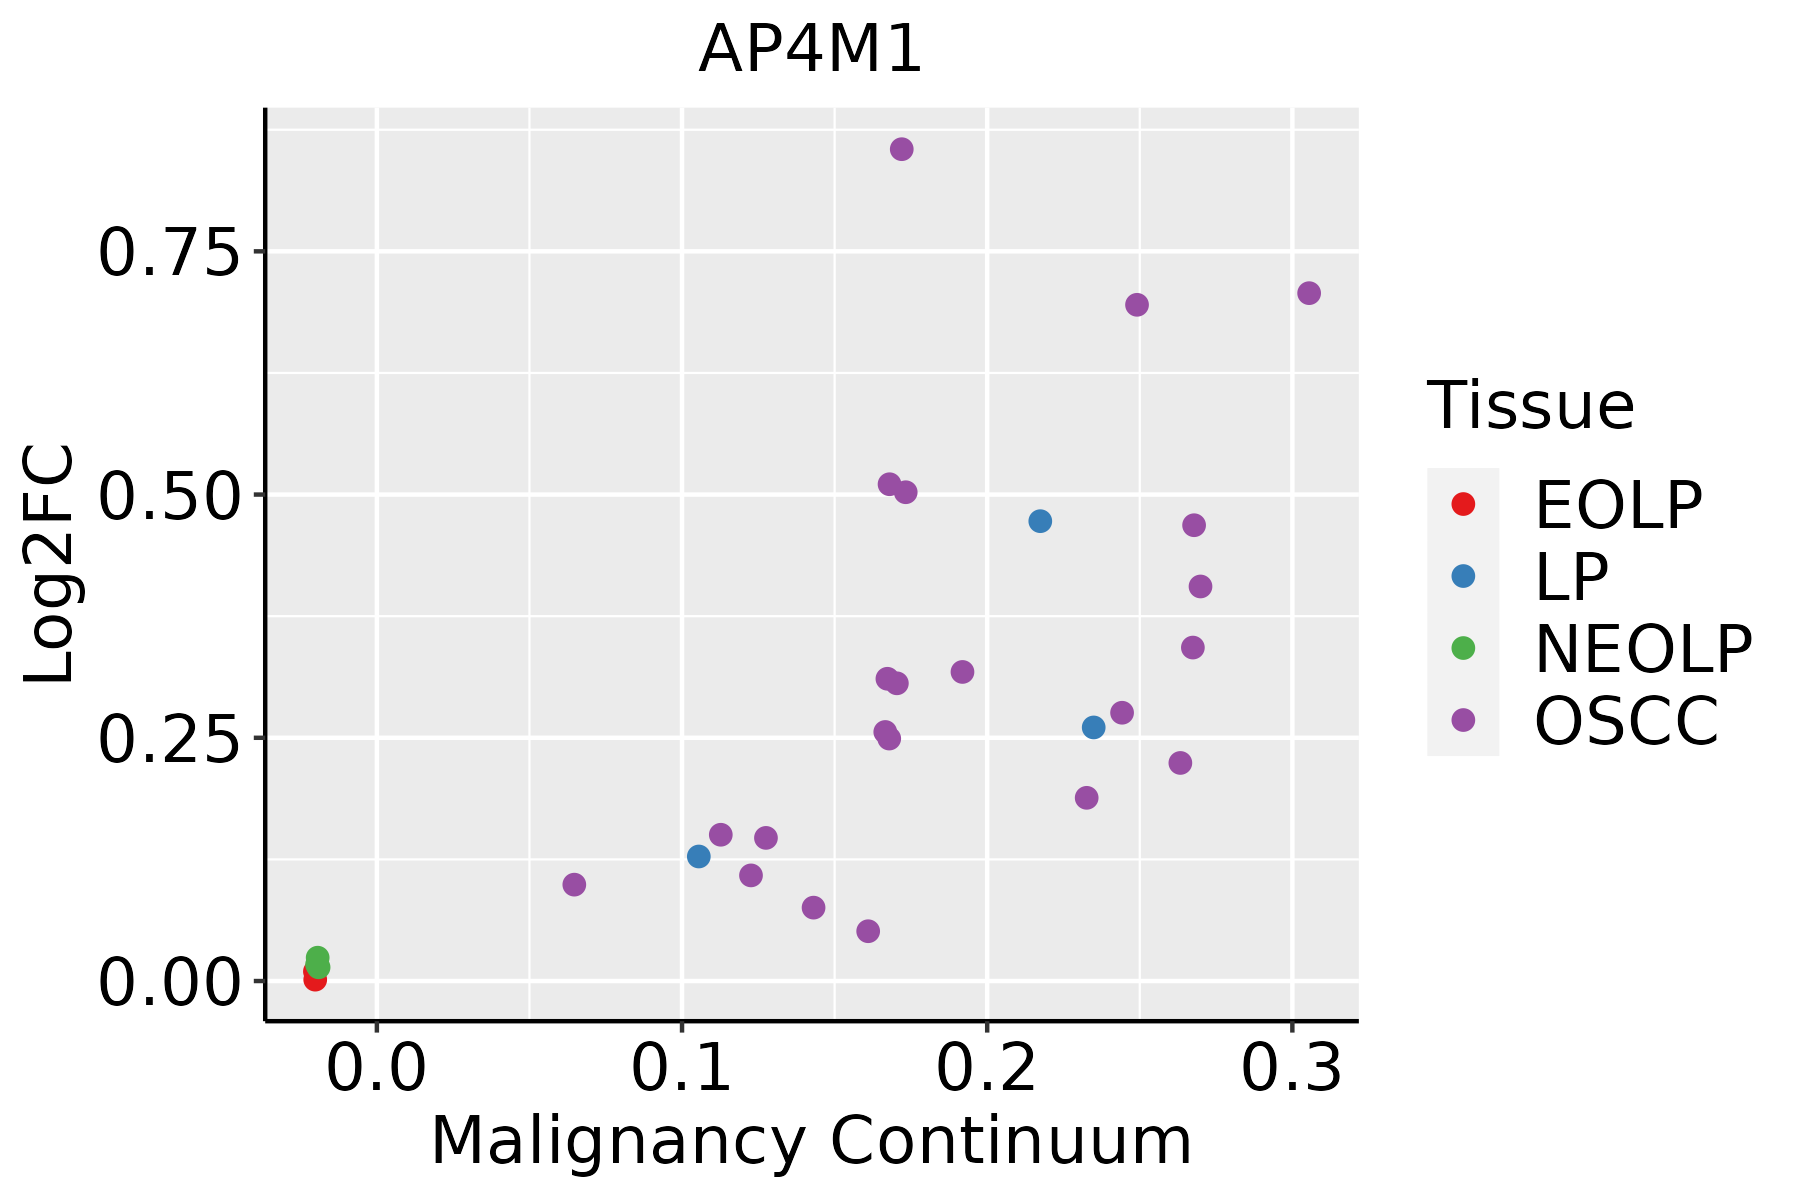 | EOLP: Erosive Oral lichen planus |
| LP: leukoplakia | ||
| NEOLP: Non-erosive oral lichen planus | ||
| OSCC: Oral squamous cell carcinoma |
| ∗log2FC in expression of this searched gene in stem-like cells from each diseased tissue sample relative to stem-like cells in normal samples in each tissue plotted against the malignancy continuum. Samples are colored based on if they are from different disease stage. |
Top |
Malignant transformation related pathway analysis |
| Find out the enriched GO biological processes and KEGG pathways involved in transition from healthy to precancer to cancer |
| Tissue | Disease Stage | Enriched GO biological Processes |
| Colorectum | AD |  |
| Colorectum | SER |  |
| Colorectum | MSS |  |
| Colorectum | MSI-H |  |
| Colorectum | FAP |  |
| ∗Top 15 enriched GO BP terms are showed in the bar plot of each disease state in each tissue. Each row represents a significant GO biological process which is colored according to the -log10(p.adjust). |
| Page: 1 2 3 4 5 6 7 8 9 |
| GO ID | Tissue | Disease Stage | Description | Gene Ratio | Bg Ratio | pvalue | p.adjust | Count |
| GO:0072594110 | Esophagus | ESCC | establishment of protein localization to organelle | 311/8552 | 422/18723 | 3.02e-32 | 2.13e-29 | 311 |
| GO:004819318 | Esophagus | ESCC | Golgi vesicle transport | 231/8552 | 296/18723 | 1.82e-30 | 9.63e-28 | 231 |
| GO:0006605111 | Esophagus | ESCC | protein targeting | 229/8552 | 314/18723 | 4.93e-23 | 1.01e-20 | 229 |
| GO:000703417 | Esophagus | ESCC | vacuolar transport | 119/8552 | 157/18723 | 1.16e-14 | 6.30e-13 | 119 |
| GO:001648210 | Esophagus | ESCC | cytosolic transport | 124/8552 | 168/18723 | 9.69e-14 | 4.69e-12 | 124 |
| GO:199077819 | Esophagus | ESCC | protein localization to cell periphery | 217/8552 | 333/18723 | 4.08e-13 | 1.88e-11 | 217 |
| GO:000689215 | Esophagus | ESCC | post-Golgi vesicle-mediated transport | 82/8552 | 104/18723 | 4.00e-12 | 1.55e-10 | 82 |
| GO:00070419 | Esophagus | ESCC | lysosomal transport | 83/8552 | 114/18723 | 3.52e-09 | 7.41e-08 | 83 |
| GO:00718069 | Esophagus | ESCC | protein transmembrane transport | 47/8552 | 59/18723 | 9.02e-08 | 1.51e-06 | 47 |
| GO:00726659 | Esophagus | ESCC | protein localization to vacuole | 52/8552 | 67/18723 | 9.14e-08 | 1.52e-06 | 52 |
| GO:00066238 | Esophagus | ESCC | protein targeting to vacuole | 31/8552 | 37/18723 | 1.95e-06 | 2.26e-05 | 31 |
| GO:00726668 | Esophagus | ESCC | establishment of protein localization to vacuole | 37/8552 | 49/18723 | 2.05e-05 | 1.78e-04 | 37 |
| GO:00066226 | Esophagus | ESCC | protein targeting to lysosome | 20/8552 | 23/18723 | 4.97e-05 | 3.86e-04 | 20 |
| GO:00614626 | Esophagus | ESCC | protein localization to lysosome | 34/8552 | 46/18723 | 9.39e-05 | 6.70e-04 | 34 |
| GO:00068963 | Esophagus | ESCC | Golgi to vacuole transport | 16/8552 | 20/18723 | 1.85e-03 | 8.40e-03 | 16 |
| GO:00068953 | Esophagus | ESCC | Golgi to endosome transport | 13/8552 | 17/18723 | 1.00e-02 | 3.42e-02 | 13 |
| GO:004819311 | Liver | Cirrhotic | Golgi vesicle transport | 153/4634 | 296/18723 | 1.02e-23 | 6.43e-21 | 153 |
| GO:007259412 | Liver | Cirrhotic | establishment of protein localization to organelle | 189/4634 | 422/18723 | 1.01e-19 | 2.45e-17 | 189 |
| GO:00066057 | Liver | Cirrhotic | protein targeting | 148/4634 | 314/18723 | 3.86e-18 | 6.20e-16 | 148 |
| GO:199077811 | Liver | Cirrhotic | protein localization to cell periphery | 135/4634 | 333/18723 | 1.18e-10 | 6.21e-09 | 135 |
| Page: 1 2 3 4 |
| Pathway ID | Tissue | Disease Stage | Description | Gene Ratio | Bg Ratio | pvalue | p.adjust | qvalue | Count |
| hsa0414222 | Esophagus | ESCC | Lysosome | 102/4205 | 132/8465 | 5.11e-11 | 7.13e-10 | 3.65e-10 | 102 |
| hsa0414232 | Esophagus | ESCC | Lysosome | 102/4205 | 132/8465 | 5.11e-11 | 7.13e-10 | 3.65e-10 | 102 |
| hsa041424 | Liver | Cirrhotic | Lysosome | 68/2530 | 132/8465 | 1.34e-07 | 1.97e-06 | 1.21e-06 | 68 |
| hsa0414211 | Liver | Cirrhotic | Lysosome | 68/2530 | 132/8465 | 1.34e-07 | 1.97e-06 | 1.21e-06 | 68 |
| hsa041422 | Liver | HCC | Lysosome | 100/4020 | 132/8465 | 2.32e-11 | 4.31e-10 | 2.40e-10 | 100 |
| hsa041423 | Liver | HCC | Lysosome | 100/4020 | 132/8465 | 2.32e-11 | 4.31e-10 | 2.40e-10 | 100 |
| hsa041425 | Oral cavity | OSCC | Lysosome | 87/3704 | 132/8465 | 1.97e-07 | 1.35e-06 | 6.86e-07 | 87 |
| hsa0414212 | Oral cavity | OSCC | Lysosome | 87/3704 | 132/8465 | 1.97e-07 | 1.35e-06 | 6.86e-07 | 87 |
| hsa0414221 | Oral cavity | LP | Lysosome | 67/2418 | 132/8465 | 5.13e-08 | 7.77e-07 | 5.01e-07 | 67 |
| hsa0414231 | Oral cavity | LP | Lysosome | 67/2418 | 132/8465 | 5.13e-08 | 7.77e-07 | 5.01e-07 | 67 |
| Page: 1 |
Top |
Cell-cell communication analysis |
| Identification of potential cell-cell interactions between two cell types and their ligand-receptor pairs for different disease states |
| Ligand | Receptor | LRpair | Pathway | Tissue | Disease Stage |
| Page: 1 |
Top |
Single-cell gene regulatory network inference analysis |
| Find out the significant the regulons (TFs) and the target genes of each regulon across cell types for different disease states |
| TF | Cell Type | Tissue | Disease Stage | Target Gene | RSS | Regulon Activity |
| ∗The dot plots of a searched regulon are shown for all cell subpopulations in each disease state of each tissue based on the regulon specific score inferred using pySCENIC and by calculating the average expression. |
| Page: 1 |
Top |
Somatic mutation of malignant transformation related genes |
| Annotation of somatic variants for genes involved in malignant transformation |
| Hugo Symbol | Variant Class | Variant Classification | dbSNP RS | HGVSc | HGVSp | HGVSp Short | SWISSPROT | BIOTYPE | SIFT | PolyPhen | Tumor Sample Barcode | Tissue | Histology | Sex | Age | Stage | Therapy Types | Drugs | Outcome |
| AP4M1 | SNV | Missense_Mutation | novel | c.472N>C | p.Glu158Gln | p.E158Q | O00189 | protein_coding | tolerated(0.09) | benign(0.288) | TCGA-A1-A0SI-01 | Breast | breast invasive carcinoma | Female | <65 | I/II | Unknown | Unknown | SD |
| AP4M1 | SNV | Missense_Mutation | c.475N>G | p.Thr159Ala | p.T159A | O00189 | protein_coding | tolerated(0.07) | possibly_damaging(0.836) | TCGA-AO-A03V-01 | Breast | breast invasive carcinoma | Female | <65 | I/II | Chemotherapy | fluorouracil | SD | |
| AP4M1 | insertion | Frame_Shift_Ins | novel | c.962_963insAGCCGAGATCACGCCACTGCCAGCCTGG | p.Leu322AlafsTer43 | p.L322Afs*43 | O00189 | protein_coding | TCGA-A7-A0CJ-01 | Breast | breast invasive carcinoma | Female | <65 | I/II | Chemotherapy | cytoxan | SD | ||
| AP4M1 | deletion | Frame_Shift_Del | novel | c.60delN | p.Arg21AlafsTer17 | p.R21Afs*17 | O00189 | protein_coding | TCGA-EW-A2FV-01 | Breast | breast invasive carcinoma | Female | <65 | III/IV | Chemotherapy | docetaxel | SD | ||
| AP4M1 | SNV | Missense_Mutation | novel | c.1280N>T | p.Ala427Val | p.A427V | O00189 | protein_coding | deleterious(0.01) | benign(0) | TCGA-AZ-4315-01 | Colorectum | colon adenocarcinoma | Male | <65 | I/II | Unknown | Unknown | SD |
| AP4M1 | SNV | Missense_Mutation | rs757649099 | c.878N>T | p.Pro293Leu | p.P293L | O00189 | protein_coding | tolerated(0.13) | benign(0.406) | TCGA-CM-6171-01 | Colorectum | colon adenocarcinoma | Female | >=65 | I/II | Unknown | Unknown | SD |
| AP4M1 | SNV | Missense_Mutation | c.867N>A | p.Asp289Glu | p.D289E | O00189 | protein_coding | tolerated(0.54) | benign(0.001) | TCGA-D5-6537-01 | Colorectum | colon adenocarcinoma | Male | <65 | III/IV | Unknown | Unknown | PD | |
| AP4M1 | SNV | Missense_Mutation | rs754386660 | c.917N>A | p.Arg306Gln | p.R306Q | O00189 | protein_coding | tolerated(0.64) | benign(0) | TCGA-QG-A5YX-01 | Colorectum | colon adenocarcinoma | Female | <65 | I/II | Chemotherapy | xeloda | CR |
| AP4M1 | SNV | Missense_Mutation | novel | c.583T>G | p.Leu195Val | p.L195V | O00189 | protein_coding | deleterious(0.01) | benign(0.248) | TCGA-F5-6814-01 | Colorectum | rectum adenocarcinoma | Male | <65 | I/II | Unknown | Unknown | SD |
| AP4M1 | insertion | Frame_Shift_Ins | novel | c.566dupT | p.Leu189PhefsTer14 | p.L189Ffs*14 | O00189 | protein_coding | TCGA-WS-AB45-01 | Colorectum | colon adenocarcinoma | Female | <65 | I/II | Unknown | Unknown | SD |
| Page: 1 2 3 4 5 6 |
Top |
Related drugs of malignant transformation related genes |
| Identification of chemicals and drugs interact with genes involved in malignant transfromation |
| (DGIdb 4.0) |
| Entrez ID | Symbol | Category | Interaction Types | Drug Claim Name | Drug Name | PMIDs |
| Page: 1 |

Copyright 2023-Present -The University of Texas Health Science Center at Houston |