
|
|||||
|
 | |
| |
| |
| |
| |
| |
|
Gene: AP3M1 |
Gene summary for AP3M1 |
| Gene information | Species | Human | Gene symbol | AP3M1 | Gene ID | 26985 |
| Gene name | adaptor related protein complex 3 subunit mu 1 | |
| Gene Alias | AP3M1 | |
| Cytomap | 10q22.2 | |
| Gene Type | protein-coding | GO ID | GO:0006605 | UniProtAcc | A0A024QZR5 |
Top |
Malignant transformation analysis |
| Identification of the aberrant gene expression in precancerous and cancerous lesions by comparing the gene expression of stem-like cells in diseased tissues with normal stem cells |
| Entrez ID | Symbol | Replicates | Species | Organ | Tissue | Adj P-value | Log2FC | Malignancy |
| 26985 | AP3M1 | LZE4T | Human | Esophagus | ESCC | 3.18e-11 | 2.48e-01 | 0.0811 |
| 26985 | AP3M1 | LZE7T | Human | Esophagus | ESCC | 2.59e-10 | 2.75e-01 | 0.0667 |
| 26985 | AP3M1 | LZE8T | Human | Esophagus | ESCC | 3.94e-04 | 1.07e-01 | 0.067 |
| 26985 | AP3M1 | LZE20T | Human | Esophagus | ESCC | 3.56e-02 | 1.16e-01 | 0.0662 |
| 26985 | AP3M1 | LZE24T | Human | Esophagus | ESCC | 3.54e-19 | 3.73e-01 | 0.0596 |
| 26985 | AP3M1 | LZE6T | Human | Esophagus | ESCC | 6.80e-05 | 1.91e-01 | 0.0845 |
| 26985 | AP3M1 | P1T-E | Human | Esophagus | ESCC | 1.03e-06 | 3.39e-01 | 0.0875 |
| 26985 | AP3M1 | P2T-E | Human | Esophagus | ESCC | 1.48e-27 | 3.44e-01 | 0.1177 |
| 26985 | AP3M1 | P4T-E | Human | Esophagus | ESCC | 3.21e-14 | 3.15e-01 | 0.1323 |
| 26985 | AP3M1 | P5T-E | Human | Esophagus | ESCC | 3.60e-14 | 2.72e-01 | 0.1327 |
| 26985 | AP3M1 | P8T-E | Human | Esophagus | ESCC | 2.98e-15 | 2.71e-01 | 0.0889 |
| 26985 | AP3M1 | P9T-E | Human | Esophagus | ESCC | 2.35e-12 | 1.03e-01 | 0.1131 |
| 26985 | AP3M1 | P10T-E | Human | Esophagus | ESCC | 1.80e-17 | 1.60e-01 | 0.116 |
| 26985 | AP3M1 | P11T-E | Human | Esophagus | ESCC | 2.53e-09 | 4.67e-01 | 0.1426 |
| 26985 | AP3M1 | P12T-E | Human | Esophagus | ESCC | 9.92e-16 | 3.40e-01 | 0.1122 |
| 26985 | AP3M1 | P15T-E | Human | Esophagus | ESCC | 4.06e-24 | 3.74e-01 | 0.1149 |
| 26985 | AP3M1 | P16T-E | Human | Esophagus | ESCC | 7.32e-21 | 3.17e-01 | 0.1153 |
| 26985 | AP3M1 | P17T-E | Human | Esophagus | ESCC | 2.07e-02 | 1.14e-01 | 0.1278 |
| 26985 | AP3M1 | P19T-E | Human | Esophagus | ESCC | 3.37e-05 | 4.31e-01 | 0.1662 |
| 26985 | AP3M1 | P20T-E | Human | Esophagus | ESCC | 9.49e-17 | 3.62e-01 | 0.1124 |
| Page: 1 2 3 4 5 |
| Tissue | Expression Dynamics | Abbreviation |
| Esophagus |  | ESCC: Esophageal squamous cell carcinoma |
| HGIN: High-grade intraepithelial neoplasias | ||
| LGIN: Low-grade intraepithelial neoplasias | ||
| Liver |  | HCC: Hepatocellular carcinoma |
| NAFLD: Non-alcoholic fatty liver disease | ||
| Oral Cavity | 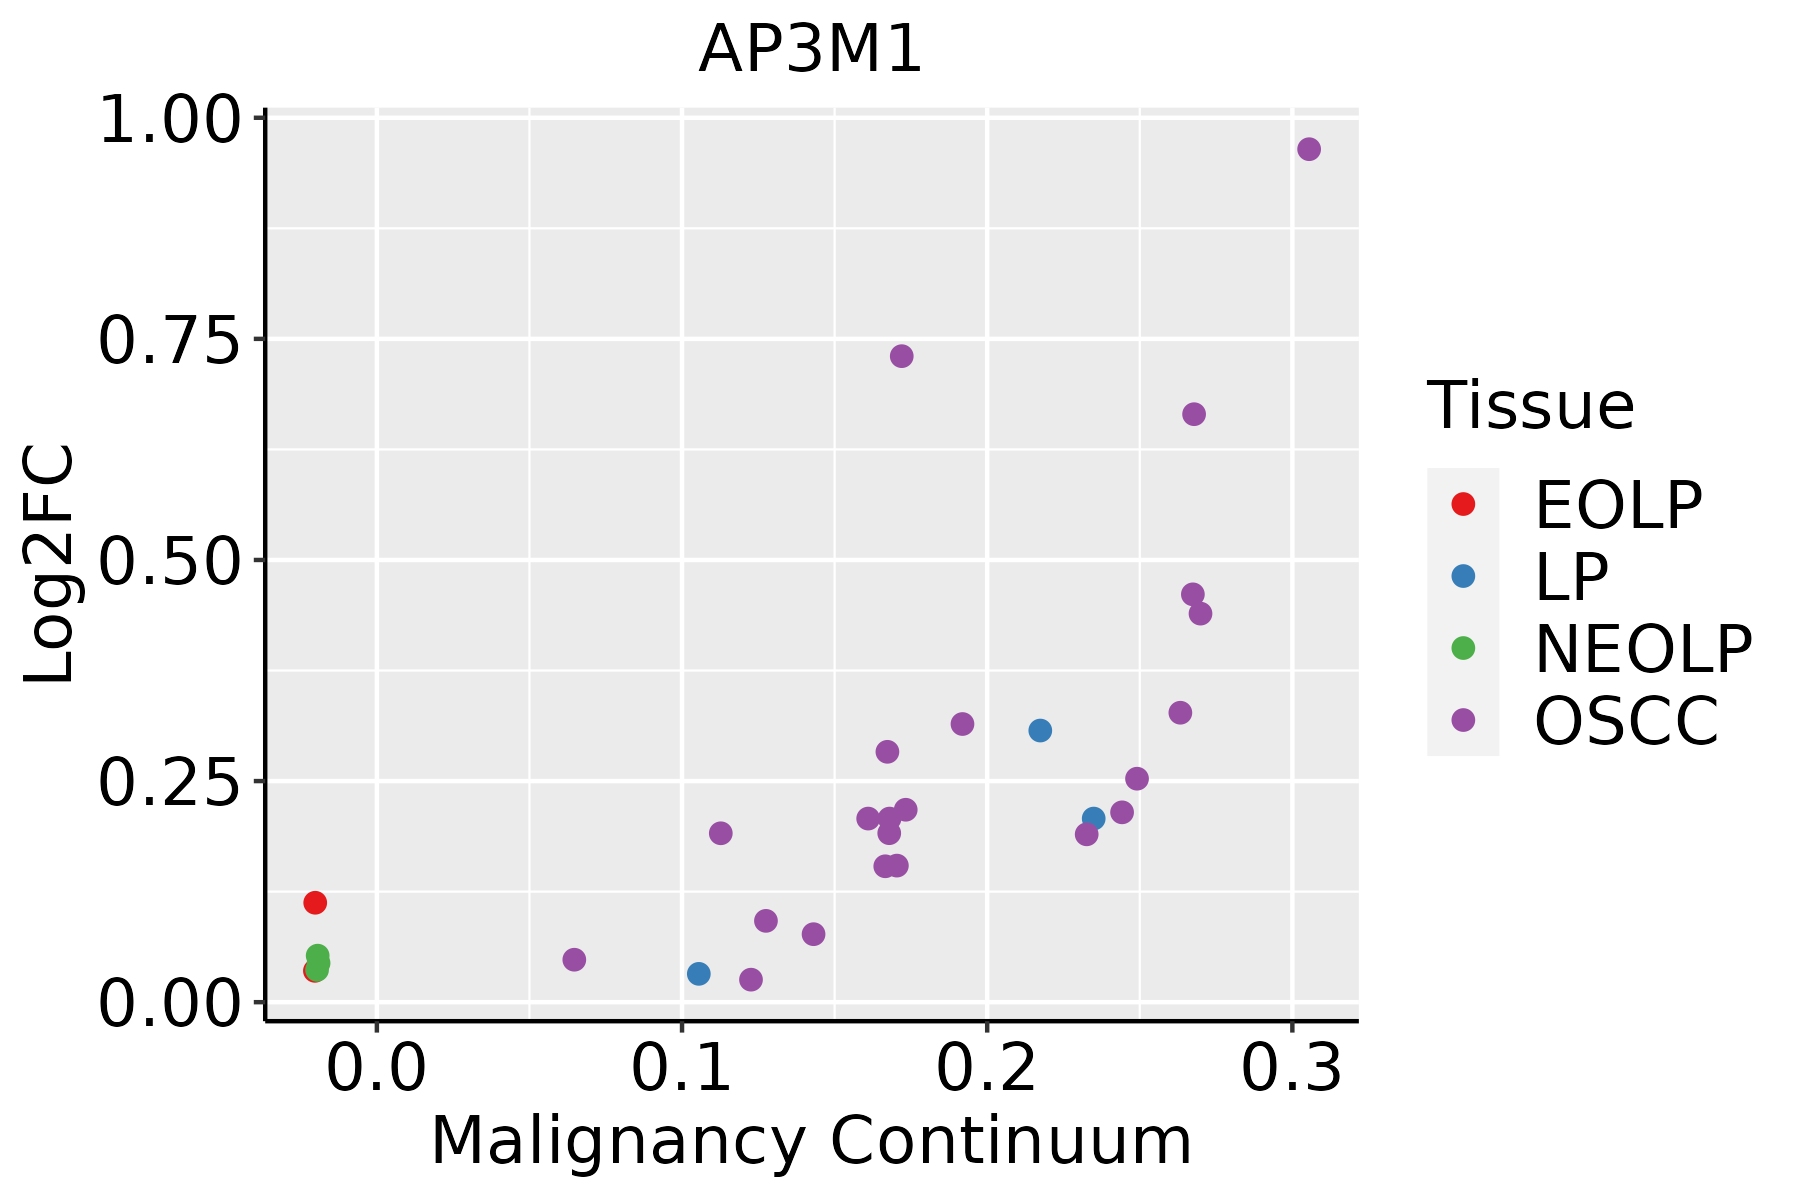 | EOLP: Erosive Oral lichen planus |
| LP: leukoplakia | ||
| NEOLP: Non-erosive oral lichen planus | ||
| OSCC: Oral squamous cell carcinoma |
| ∗log2FC in expression of this searched gene in stem-like cells from each diseased tissue sample relative to stem-like cells in normal samples in each tissue plotted against the malignancy continuum. Samples are colored based on if they are from different disease stage. |
Top |
Malignant transformation related pathway analysis |
| Find out the enriched GO biological processes and KEGG pathways involved in transition from healthy to precancer to cancer |
| Tissue | Disease Stage | Enriched GO biological Processes |
| Colorectum | AD |  |
| Colorectum | SER |  |
| Colorectum | MSS |  |
| Colorectum | MSI-H |  |
| Colorectum | FAP |  |
| ∗Top 15 enriched GO BP terms are showed in the bar plot of each disease state in each tissue. Each row represents a significant GO biological process which is colored according to the -log10(p.adjust). |
| Page: 1 2 3 4 5 6 7 8 9 |
| GO ID | Tissue | Disease Stage | Description | Gene Ratio | Bg Ratio | pvalue | p.adjust | Count |
| GO:0072594110 | Esophagus | ESCC | establishment of protein localization to organelle | 311/8552 | 422/18723 | 3.02e-32 | 2.13e-29 | 311 |
| GO:0006605111 | Esophagus | ESCC | protein targeting | 229/8552 | 314/18723 | 4.93e-23 | 1.01e-20 | 229 |
| GO:005165617 | Esophagus | ESCC | establishment of organelle localization | 273/8552 | 390/18723 | 9.13e-23 | 1.81e-20 | 273 |
| GO:000703417 | Esophagus | ESCC | vacuolar transport | 119/8552 | 157/18723 | 1.16e-14 | 6.30e-13 | 119 |
| GO:005165016 | Esophagus | ESCC | establishment of vesicle localization | 114/8552 | 161/18723 | 8.20e-11 | 2.53e-09 | 114 |
| GO:003070518 | Esophagus | ESCC | cytoskeleton-dependent intracellular transport | 133/8552 | 195/18723 | 1.48e-10 | 4.27e-09 | 133 |
| GO:001097013 | Esophagus | ESCC | transport along microtubule | 107/8552 | 155/18723 | 3.17e-09 | 6.80e-08 | 107 |
| GO:00070419 | Esophagus | ESCC | lysosomal transport | 83/8552 | 114/18723 | 3.52e-09 | 7.41e-08 | 83 |
| GO:005164815 | Esophagus | ESCC | vesicle localization | 119/8552 | 177/18723 | 5.16e-09 | 1.08e-07 | 119 |
| GO:00723846 | Esophagus | ESCC | organelle transport along microtubule | 65/8552 | 85/18723 | 6.61e-09 | 1.35e-07 | 65 |
| GO:000808810 | Esophagus | ESCC | axo-dendritic transport | 58/8552 | 75/18723 | 2.09e-08 | 4.02e-07 | 58 |
| GO:00726659 | Esophagus | ESCC | protein localization to vacuole | 52/8552 | 67/18723 | 9.14e-08 | 1.52e-06 | 52 |
| GO:00989304 | Esophagus | ESCC | axonal transport | 49/8552 | 64/18723 | 4.54e-07 | 6.15e-06 | 49 |
| GO:00066238 | Esophagus | ESCC | protein targeting to vacuole | 31/8552 | 37/18723 | 1.95e-06 | 2.26e-05 | 31 |
| GO:00474962 | Esophagus | ESCC | vesicle transport along microtubule | 36/8552 | 47/18723 | 1.53e-05 | 1.38e-04 | 36 |
| GO:00726668 | Esophagus | ESCC | establishment of protein localization to vacuole | 37/8552 | 49/18723 | 2.05e-05 | 1.78e-04 | 37 |
| GO:00991114 | Esophagus | ESCC | microtubule-based transport | 115/8552 | 190/18723 | 2.54e-05 | 2.15e-04 | 115 |
| GO:00080892 | Esophagus | ESCC | anterograde axonal transport | 37/8552 | 50/18723 | 4.42e-05 | 3.51e-04 | 37 |
| GO:00066226 | Esophagus | ESCC | protein targeting to lysosome | 20/8552 | 23/18723 | 4.97e-05 | 3.86e-04 | 20 |
| GO:00995185 | Esophagus | ESCC | vesicle cytoskeletal trafficking | 50/8552 | 73/18723 | 6.75e-05 | 5.12e-04 | 50 |
| Page: 1 2 3 4 |
| Pathway ID | Tissue | Disease Stage | Description | Gene Ratio | Bg Ratio | pvalue | p.adjust | qvalue | Count |
| hsa0414222 | Esophagus | ESCC | Lysosome | 102/4205 | 132/8465 | 5.11e-11 | 7.13e-10 | 3.65e-10 | 102 |
| hsa0414232 | Esophagus | ESCC | Lysosome | 102/4205 | 132/8465 | 5.11e-11 | 7.13e-10 | 3.65e-10 | 102 |
| hsa041422 | Liver | HCC | Lysosome | 100/4020 | 132/8465 | 2.32e-11 | 4.31e-10 | 2.40e-10 | 100 |
| hsa041423 | Liver | HCC | Lysosome | 100/4020 | 132/8465 | 2.32e-11 | 4.31e-10 | 2.40e-10 | 100 |
| hsa041425 | Oral cavity | OSCC | Lysosome | 87/3704 | 132/8465 | 1.97e-07 | 1.35e-06 | 6.86e-07 | 87 |
| hsa0414212 | Oral cavity | OSCC | Lysosome | 87/3704 | 132/8465 | 1.97e-07 | 1.35e-06 | 6.86e-07 | 87 |
| Page: 1 |
Top |
Cell-cell communication analysis |
| Identification of potential cell-cell interactions between two cell types and their ligand-receptor pairs for different disease states |
| Ligand | Receptor | LRpair | Pathway | Tissue | Disease Stage |
| Page: 1 |
Top |
Single-cell gene regulatory network inference analysis |
| Find out the significant the regulons (TFs) and the target genes of each regulon across cell types for different disease states |
| TF | Cell Type | Tissue | Disease Stage | Target Gene | RSS | Regulon Activity |
| ∗The dot plots of a searched regulon are shown for all cell subpopulations in each disease state of each tissue based on the regulon specific score inferred using pySCENIC and by calculating the average expression. |
| Page: 1 |
Top |
Somatic mutation of malignant transformation related genes |
| Annotation of somatic variants for genes involved in malignant transformation |
| Hugo Symbol | Variant Class | Variant Classification | dbSNP RS | HGVSc | HGVSp | HGVSp Short | SWISSPROT | BIOTYPE | SIFT | PolyPhen | Tumor Sample Barcode | Tissue | Histology | Sex | Age | Stage | Therapy Types | Drugs | Outcome |
| AP3M1 | SNV | Missense_Mutation | novel | c.511N>A | p.Gly171Arg | p.G171R | Q9Y2T2 | protein_coding | deleterious(0.01) | benign(0.254) | TCGA-A7-A4SA-01 | Breast | breast invasive carcinoma | Female | <65 | I/II | Chemotherapy | doxorubicin | CR |
| AP3M1 | SNV | Missense_Mutation | novel | c.734N>G | p.Glu245Gly | p.E245G | Q9Y2T2 | protein_coding | deleterious(0) | probably_damaging(0.948) | TCGA-A8-A06Q-01 | Breast | breast invasive carcinoma | Female | <65 | III/IV | Unknown | Unknown | SD |
| AP3M1 | SNV | Missense_Mutation | rs536850333 | c.119N>T | p.Ala40Val | p.A40V | Q9Y2T2 | protein_coding | tolerated(0.55) | benign(0.005) | TCGA-A8-A09Z-01 | Breast | breast invasive carcinoma | Female | >=65 | I/II | Unknown | Unknown | SD |
| AP3M1 | SNV | Missense_Mutation | rs535082272 | c.806N>G | p.Leu269Arg | p.L269R | Q9Y2T2 | protein_coding | tolerated(0.2) | possibly_damaging(0.707) | TCGA-AN-A046-01 | Breast | breast invasive carcinoma | Female | >=65 | I/II | Unknown | Unknown | SD |
| AP3M1 | SNV | Missense_Mutation | novel | c.109G>C | p.Glu37Gln | p.E37Q | Q9Y2T2 | protein_coding | tolerated(0.43) | benign(0.014) | TCGA-BH-A2L8-01 | Breast | breast invasive carcinoma | Female | <65 | I/II | Chemotherapy | cytoxan | CR |
| AP3M1 | SNV | Missense_Mutation | c.973N>G | p.Pro325Ala | p.P325A | Q9Y2T2 | protein_coding | tolerated(1) | benign(0.003) | TCGA-E2-A1L6-01 | Breast | breast invasive carcinoma | Female | <65 | I/II | Chemotherapy | cyclophosphamide | SD | |
| AP3M1 | SNV | Missense_Mutation | novel | c.467N>T | p.Thr156Ile | p.T156I | Q9Y2T2 | protein_coding | tolerated(0.13) | benign(0.022) | TCGA-EW-A1IZ-01 | Breast | breast invasive carcinoma | Female | <65 | III/IV | Chemotherapy | taxotere | SD |
| AP3M1 | insertion | Frame_Shift_Ins | novel | c.870_871insGTCTTTTTAAATCTTTTTTG | p.Phe291ValfsTer10 | p.F291Vfs*10 | Q9Y2T2 | protein_coding | TCGA-A2-A0EQ-01 | Breast | breast invasive carcinoma | Female | <65 | I/II | Chemotherapy | adriamycin | SD | ||
| AP3M1 | SNV | Missense_Mutation | c.359N>A | p.Gly120Glu | p.G120E | Q9Y2T2 | protein_coding | deleterious(0) | probably_damaging(0.998) | TCGA-C5-A1BQ-01 | Cervix | cervical & endocervical cancer | Female | >=65 | III/IV | Chemotherapy | cisplatin | CR | |
| AP3M1 | SNV | Missense_Mutation | c.359N>A | p.Gly120Glu | p.G120E | Q9Y2T2 | protein_coding | deleterious(0) | probably_damaging(0.998) | TCGA-C5-A3HL-01 | Cervix | cervical & endocervical cancer | Female | >=65 | I/II | Unknown | Unknown | SD |
| Page: 1 2 3 4 |
Top |
Related drugs of malignant transformation related genes |
| Identification of chemicals and drugs interact with genes involved in malignant transfromation |
| (DGIdb 4.0) |
| Entrez ID | Symbol | Category | Interaction Types | Drug Claim Name | Drug Name | PMIDs |
| Page: 1 |

Copyright 2023-Present -The University of Texas Health Science Center at Houston |