
|
|||||
|
 | |
| |
| |
| |
| |
| |
|
Gene: AP3D1 |
Gene summary for AP3D1 |
| Gene information | Species | Human | Gene symbol | AP3D1 | Gene ID | 8943 |
| Gene name | adaptor related protein complex 3 subunit delta 1 | |
| Gene Alias | ADTD | |
| Cytomap | 19p13.3 | |
| Gene Type | protein-coding | GO ID | GO:0001775 | UniProtAcc | O14617 |
Top |
Malignant transformation analysis |
| Identification of the aberrant gene expression in precancerous and cancerous lesions by comparing the gene expression of stem-like cells in diseased tissues with normal stem cells |
| Entrez ID | Symbol | Replicates | Species | Organ | Tissue | Adj P-value | Log2FC | Malignancy |
| 8943 | AP3D1 | HTA11_3410_2000001011 | Human | Colorectum | AD | 2.75e-03 | 1.71e-01 | 0.0155 |
| 8943 | AP3D1 | HTA11_2487_2000001011 | Human | Colorectum | SER | 3.44e-06 | 3.61e-01 | -0.1808 |
| 8943 | AP3D1 | HTA11_1938_2000001011 | Human | Colorectum | AD | 1.13e-05 | 4.34e-01 | -0.0811 |
| 8943 | AP3D1 | HTA11_78_2000001011 | Human | Colorectum | AD | 1.62e-02 | 3.14e-01 | -0.1088 |
| 8943 | AP3D1 | HTA11_347_2000001011 | Human | Colorectum | AD | 1.09e-20 | 6.45e-01 | -0.1954 |
| 8943 | AP3D1 | HTA11_411_2000001011 | Human | Colorectum | SER | 2.29e-09 | 1.03e+00 | -0.2602 |
| 8943 | AP3D1 | HTA11_3361_2000001011 | Human | Colorectum | AD | 3.00e-03 | 4.72e-01 | -0.1207 |
| 8943 | AP3D1 | HTA11_83_2000001011 | Human | Colorectum | SER | 2.68e-07 | 5.06e-01 | -0.1526 |
| 8943 | AP3D1 | HTA11_696_2000001011 | Human | Colorectum | AD | 2.89e-12 | 5.60e-01 | -0.1464 |
| 8943 | AP3D1 | HTA11_866_2000001011 | Human | Colorectum | AD | 1.76e-09 | 4.48e-01 | -0.1001 |
| 8943 | AP3D1 | HTA11_1391_2000001011 | Human | Colorectum | AD | 8.11e-19 | 8.98e-01 | -0.059 |
| 8943 | AP3D1 | HTA11_546_2000001011 | Human | Colorectum | AD | 2.23e-04 | 4.42e-01 | -0.0842 |
| 8943 | AP3D1 | HTA11_866_3004761011 | Human | Colorectum | AD | 3.95e-06 | 3.28e-01 | 0.096 |
| 8943 | AP3D1 | HTA11_4255_2000001011 | Human | Colorectum | SER | 5.04e-03 | 5.56e-01 | 0.0446 |
| 8943 | AP3D1 | HTA11_7696_3000711011 | Human | Colorectum | AD | 7.83e-16 | 6.81e-01 | 0.0674 |
| 8943 | AP3D1 | HTA11_6818_2000001011 | Human | Colorectum | AD | 6.97e-03 | 4.55e-01 | 0.0112 |
| 8943 | AP3D1 | HTA11_99999970781_79442 | Human | Colorectum | MSS | 5.97e-03 | 2.65e-01 | 0.294 |
| 8943 | AP3D1 | HTA11_99999965104_69814 | Human | Colorectum | MSS | 3.82e-04 | 3.74e-01 | 0.281 |
| 8943 | AP3D1 | HTA11_99999971662_82457 | Human | Colorectum | MSS | 9.80e-23 | 8.19e-01 | 0.3859 |
| 8943 | AP3D1 | HTA11_99999973899_84307 | Human | Colorectum | MSS | 1.30e-05 | 4.98e-01 | 0.2585 |
| Page: 1 2 3 4 5 6 7 8 9 |
| Tissue | Expression Dynamics | Abbreviation |
| Colorectum (GSE201348) |  | FAP: Familial adenomatous polyposis |
| CRC: Colorectal cancer | ||
| Colorectum (HTA11) |  | AD: Adenomas |
| SER: Sessile serrated lesions | ||
| MSI-H: Microsatellite-high colorectal cancer | ||
| MSS: Microsatellite stable colorectal cancer | ||
| Esophagus |  | ESCC: Esophageal squamous cell carcinoma |
| HGIN: High-grade intraepithelial neoplasias | ||
| LGIN: Low-grade intraepithelial neoplasias | ||
| Liver | 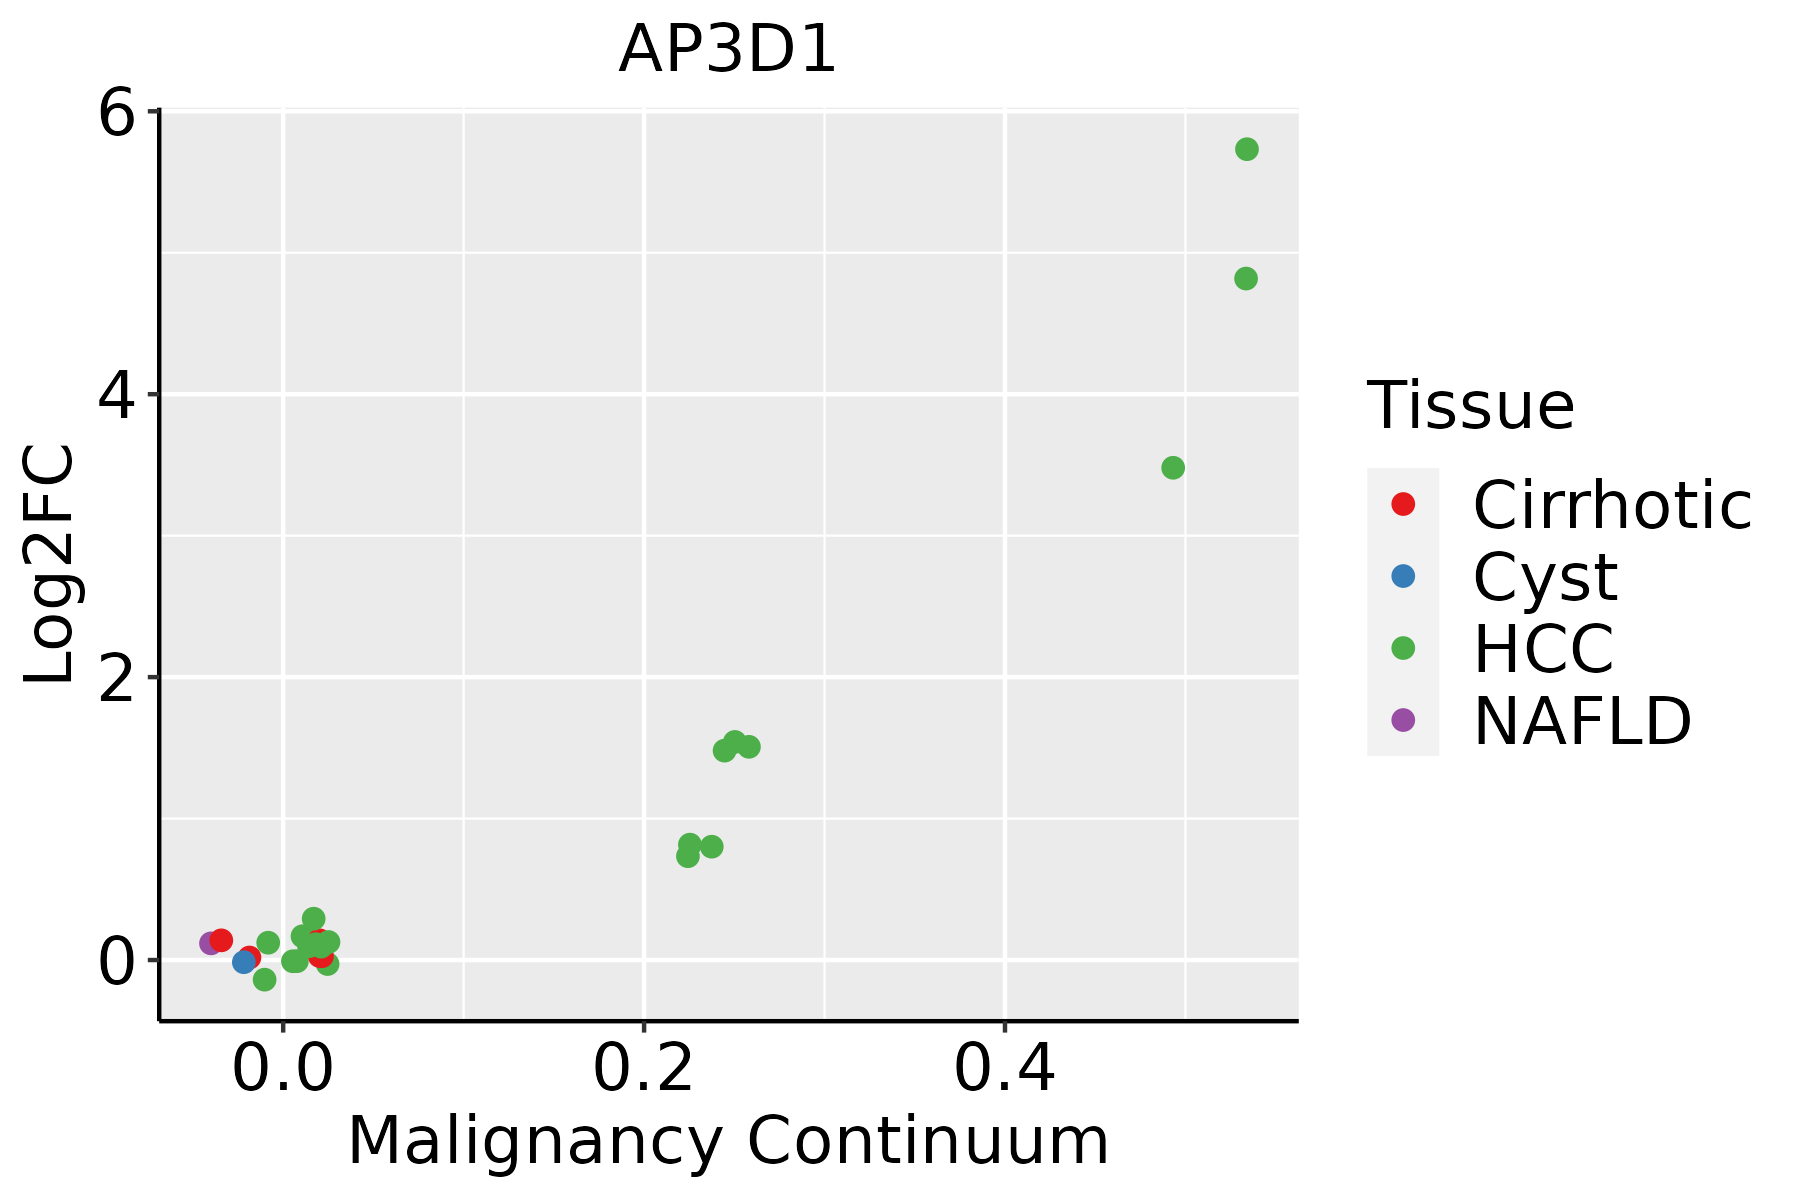 | HCC: Hepatocellular carcinoma |
| NAFLD: Non-alcoholic fatty liver disease | ||
| Oral Cavity |  | EOLP: Erosive Oral lichen planus |
| LP: leukoplakia | ||
| NEOLP: Non-erosive oral lichen planus | ||
| OSCC: Oral squamous cell carcinoma | ||
| Prostate | 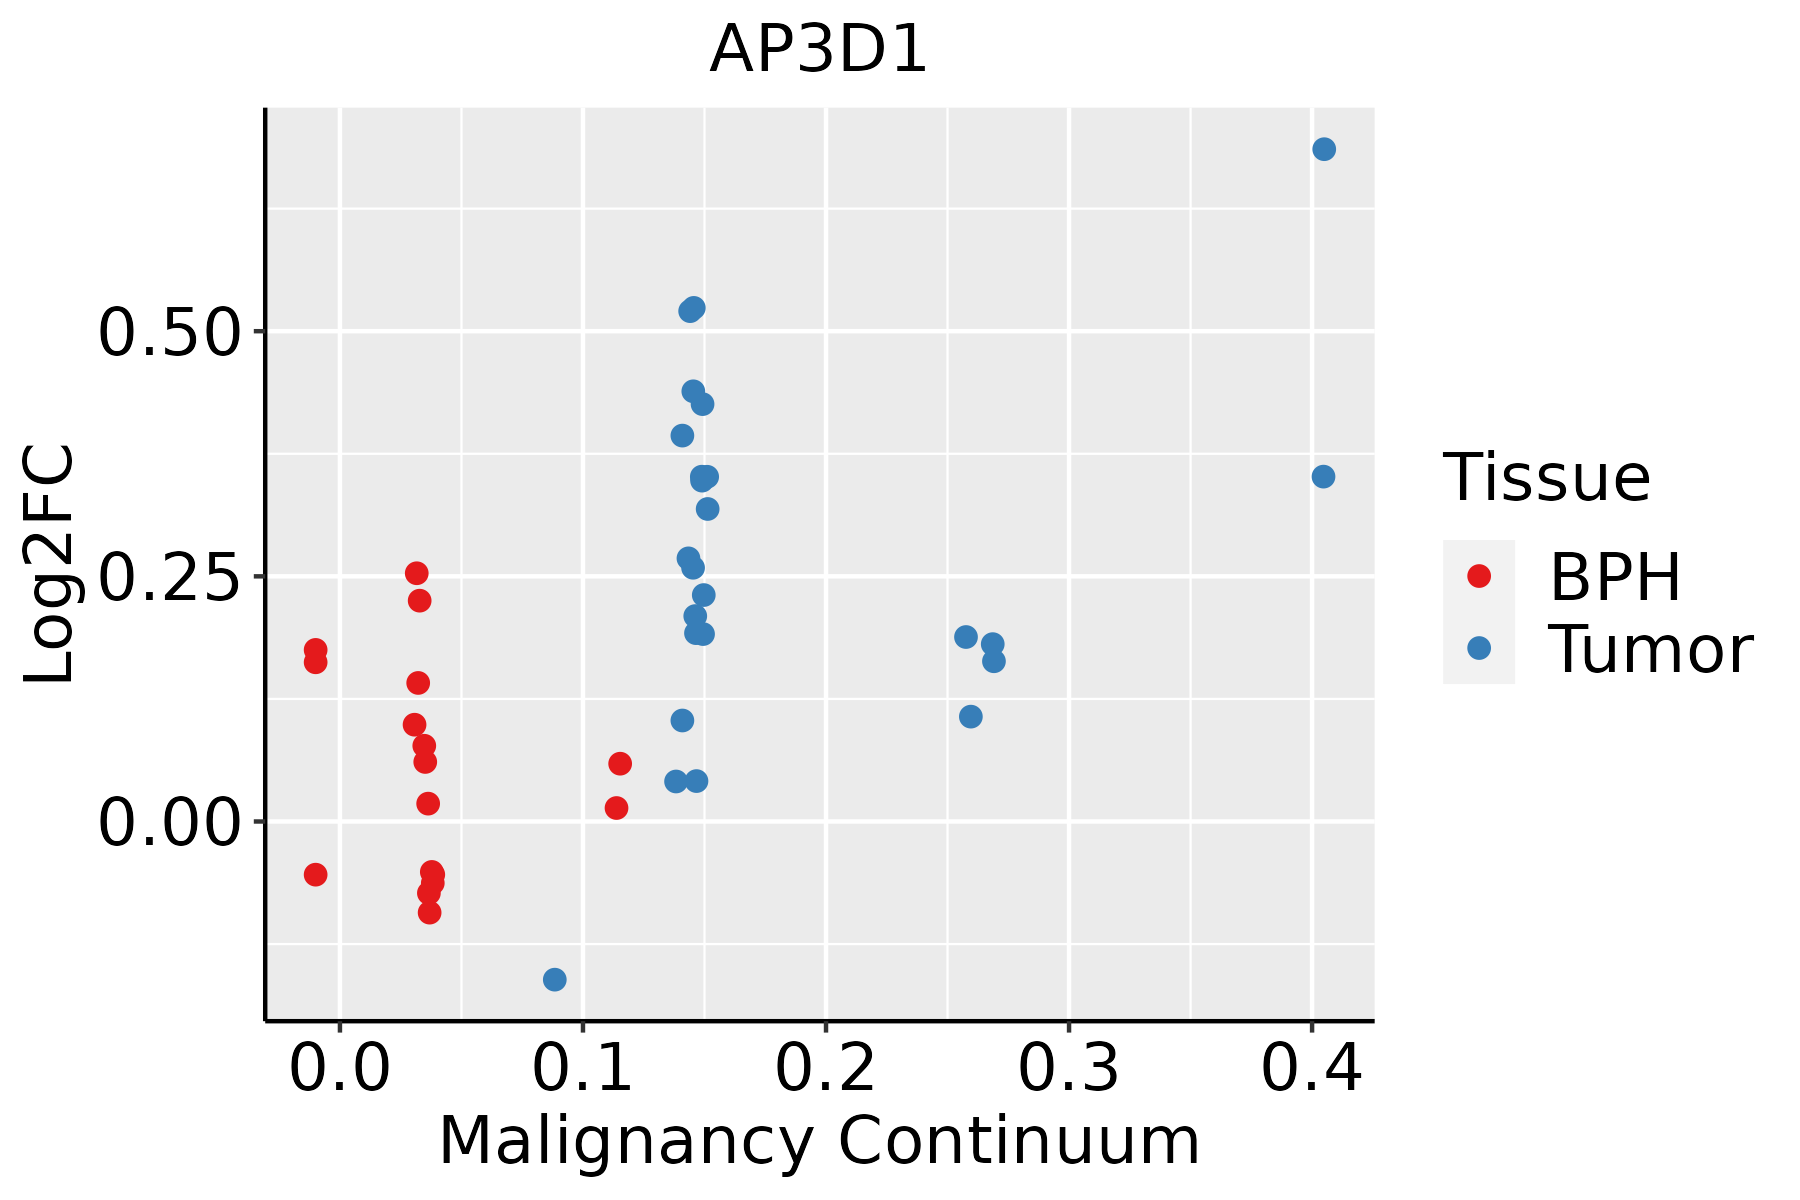 | BPH: Benign Prostatic Hyperplasia |
| Skin | 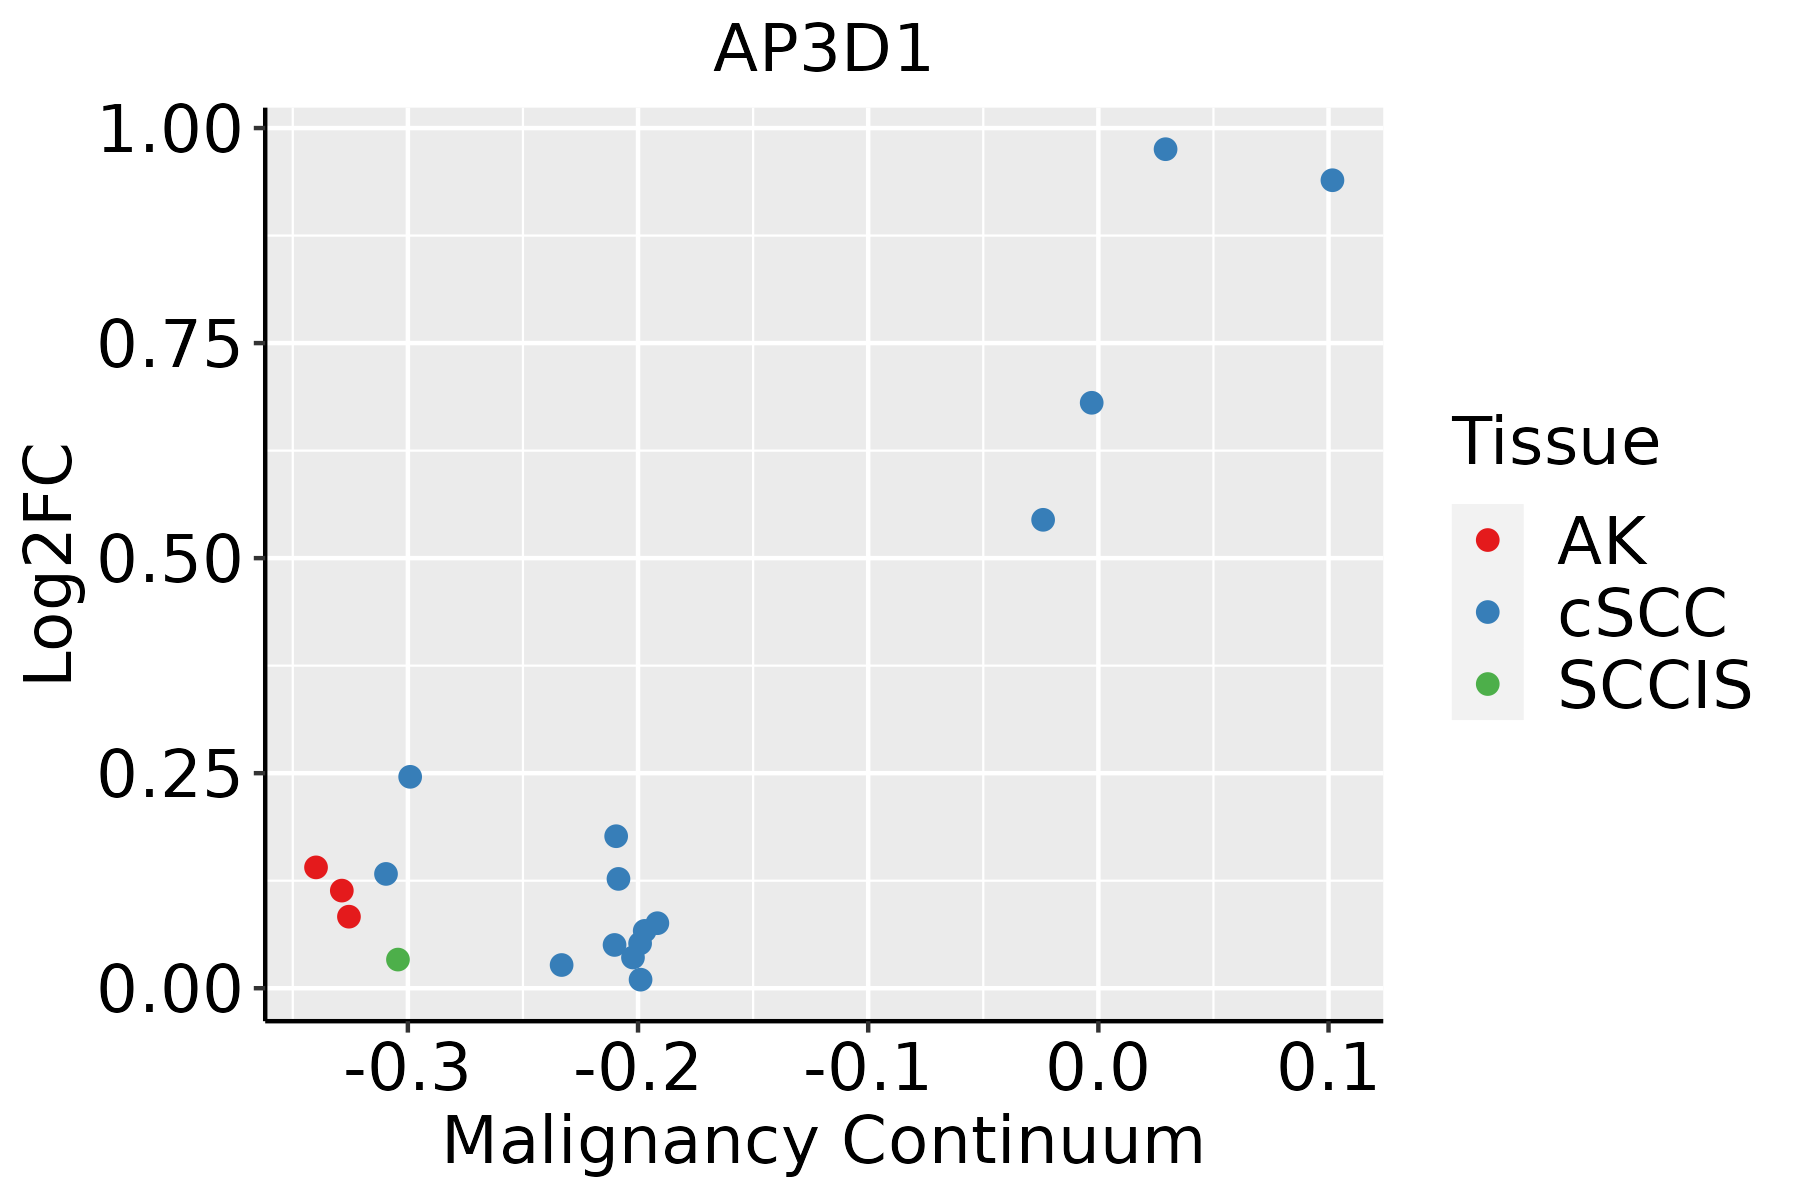 | AK: Actinic keratosis |
| cSCC: Cutaneous squamous cell carcinoma | ||
| SCCIS:squamous cell carcinoma in situ | ||
| Thyroid |  | ATC: Anaplastic thyroid cancer |
| HT: Hashimoto's thyroiditis | ||
| PTC: Papillary thyroid cancer |
| ∗log2FC in expression of this searched gene in stem-like cells from each diseased tissue sample relative to stem-like cells in normal samples in each tissue plotted against the malignancy continuum. Samples are colored based on if they are from different disease stage. |
Top |
Malignant transformation related pathway analysis |
| Find out the enriched GO biological processes and KEGG pathways involved in transition from healthy to precancer to cancer |
| Tissue | Disease Stage | Enriched GO biological Processes |
| Colorectum | AD |  |
| Colorectum | SER |  |
| Colorectum | MSS |  |
| Colorectum | MSI-H |  |
| Colorectum | FAP |  |
| ∗Top 15 enriched GO BP terms are showed in the bar plot of each disease state in each tissue. Each row represents a significant GO biological process which is colored according to the -log10(p.adjust). |
| Page: 1 2 3 4 5 6 7 8 9 |
| GO ID | Tissue | Disease Stage | Description | Gene Ratio | Bg Ratio | pvalue | p.adjust | Count |
| GO:0072594 | Colorectum | AD | establishment of protein localization to organelle | 148/3918 | 422/18723 | 7.95e-12 | 1.04e-09 | 148 |
| GO:0048193 | Colorectum | AD | Golgi vesicle transport | 109/3918 | 296/18723 | 1.80e-10 | 1.68e-08 | 109 |
| GO:0016197 | Colorectum | AD | endosomal transport | 90/3918 | 230/18723 | 1.88e-10 | 1.73e-08 | 90 |
| GO:0051656 | Colorectum | AD | establishment of organelle localization | 131/3918 | 390/18723 | 3.00e-09 | 2.06e-07 | 131 |
| GO:0006900 | Colorectum | AD | vesicle budding from membrane | 32/3918 | 61/18723 | 5.38e-08 | 2.81e-06 | 32 |
| GO:0006605 | Colorectum | AD | protein targeting | 105/3918 | 314/18723 | 1.39e-07 | 6.44e-06 | 105 |
| GO:0016050 | Colorectum | AD | vesicle organization | 101/3918 | 300/18723 | 1.65e-07 | 7.17e-06 | 101 |
| GO:0006892 | Colorectum | AD | post-Golgi vesicle-mediated transport | 45/3918 | 104/18723 | 2.22e-07 | 9.26e-06 | 45 |
| GO:0007034 | Colorectum | AD | vacuolar transport | 60/3918 | 157/18723 | 4.97e-07 | 1.85e-05 | 60 |
| GO:0055076 | Colorectum | AD | transition metal ion homeostasis | 53/3918 | 138/18723 | 1.89e-06 | 5.65e-05 | 53 |
| GO:0051650 | Colorectum | AD | establishment of vesicle localization | 57/3918 | 161/18723 | 1.47e-05 | 3.15e-04 | 57 |
| GO:0046916 | Colorectum | AD | cellular transition metal ion homeostasis | 43/3918 | 115/18723 | 3.62e-05 | 6.56e-04 | 43 |
| GO:0007041 | Colorectum | AD | lysosomal transport | 42/3918 | 114/18723 | 6.61e-05 | 1.07e-03 | 42 |
| GO:0051648 | Colorectum | AD | vesicle localization | 59/3918 | 177/18723 | 7.83e-05 | 1.25e-03 | 59 |
| GO:0072665 | Colorectum | AD | protein localization to vacuole | 27/3918 | 67/18723 | 2.40e-04 | 3.04e-03 | 27 |
| GO:0045785 | Colorectum | AD | positive regulation of cell adhesion | 122/3918 | 437/18723 | 2.65e-04 | 3.28e-03 | 122 |
| GO:0055069 | Colorectum | AD | zinc ion homeostasis | 18/3918 | 40/18723 | 5.36e-04 | 5.74e-03 | 18 |
| GO:0030705 | Colorectum | AD | cytoskeleton-dependent intracellular transport | 60/3918 | 195/18723 | 7.56e-04 | 7.59e-03 | 60 |
| GO:0006882 | Colorectum | AD | cellular zinc ion homeostasis | 17/3918 | 38/18723 | 8.26e-04 | 8.13e-03 | 17 |
| GO:0061462 | Colorectum | AD | protein localization to lysosome | 19/3918 | 46/18723 | 1.36e-03 | 1.19e-02 | 19 |
| Page: 1 2 3 4 5 6 7 8 9 10 11 12 13 14 15 16 17 18 19 20 21 22 23 24 25 26 27 |
| Pathway ID | Tissue | Disease Stage | Description | Gene Ratio | Bg Ratio | pvalue | p.adjust | qvalue | Count |
| hsa04142 | Colorectum | SER | Lysosome | 38/1580 | 132/8465 | 2.87e-03 | 2.03e-02 | 1.47e-02 | 38 |
| hsa041421 | Colorectum | SER | Lysosome | 38/1580 | 132/8465 | 2.87e-03 | 2.03e-02 | 1.47e-02 | 38 |
| hsa0414222 | Esophagus | ESCC | Lysosome | 102/4205 | 132/8465 | 5.11e-11 | 7.13e-10 | 3.65e-10 | 102 |
| hsa0414232 | Esophagus | ESCC | Lysosome | 102/4205 | 132/8465 | 5.11e-11 | 7.13e-10 | 3.65e-10 | 102 |
| hsa041424 | Liver | Cirrhotic | Lysosome | 68/2530 | 132/8465 | 1.34e-07 | 1.97e-06 | 1.21e-06 | 68 |
| hsa0414211 | Liver | Cirrhotic | Lysosome | 68/2530 | 132/8465 | 1.34e-07 | 1.97e-06 | 1.21e-06 | 68 |
| hsa041422 | Liver | HCC | Lysosome | 100/4020 | 132/8465 | 2.32e-11 | 4.31e-10 | 2.40e-10 | 100 |
| hsa041423 | Liver | HCC | Lysosome | 100/4020 | 132/8465 | 2.32e-11 | 4.31e-10 | 2.40e-10 | 100 |
| hsa041425 | Oral cavity | OSCC | Lysosome | 87/3704 | 132/8465 | 1.97e-07 | 1.35e-06 | 6.86e-07 | 87 |
| hsa0414212 | Oral cavity | OSCC | Lysosome | 87/3704 | 132/8465 | 1.97e-07 | 1.35e-06 | 6.86e-07 | 87 |
| hsa0414221 | Oral cavity | LP | Lysosome | 67/2418 | 132/8465 | 5.13e-08 | 7.77e-07 | 5.01e-07 | 67 |
| hsa0414231 | Oral cavity | LP | Lysosome | 67/2418 | 132/8465 | 5.13e-08 | 7.77e-07 | 5.01e-07 | 67 |
| Page: 1 |
Top |
Cell-cell communication analysis |
| Identification of potential cell-cell interactions between two cell types and their ligand-receptor pairs for different disease states |
| Ligand | Receptor | LRpair | Pathway | Tissue | Disease Stage |
| Page: 1 |
Top |
Single-cell gene regulatory network inference analysis |
| Find out the significant the regulons (TFs) and the target genes of each regulon across cell types for different disease states |
| TF | Cell Type | Tissue | Disease Stage | Target Gene | RSS | Regulon Activity |
| ∗The dot plots of a searched regulon are shown for all cell subpopulations in each disease state of each tissue based on the regulon specific score inferred using pySCENIC and by calculating the average expression. |
| Page: 1 |
Top |
Somatic mutation of malignant transformation related genes |
| Annotation of somatic variants for genes involved in malignant transformation |
| Hugo Symbol | Variant Class | Variant Classification | dbSNP RS | HGVSc | HGVSp | HGVSp Short | SWISSPROT | BIOTYPE | SIFT | PolyPhen | Tumor Sample Barcode | Tissue | Histology | Sex | Age | Stage | Therapy Types | Drugs | Outcome |
| AP3D1 | SNV | Missense_Mutation | novel | c.736N>A | p.Gly246Ser | p.G246S | O14617 | protein_coding | deleterious(0.02) | probably_damaging(0.973) | TCGA-AC-A3W6-01 | Breast | breast invasive carcinoma | Female | >=65 | III/IV | Unknown | Unknown | SD |
| AP3D1 | SNV | Missense_Mutation | rs372956453 | c.1279C>T | p.Arg427Trp | p.R427W | O14617 | protein_coding | deleterious(0) | probably_damaging(0.941) | TCGA-AO-A128-01 | Breast | breast invasive carcinoma | Female | <65 | I/II | Chemotherapy | doxorubicin | SD |
| AP3D1 | SNV | Missense_Mutation | rs371009015 | c.1895N>T | p.Ser632Leu | p.S632L | O14617 | protein_coding | tolerated(0.06) | benign(0.308) | TCGA-E2-A14W-01 | Breast | breast invasive carcinoma | Male | >=65 | I/II | Chemotherapy | cytoxan | SD |
| AP3D1 | SNV | Missense_Mutation | novel | c.1456N>A | p.Ala486Thr | p.A486T | O14617 | protein_coding | deleterious(0) | possibly_damaging(0.905) | TCGA-2W-A8YY-01 | Cervix | cervical & endocervical cancer | Female | <65 | I/II | Chemotherapy | cisplatin | CR |
| AP3D1 | SNV | Missense_Mutation | novel | c.1630G>A | p.Glu544Lys | p.E544K | O14617 | protein_coding | tolerated(0.12) | benign(0.049) | TCGA-C5-A8XJ-01 | Cervix | cervical & endocervical cancer | Female | >=65 | I/II | Chemotherapy | cisplatin | SD |
| AP3D1 | SNV | Missense_Mutation | c.2434N>A | p.Asp812Asn | p.D812N | O14617 | protein_coding | tolerated(0.07) | possibly_damaging(0.852) | TCGA-IR-A3LK-01 | Cervix | cervical & endocervical cancer | Female | >=65 | I/II | Chemotherapy | cisplatin | PD | |
| AP3D1 | SNV | Missense_Mutation | c.2356C>G | p.Leu786Val | p.L786V | O14617 | protein_coding | tolerated(0.29) | benign(0.052) | TCGA-Q1-A73O-01 | Cervix | cervical & endocervical cancer | Female | <65 | I/II | Chemotherapy | cisplatin | CR | |
| AP3D1 | SNV | Missense_Mutation | novel | c.1909G>C | p.Glu637Gln | p.E637Q | O14617 | protein_coding | deleterious(0.04) | probably_damaging(0.982) | TCGA-VS-A9V2-01 | Cervix | cervical & endocervical cancer | Female | <65 | I/II | Unknown | Unknown | SD |
| AP3D1 | SNV | Missense_Mutation | c.859N>T | p.Leu287Phe | p.L287F | O14617 | protein_coding | deleterious(0) | probably_damaging(0.999) | TCGA-A6-2686-01 | Colorectum | colon adenocarcinoma | Female | >=65 | I/II | Unknown | Unknown | SD | |
| AP3D1 | SNV | Missense_Mutation | rs754925189 | c.809N>T | p.Thr270Met | p.T270M | O14617 | protein_coding | deleterious(0) | probably_damaging(0.963) | TCGA-A6-5661-01 | Colorectum | colon adenocarcinoma | Female | >=65 | I/II | Unknown | Unknown | SD |
| Page: 1 2 3 4 5 6 7 8 9 10 11 |
Top |
Related drugs of malignant transformation related genes |
| Identification of chemicals and drugs interact with genes involved in malignant transfromation |
| (DGIdb 4.0) |
| Entrez ID | Symbol | Category | Interaction Types | Drug Claim Name | Drug Name | PMIDs |
| Page: 1 |

Copyright 2023-Present -The University of Texas Health Science Center at Houston |