
|
|||||
|
 | |
| |
| |
| |
| |
| |
|
Gene: AP2B1 |
Gene summary for AP2B1 |
| Gene information | Species | Human | Gene symbol | AP2B1 | Gene ID | 163 |
| Gene name | adaptor related protein complex 2 subunit beta 1 | |
| Gene Alias | ADTB2 | |
| Cytomap | 17q12 | |
| Gene Type | protein-coding | GO ID | GO:0001568 | UniProtAcc | A0A140VJE8 |
Top |
Malignant transformation analysis |
| Identification of the aberrant gene expression in precancerous and cancerous lesions by comparing the gene expression of stem-like cells in diseased tissues with normal stem cells |
| Entrez ID | Symbol | Replicates | Species | Organ | Tissue | Adj P-value | Log2FC | Malignancy |
| 163 | AP2B1 | GSM4909282 | Human | Breast | IDC | 1.83e-07 | -2.35e-01 | -0.0288 |
| 163 | AP2B1 | GSM4909292 | Human | Breast | IDC | 3.01e-02 | 5.39e-01 | 0.1236 |
| 163 | AP2B1 | GSM4909293 | Human | Breast | IDC | 7.86e-07 | 2.55e-01 | 0.1581 |
| 163 | AP2B1 | GSM4909296 | Human | Breast | IDC | 4.59e-05 | -2.05e-01 | 0.1524 |
| 163 | AP2B1 | GSM4909297 | Human | Breast | IDC | 1.46e-07 | -2.07e-01 | 0.1517 |
| 163 | AP2B1 | GSM4909301 | Human | Breast | IDC | 1.05e-22 | 6.61e-01 | 0.1577 |
| 163 | AP2B1 | GSM4909311 | Human | Breast | IDC | 2.71e-15 | -1.18e-01 | 0.1534 |
| 163 | AP2B1 | GSM4909312 | Human | Breast | IDC | 3.57e-04 | 4.67e-02 | 0.1552 |
| 163 | AP2B1 | GSM4909319 | Human | Breast | IDC | 5.23e-20 | -2.62e-02 | 0.1563 |
| 163 | AP2B1 | GSM4909320 | Human | Breast | IDC | 6.33e-12 | 3.13e-01 | 0.1575 |
| 163 | AP2B1 | GSM4909321 | Human | Breast | IDC | 1.33e-05 | -1.70e-01 | 0.1559 |
| 163 | AP2B1 | brca10 | Human | Breast | Precancer | 6.60e-14 | 5.34e-01 | -0.0029 |
| 163 | AP2B1 | M1 | Human | Breast | IDC | 1.90e-35 | 9.43e-01 | 0.1577 |
| 163 | AP2B1 | NCCBC14 | Human | Breast | DCIS | 8.69e-06 | 7.59e-02 | 0.2021 |
| 163 | AP2B1 | NCCBC2 | Human | Breast | DCIS | 1.61e-02 | 5.43e-02 | 0.1554 |
| 163 | AP2B1 | NCCBC5 | Human | Breast | DCIS | 4.11e-11 | -2.24e-01 | 0.2046 |
| 163 | AP2B1 | P1 | Human | Breast | IDC | 1.40e-31 | 5.64e-01 | 0.1527 |
| 163 | AP2B1 | DCIS2 | Human | Breast | DCIS | 2.55e-47 | 1.13e-01 | 0.0085 |
| 163 | AP2B1 | HTA11_1938_2000001011 | Human | Colorectum | AD | 1.53e-12 | 8.35e-01 | -0.0811 |
| 163 | AP2B1 | HTA11_78_2000001011 | Human | Colorectum | AD | 6.62e-03 | 3.93e-01 | -0.1088 |
| Page: 1 2 3 4 5 6 7 8 9 10 11 |
| Tissue | Expression Dynamics | Abbreviation |
| Breast |  | IDC: Invasive ductal carcinoma |
| DCIS: Ductal carcinoma in situ | ||
| Precancer(BRCA1-mut): Precancerous lesion from BRCA1 mutation carriers | ||
| Colorectum (GSE201348) |  | FAP: Familial adenomatous polyposis |
| CRC: Colorectal cancer | ||
| Colorectum (HTA11) |  | AD: Adenomas |
| SER: Sessile serrated lesions | ||
| MSI-H: Microsatellite-high colorectal cancer | ||
| MSS: Microsatellite stable colorectal cancer | ||
| Esophagus |  | ESCC: Esophageal squamous cell carcinoma |
| HGIN: High-grade intraepithelial neoplasias | ||
| LGIN: Low-grade intraepithelial neoplasias | ||
| Liver | 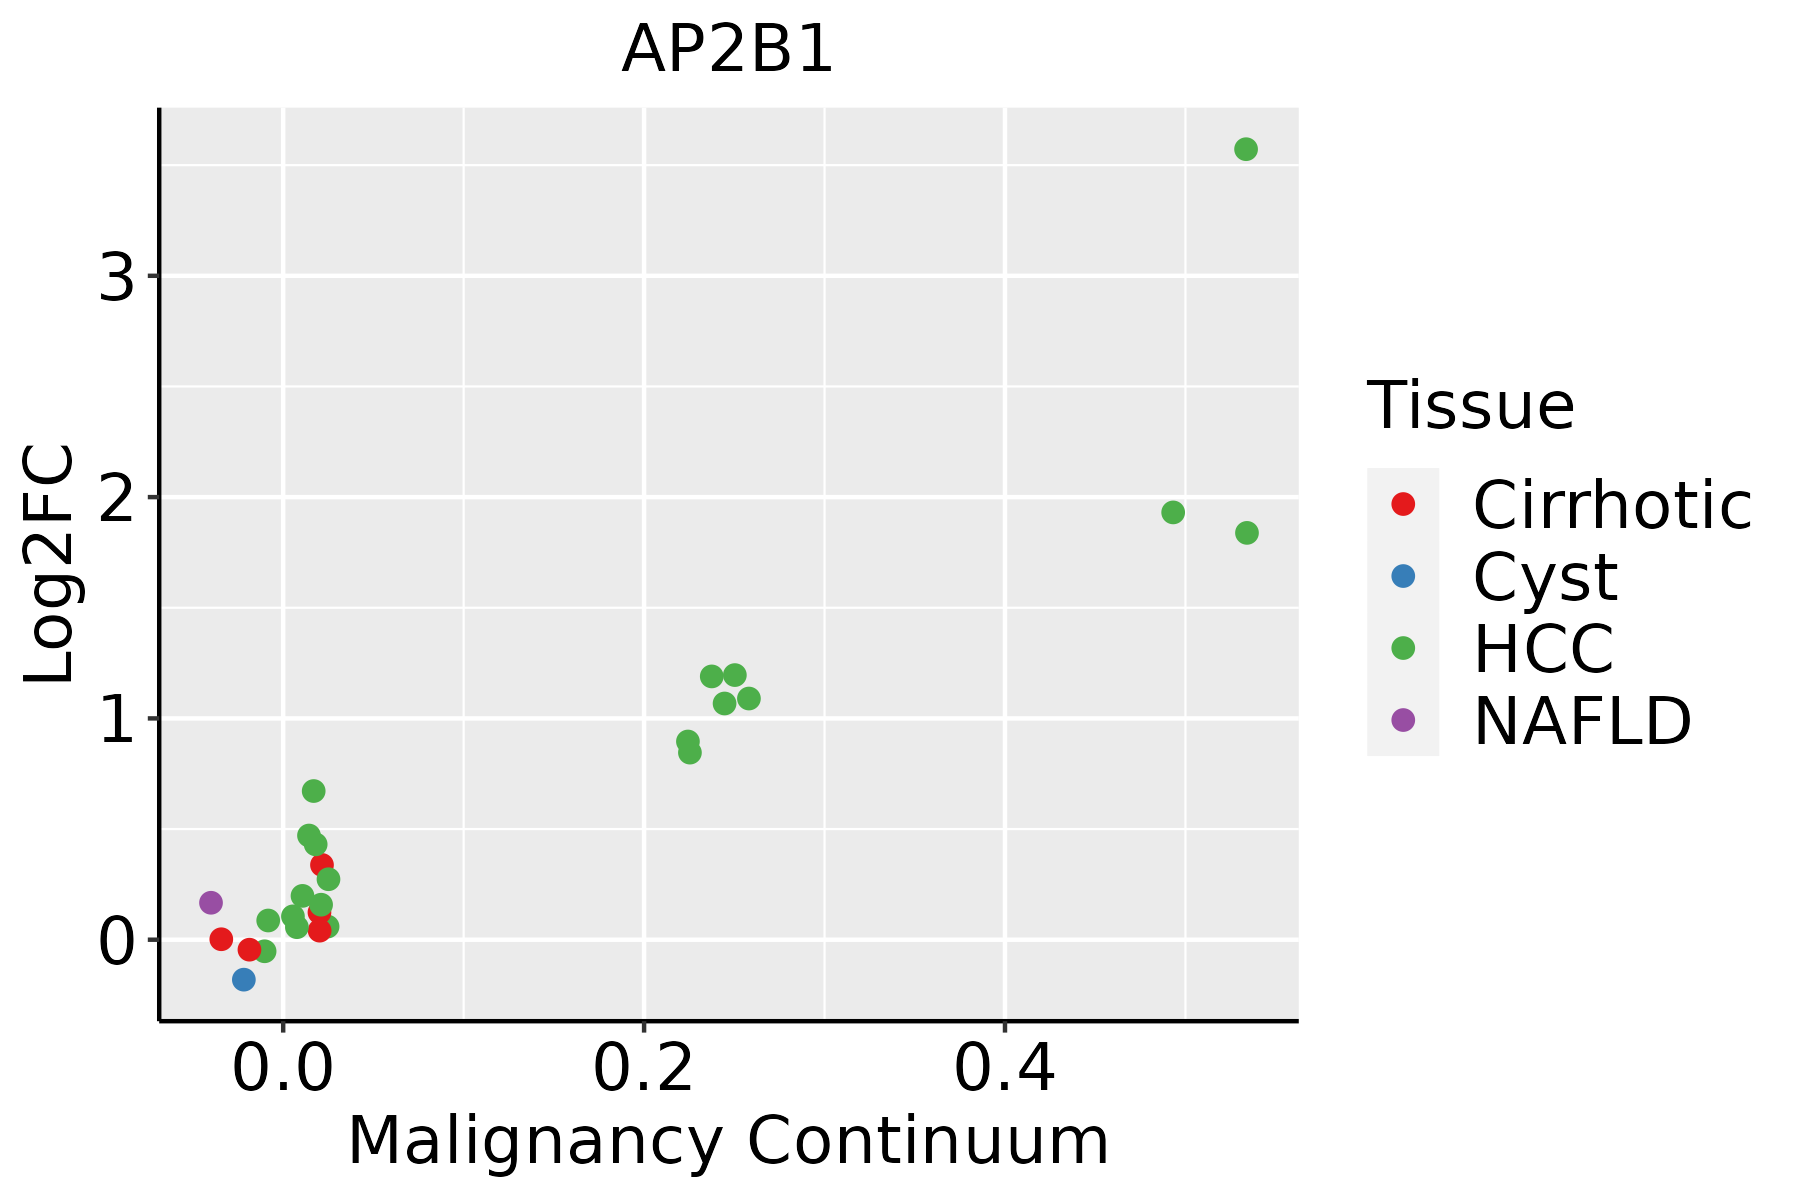 | HCC: Hepatocellular carcinoma |
| NAFLD: Non-alcoholic fatty liver disease | ||
| Lung | 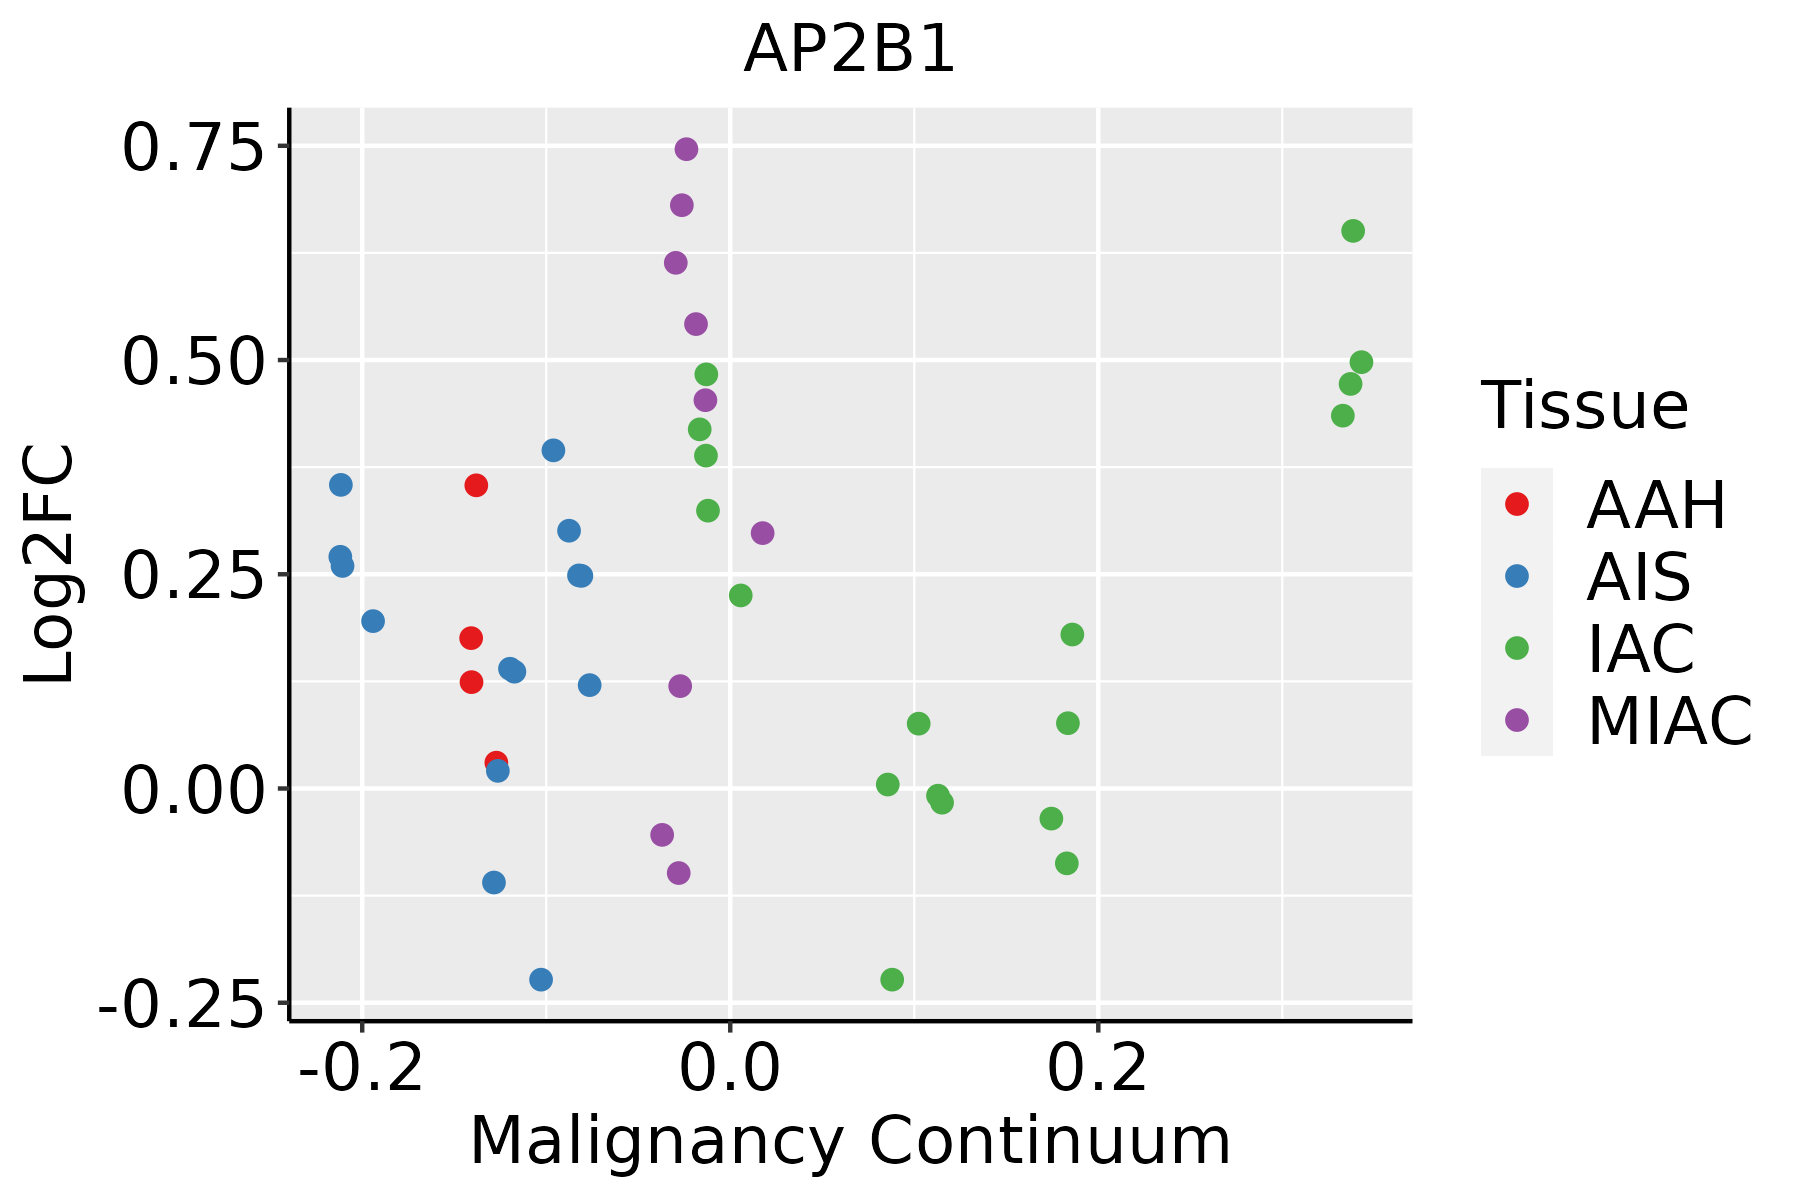 | AAH: Atypical adenomatous hyperplasia |
| AIS: Adenocarcinoma in situ | ||
| IAC: Invasive lung adenocarcinoma | ||
| MIA: Minimally invasive adenocarcinoma | ||
| Oral Cavity |  | EOLP: Erosive Oral lichen planus |
| LP: leukoplakia | ||
| NEOLP: Non-erosive oral lichen planus | ||
| OSCC: Oral squamous cell carcinoma | ||
| Prostate |  | BPH: Benign Prostatic Hyperplasia |
| Skin |  | AK: Actinic keratosis |
| cSCC: Cutaneous squamous cell carcinoma | ||
| SCCIS:squamous cell carcinoma in situ | ||
| Thyroid | 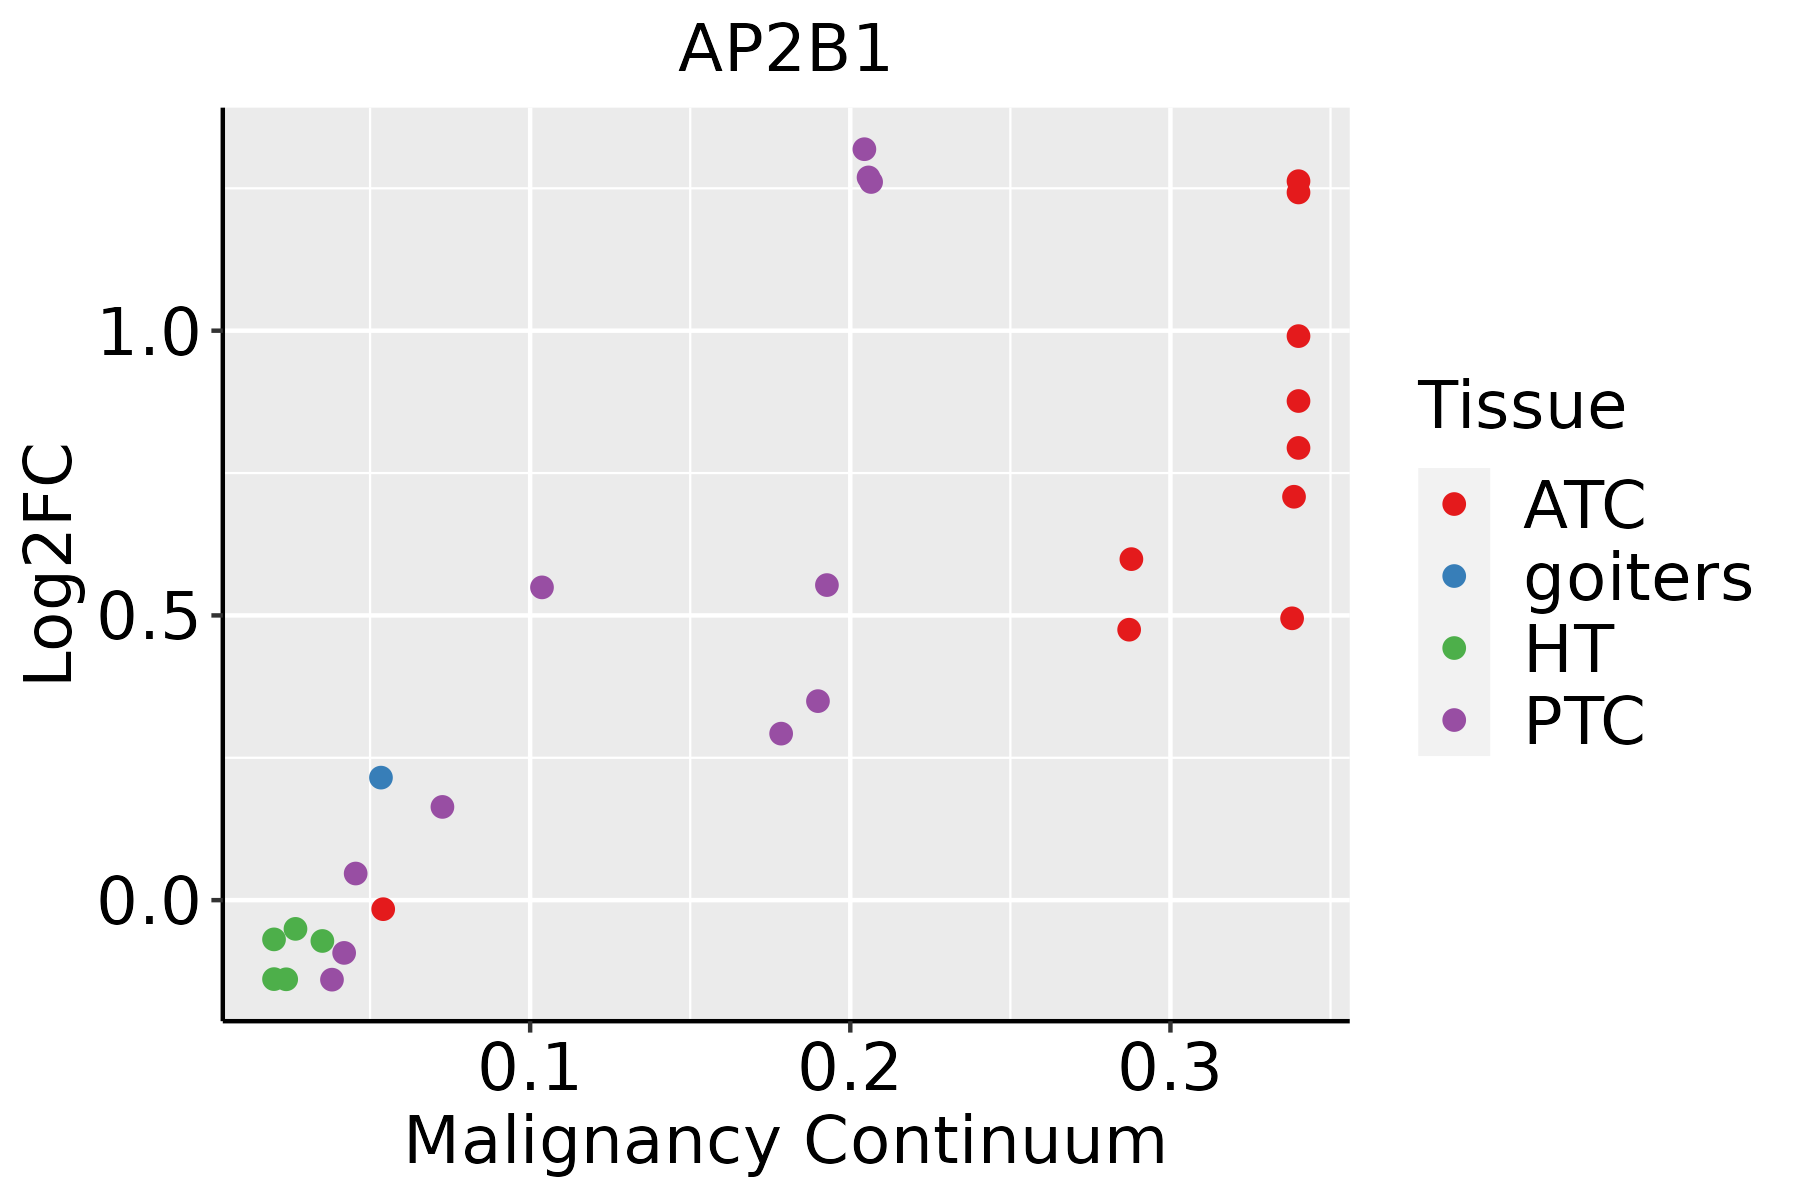 | ATC: Anaplastic thyroid cancer |
| HT: Hashimoto's thyroiditis | ||
| PTC: Papillary thyroid cancer |
| ∗log2FC in expression of this searched gene in stem-like cells from each diseased tissue sample relative to stem-like cells in normal samples in each tissue plotted against the malignancy continuum. Samples are colored based on if they are from different disease stage. |
Top |
Malignant transformation related pathway analysis |
| Find out the enriched GO biological processes and KEGG pathways involved in transition from healthy to precancer to cancer |
| Tissue | Disease Stage | Enriched GO biological Processes |
| Colorectum | AD |  |
| Colorectum | SER |  |
| Colorectum | MSS |  |
| Colorectum | MSI-H |  |
| Colorectum | FAP |  |
| ∗Top 15 enriched GO BP terms are showed in the bar plot of each disease state in each tissue. Each row represents a significant GO biological process which is colored according to the -log10(p.adjust). |
| Page: 1 2 3 4 5 6 7 8 9 |
| GO ID | Tissue | Disease Stage | Description | Gene Ratio | Bg Ratio | pvalue | p.adjust | Count |
| GO:00709979 | Breast | Precancer | neuron death | 50/1080 | 361/18723 | 7.75e-09 | 5.70e-07 | 50 |
| GO:19012149 | Breast | Precancer | regulation of neuron death | 41/1080 | 319/18723 | 1.27e-06 | 4.80e-05 | 41 |
| GO:19038299 | Breast | Precancer | positive regulation of cellular protein localization | 30/1080 | 276/18723 | 6.48e-04 | 7.99e-03 | 30 |
| GO:00068986 | Breast | Precancer | receptor-mediated endocytosis | 27/1080 | 244/18723 | 9.01e-04 | 1.03e-02 | 27 |
| GO:19012157 | Breast | Precancer | negative regulation of neuron death | 24/1080 | 208/18723 | 9.50e-04 | 1.07e-02 | 24 |
| GO:00458076 | Breast | Precancer | positive regulation of endocytosis | 14/1080 | 100/18723 | 1.77e-03 | 1.74e-02 | 14 |
| GO:00316235 | Breast | Precancer | receptor internalization | 15/1080 | 113/18723 | 2.11e-03 | 2.00e-02 | 15 |
| GO:00482685 | Breast | Precancer | clathrin coat assembly | 5/1080 | 18/18723 | 2.88e-03 | 2.49e-02 | 5 |
| GO:19054777 | Breast | Precancer | positive regulation of protein localization to membrane | 14/1080 | 106/18723 | 3.07e-03 | 2.62e-02 | 14 |
| GO:19054757 | Breast | Precancer | regulation of protein localization to membrane | 19/1080 | 175/18723 | 5.98e-03 | 4.22e-02 | 19 |
| GO:007099714 | Breast | IDC | neuron death | 57/1434 | 361/18723 | 1.31e-07 | 7.38e-06 | 57 |
| GO:190121414 | Breast | IDC | regulation of neuron death | 48/1434 | 319/18723 | 5.01e-06 | 1.69e-04 | 48 |
| GO:190547513 | Breast | IDC | regulation of protein localization to membrane | 28/1434 | 175/18723 | 1.56e-04 | 2.71e-03 | 28 |
| GO:000689813 | Breast | IDC | receptor-mediated endocytosis | 35/1434 | 244/18723 | 2.38e-04 | 3.75e-03 | 35 |
| GO:004580713 | Breast | IDC | positive regulation of endocytosis | 18/1434 | 100/18723 | 5.40e-04 | 6.96e-03 | 18 |
| GO:003162311 | Breast | IDC | receptor internalization | 19/1434 | 113/18723 | 9.17e-04 | 1.05e-02 | 19 |
| GO:190547713 | Breast | IDC | positive regulation of protein localization to membrane | 18/1434 | 106/18723 | 1.10e-03 | 1.21e-02 | 18 |
| GO:190382914 | Breast | IDC | positive regulation of cellular protein localization | 36/1434 | 276/18723 | 1.19e-03 | 1.28e-02 | 36 |
| GO:190121513 | Breast | IDC | negative regulation of neuron death | 29/1434 | 208/18723 | 1.23e-03 | 1.32e-02 | 29 |
| GO:00431126 | Breast | IDC | receptor metabolic process | 23/1434 | 166/18723 | 4.04e-03 | 3.25e-02 | 23 |
| Page: 1 2 3 4 5 6 7 8 9 10 11 12 13 14 15 16 17 18 19 |
| Pathway ID | Tissue | Disease Stage | Description | Gene Ratio | Bg Ratio | pvalue | p.adjust | qvalue | Count |
| hsa0501616 | Breast | Precancer | Huntington disease | 98/684 | 306/8465 | 2.85e-35 | 2.25e-33 | 1.72e-33 | 98 |
| hsa0501617 | Breast | Precancer | Huntington disease | 98/684 | 306/8465 | 2.85e-35 | 2.25e-33 | 1.72e-33 | 98 |
| hsa0501623 | Breast | IDC | Huntington disease | 103/867 | 306/8465 | 5.14e-30 | 4.17e-28 | 3.12e-28 | 103 |
| hsa0496121 | Breast | IDC | Endocrine and other factor-regulated calcium reabsorption | 12/867 | 53/8465 | 6.29e-03 | 3.30e-02 | 2.47e-02 | 12 |
| hsa0501633 | Breast | IDC | Huntington disease | 103/867 | 306/8465 | 5.14e-30 | 4.17e-28 | 3.12e-28 | 103 |
| hsa0496131 | Breast | IDC | Endocrine and other factor-regulated calcium reabsorption | 12/867 | 53/8465 | 6.29e-03 | 3.30e-02 | 2.47e-02 | 12 |
| hsa0501643 | Breast | DCIS | Huntington disease | 101/846 | 306/8465 | 1.54e-29 | 1.24e-27 | 9.13e-28 | 101 |
| hsa0496141 | Breast | DCIS | Endocrine and other factor-regulated calcium reabsorption | 12/846 | 53/8465 | 5.17e-03 | 2.69e-02 | 1.98e-02 | 12 |
| hsa0414416 | Breast | DCIS | Endocytosis | 37/846 | 251/8465 | 9.92e-03 | 4.40e-02 | 3.24e-02 | 37 |
| hsa0501653 | Breast | DCIS | Huntington disease | 101/846 | 306/8465 | 1.54e-29 | 1.24e-27 | 9.13e-28 | 101 |
| hsa0496151 | Breast | DCIS | Endocrine and other factor-regulated calcium reabsorption | 12/846 | 53/8465 | 5.17e-03 | 2.69e-02 | 1.98e-02 | 12 |
| hsa0414417 | Breast | DCIS | Endocytosis | 37/846 | 251/8465 | 9.92e-03 | 4.40e-02 | 3.24e-02 | 37 |
| hsa05016 | Colorectum | AD | Huntington disease | 147/2092 | 306/8465 | 1.93e-19 | 9.26e-18 | 5.91e-18 | 147 |
| hsa04144 | Colorectum | AD | Endocytosis | 111/2092 | 251/8465 | 5.95e-12 | 1.42e-10 | 9.08e-11 | 111 |
| hsa04961 | Colorectum | AD | Endocrine and other factor-regulated calcium reabsorption | 24/2092 | 53/8465 | 8.49e-04 | 5.93e-03 | 3.78e-03 | 24 |
| hsa050161 | Colorectum | AD | Huntington disease | 147/2092 | 306/8465 | 1.93e-19 | 9.26e-18 | 5.91e-18 | 147 |
| hsa041441 | Colorectum | AD | Endocytosis | 111/2092 | 251/8465 | 5.95e-12 | 1.42e-10 | 9.08e-11 | 111 |
| hsa049611 | Colorectum | AD | Endocrine and other factor-regulated calcium reabsorption | 24/2092 | 53/8465 | 8.49e-04 | 5.93e-03 | 3.78e-03 | 24 |
| hsa050164 | Colorectum | MSS | Huntington disease | 141/1875 | 306/8465 | 2.90e-21 | 1.62e-19 | 9.92e-20 | 141 |
| hsa041444 | Colorectum | MSS | Endocytosis | 102/1875 | 251/8465 | 1.85e-11 | 4.43e-10 | 2.71e-10 | 102 |
| Page: 1 2 3 4 |
Top |
Cell-cell communication analysis |
| Identification of potential cell-cell interactions between two cell types and their ligand-receptor pairs for different disease states |
| Ligand | Receptor | LRpair | Pathway | Tissue | Disease Stage |
| Page: 1 |
Top |
Single-cell gene regulatory network inference analysis |
| Find out the significant the regulons (TFs) and the target genes of each regulon across cell types for different disease states |
| TF | Cell Type | Tissue | Disease Stage | Target Gene | RSS | Regulon Activity |
| ∗The dot plots of a searched regulon are shown for all cell subpopulations in each disease state of each tissue based on the regulon specific score inferred using pySCENIC and by calculating the average expression. |
| Page: 1 |
Top |
Somatic mutation of malignant transformation related genes |
| Annotation of somatic variants for genes involved in malignant transformation |
| Hugo Symbol | Variant Class | Variant Classification | dbSNP RS | HGVSc | HGVSp | HGVSp Short | SWISSPROT | BIOTYPE | SIFT | PolyPhen | Tumor Sample Barcode | Tissue | Histology | Sex | Age | Stage | Therapy Types | Drugs | Outcome |
| AP2B1 | SNV | Missense_Mutation | novel | c.496N>T | p.Arg166Trp | p.R166W | P63010 | protein_coding | deleterious(0) | possibly_damaging(0.879) | TCGA-AN-A046-01 | Breast | breast invasive carcinoma | Female | >=65 | I/II | Unknown | Unknown | SD |
| AP2B1 | SNV | Missense_Mutation | novel | c.1399N>C | p.Glu467Gln | p.E467Q | P63010 | protein_coding | tolerated(0.1) | benign(0.054) | TCGA-AO-A0JC-01 | Breast | breast invasive carcinoma | Female | <65 | I/II | Chemotherapy | fluorouracil | SD |
| AP2B1 | SNV | Missense_Mutation | novel | c.2654N>G | p.Asn885Ser | p.N885S | P63010 | protein_coding | tolerated(0.84) | benign(0.024) | TCGA-BH-A1F8-01 | Breast | breast invasive carcinoma | Female | >=65 | III/IV | Unknown | Unknown | PD |
| AP2B1 | insertion | Nonsense_Mutation | novel | c.2252_2253insGTTCTTCCCAATCTCCCCTCTCCCTT | p.Tyr751Ter | p.Y751* | P63010 | protein_coding | TCGA-A8-A07R-01 | Breast | breast invasive carcinoma | Female | >=65 | III/IV | Ancillary | zoledronic | SD | ||
| AP2B1 | insertion | In_Frame_Ins | novel | c.1761_1762insGTTAAAAAAAATTTCTTTTTTTTGGAACGGAGTTTTGCTCTT | p.Gly587_Ile588insValLysLysAsnPhePhePheLeuGluArgSerPheAlaLeu | p.G587_I588insVKKNFFFLERSFAL | P63010 | protein_coding | TCGA-A8-A08H-01 | Breast | breast invasive carcinoma | Female | >=65 | I/II | Unknown | Unknown | SD | ||
| AP2B1 | insertion | Nonsense_Mutation | novel | c.1730_1731insATTATAGGCATGTGCCACCTTGCCTGGCTAATTTTTTGTATT | p.Pro577_Pro578insLeuTerAlaCysAlaThrLeuProGlyTerPhePheValPhe | p.P577_P578insL*ACATLPG*FFVF | P63010 | protein_coding | TCGA-AO-A0JB-01 | Breast | breast invasive carcinoma | Female | <65 | III/IV | Chemotherapy | cyclophosphamide | SD | ||
| AP2B1 | SNV | Missense_Mutation | novel | c.2636N>T | p.Ser879Phe | p.S879F | P63010 | protein_coding | tolerated(0.07) | possibly_damaging(0.867) | TCGA-2W-A8YY-01 | Cervix | cervical & endocervical cancer | Female | <65 | I/II | Chemotherapy | cisplatin | CR |
| AP2B1 | SNV | Missense_Mutation | novel | c.1142N>T | p.Ala381Val | p.A381V | P63010 | protein_coding | deleterious(0) | possibly_damaging(0.891) | TCGA-EA-A3HU-01 | Cervix | cervical & endocervical cancer | Female | <65 | I/II | Unknown | Unknown | SD |
| AP2B1 | SNV | Missense_Mutation | novel | c.1715C>T | p.Ser572Phe | p.S572F | P63010 | protein_coding | deleterious(0) | probably_damaging(0.919) | TCGA-EA-A43B-01 | Cervix | cervical & endocervical cancer | Female | <65 | I/II | Chemotherapy | cisplatin | CR |
| AP2B1 | SNV | Missense_Mutation | novel | c.1501N>A | p.Glu501Lys | p.E501K | P63010 | protein_coding | tolerated(0.22) | benign(0.027) | TCGA-FU-A3HZ-01 | Cervix | cervical & endocervical cancer | Female | <65 | I/II | Chemotherapy | cisplatin | CR |
| Page: 1 2 3 4 5 6 7 8 |
Top |
Related drugs of malignant transformation related genes |
| Identification of chemicals and drugs interact with genes involved in malignant transfromation |
| (DGIdb 4.0) |
| Entrez ID | Symbol | Category | Interaction Types | Drug Claim Name | Drug Name | PMIDs |
| Page: 1 |

Copyright 2023-Present -The University of Texas Health Science Center at Houston |