
|
|||||
|
 | |
| |
| |
| |
| |
| |
|
Gene: AP2A2 |
Gene summary for AP2A2 |
| Gene information | Species | Human | Gene symbol | AP2A2 | Gene ID | 161 |
| Gene name | adaptor related protein complex 2 subunit alpha 2 | |
| Gene Alias | ADTAB | |
| Cytomap | 11p15.5 | |
| Gene Type | protein-coding | GO ID | GO:0006810 | UniProtAcc | O94973 |
Top |
Malignant transformation analysis |
| Identification of the aberrant gene expression in precancerous and cancerous lesions by comparing the gene expression of stem-like cells in diseased tissues with normal stem cells |
| Entrez ID | Symbol | Replicates | Species | Organ | Tissue | Adj P-value | Log2FC | Malignancy |
| 161 | AP2A2 | LZE22D1 | Human | Esophagus | HGIN | 2.50e-02 | 1.28e-01 | 0.0595 |
| 161 | AP2A2 | LZE24T | Human | Esophagus | ESCC | 1.11e-09 | 2.51e-01 | 0.0596 |
| 161 | AP2A2 | P1T-E | Human | Esophagus | ESCC | 9.11e-05 | 2.06e-01 | 0.0875 |
| 161 | AP2A2 | P2T-E | Human | Esophagus | ESCC | 3.68e-11 | 2.20e-01 | 0.1177 |
| 161 | AP2A2 | P4T-E | Human | Esophagus | ESCC | 7.20e-08 | 1.69e-01 | 0.1323 |
| 161 | AP2A2 | P5T-E | Human | Esophagus | ESCC | 3.69e-02 | 5.65e-02 | 0.1327 |
| 161 | AP2A2 | P8T-E | Human | Esophagus | ESCC | 2.04e-08 | 1.43e-01 | 0.0889 |
| 161 | AP2A2 | P9T-E | Human | Esophagus | ESCC | 1.59e-05 | 1.80e-01 | 0.1131 |
| 161 | AP2A2 | P10T-E | Human | Esophagus | ESCC | 1.65e-17 | 2.67e-01 | 0.116 |
| 161 | AP2A2 | P11T-E | Human | Esophagus | ESCC | 1.85e-07 | 3.09e-01 | 0.1426 |
| 161 | AP2A2 | P12T-E | Human | Esophagus | ESCC | 3.24e-12 | 3.19e-01 | 0.1122 |
| 161 | AP2A2 | P15T-E | Human | Esophagus | ESCC | 4.08e-16 | 3.76e-01 | 0.1149 |
| 161 | AP2A2 | P16T-E | Human | Esophagus | ESCC | 1.70e-07 | 2.27e-01 | 0.1153 |
| 161 | AP2A2 | P17T-E | Human | Esophagus | ESCC | 6.23e-11 | 5.06e-01 | 0.1278 |
| 161 | AP2A2 | P19T-E | Human | Esophagus | ESCC | 6.29e-08 | 4.37e-01 | 0.1662 |
| 161 | AP2A2 | P20T-E | Human | Esophagus | ESCC | 1.19e-13 | 3.10e-01 | 0.1124 |
| 161 | AP2A2 | P21T-E | Human | Esophagus | ESCC | 2.24e-12 | 3.07e-01 | 0.1617 |
| 161 | AP2A2 | P22T-E | Human | Esophagus | ESCC | 1.17e-08 | 1.95e-01 | 0.1236 |
| 161 | AP2A2 | P23T-E | Human | Esophagus | ESCC | 3.03e-17 | 2.83e-01 | 0.108 |
| 161 | AP2A2 | P24T-E | Human | Esophagus | ESCC | 4.54e-11 | 2.19e-01 | 0.1287 |
| Page: 1 2 3 4 5 6 |
| Tissue | Expression Dynamics | Abbreviation |
| Esophagus | 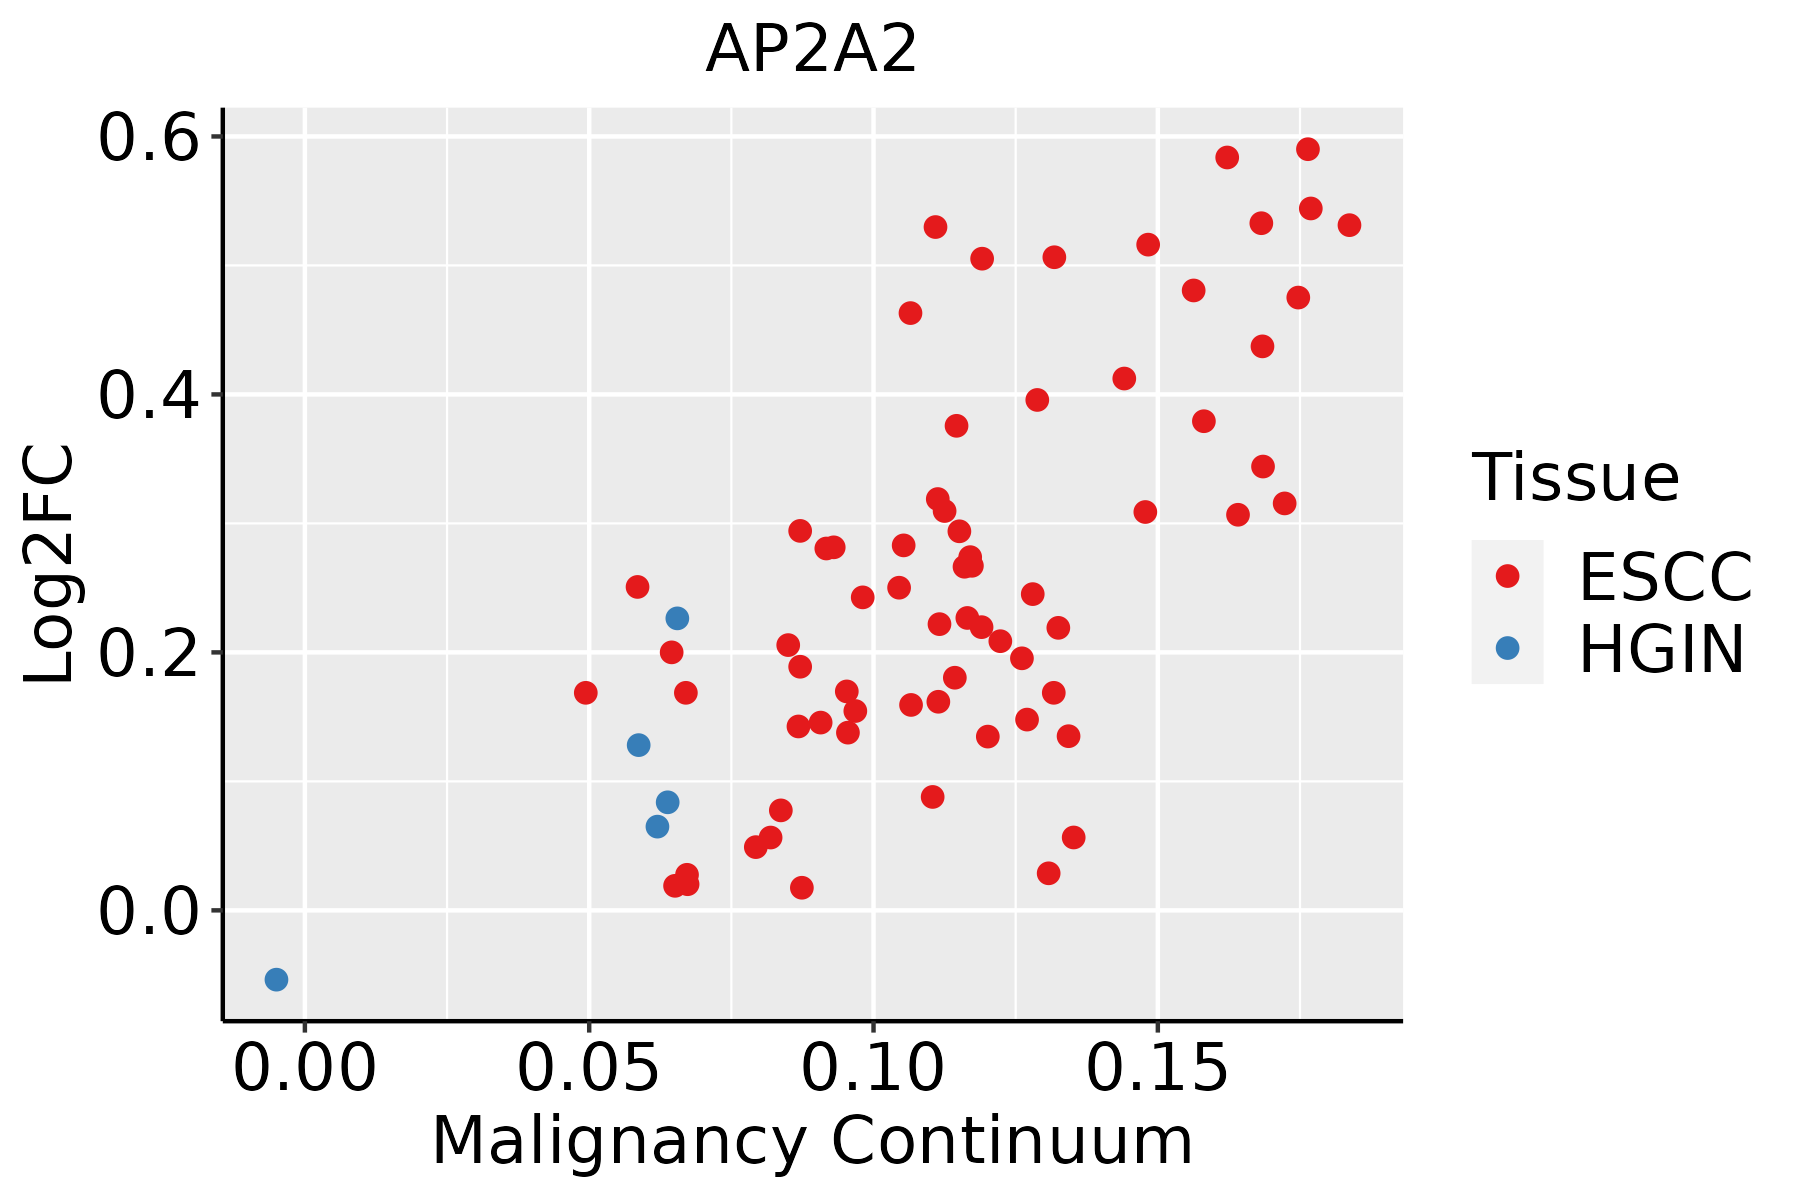 | ESCC: Esophageal squamous cell carcinoma |
| HGIN: High-grade intraepithelial neoplasias | ||
| LGIN: Low-grade intraepithelial neoplasias | ||
| Liver | 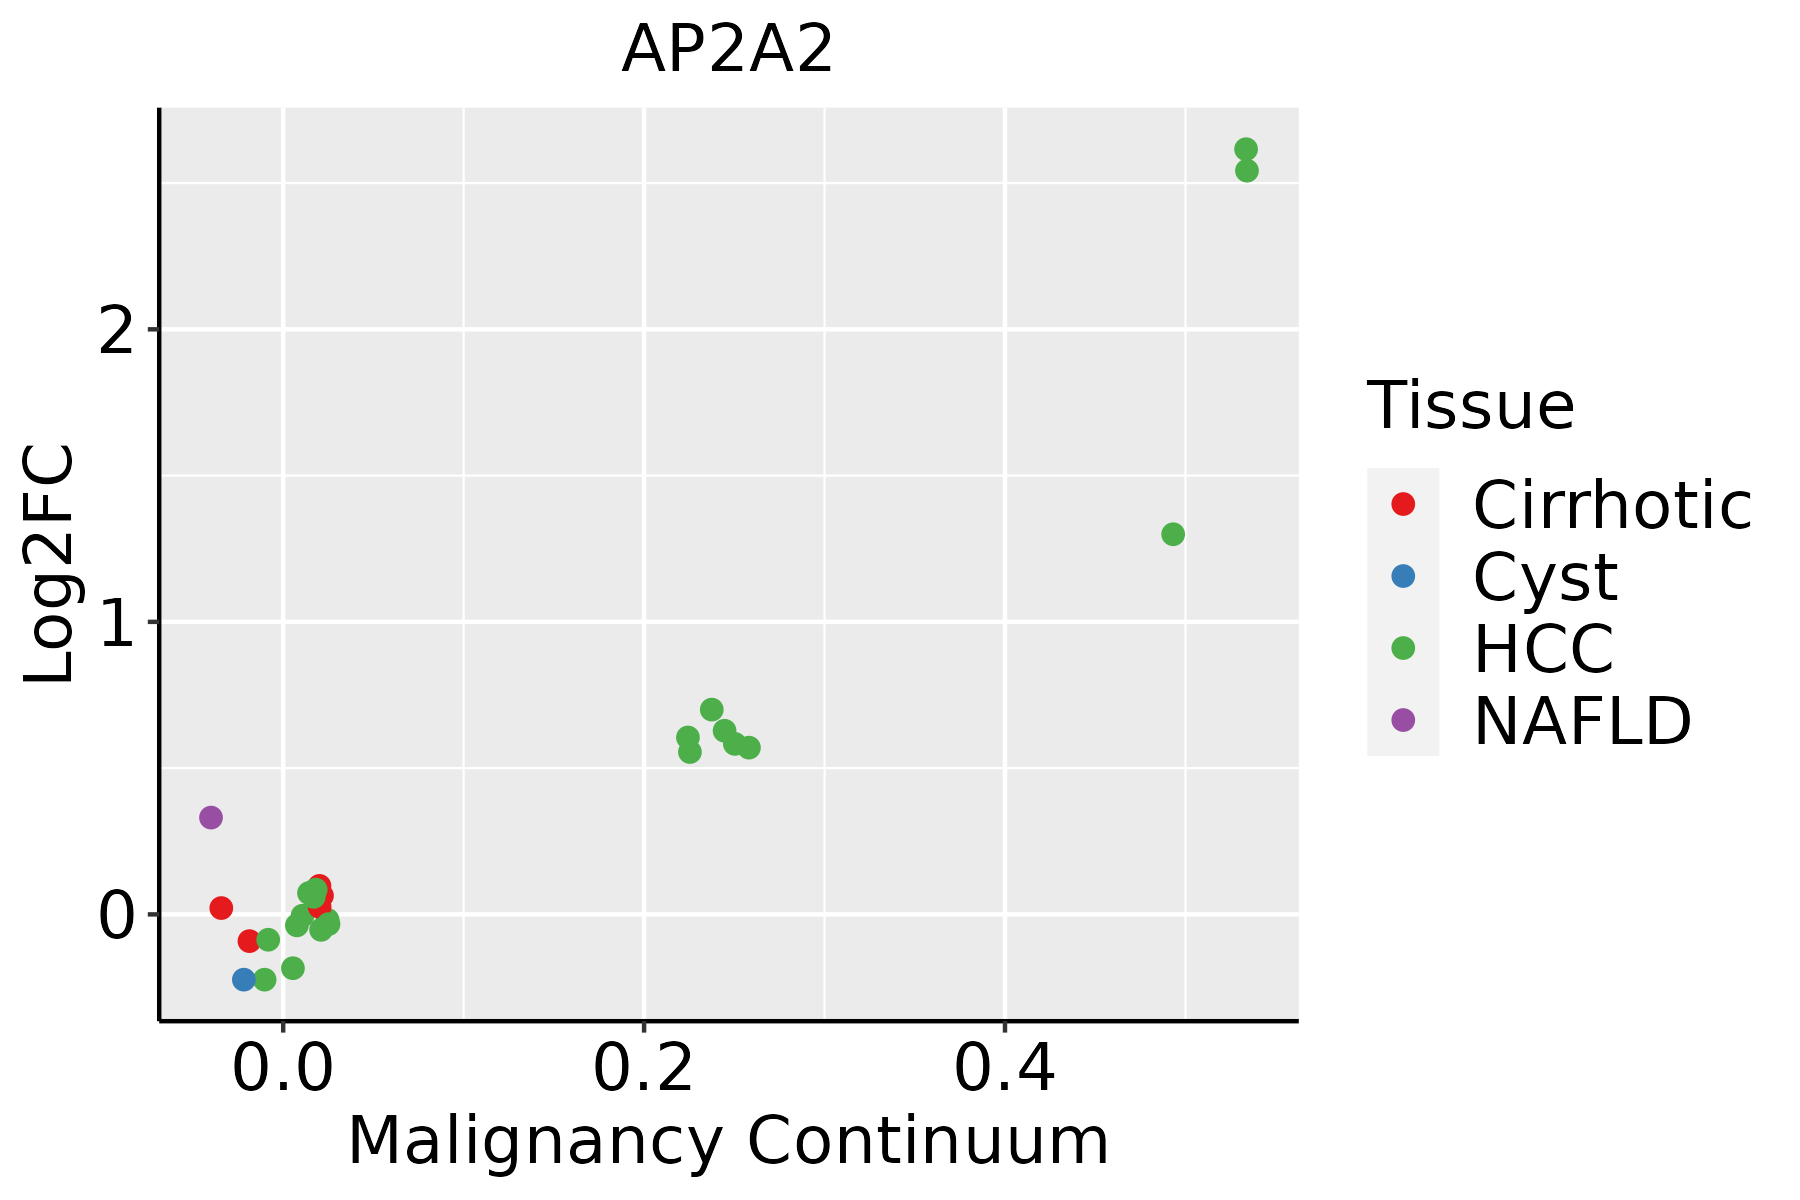 | HCC: Hepatocellular carcinoma |
| NAFLD: Non-alcoholic fatty liver disease | ||
| Oral Cavity |  | EOLP: Erosive Oral lichen planus |
| LP: leukoplakia | ||
| NEOLP: Non-erosive oral lichen planus | ||
| OSCC: Oral squamous cell carcinoma | ||
| Thyroid |  | ATC: Anaplastic thyroid cancer |
| HT: Hashimoto's thyroiditis | ||
| PTC: Papillary thyroid cancer |
| ∗log2FC in expression of this searched gene in stem-like cells from each diseased tissue sample relative to stem-like cells in normal samples in each tissue plotted against the malignancy continuum. Samples are colored based on if they are from different disease stage. |
Top |
Malignant transformation related pathway analysis |
| Find out the enriched GO biological processes and KEGG pathways involved in transition from healthy to precancer to cancer |
| Tissue | Disease Stage | Enriched GO biological Processes |
| Colorectum | AD |  |
| Colorectum | SER |  |
| Colorectum | MSS |  |
| Colorectum | MSI-H |  |
| Colorectum | FAP |  |
| ∗Top 15 enriched GO BP terms are showed in the bar plot of each disease state in each tissue. Each row represents a significant GO biological process which is colored according to the -log10(p.adjust). |
| Page: 1 2 3 4 5 6 7 8 9 |
| GO ID | Tissue | Disease Stage | Description | Gene Ratio | Bg Ratio | pvalue | p.adjust | Count |
| GO:00725839 | Esophagus | HGIN | clathrin-dependent endocytosis | 15/2587 | 47/18723 | 1.17e-03 | 1.42e-02 | 15 |
| GO:000689818 | Esophagus | ESCC | receptor-mediated endocytosis | 142/8552 | 244/18723 | 5.22e-05 | 4.05e-04 | 142 |
| GO:007258314 | Esophagus | ESCC | clathrin-dependent endocytosis | 34/8552 | 47/18723 | 1.91e-04 | 1.21e-03 | 34 |
| GO:000689811 | Liver | Cirrhotic | receptor-mediated endocytosis | 91/4634 | 244/18723 | 8.13e-06 | 1.22e-04 | 91 |
| GO:000689821 | Liver | HCC | receptor-mediated endocytosis | 134/7958 | 244/18723 | 5.73e-05 | 5.31e-04 | 134 |
| GO:007258311 | Liver | HCC | clathrin-dependent endocytosis | 31/7958 | 47/18723 | 9.90e-04 | 5.71e-03 | 31 |
| GO:000689810 | Oral cavity | OSCC | receptor-mediated endocytosis | 125/7305 | 244/18723 | 6.56e-05 | 5.32e-04 | 125 |
| GO:00725838 | Oral cavity | OSCC | clathrin-dependent endocytosis | 30/7305 | 47/18723 | 4.96e-04 | 2.92e-03 | 30 |
| GO:000689817 | Oral cavity | LP | receptor-mediated endocytosis | 87/4623 | 244/18723 | 7.83e-05 | 1.02e-03 | 87 |
| GO:007258313 | Oral cavity | LP | clathrin-dependent endocytosis | 20/4623 | 47/18723 | 5.42e-03 | 3.30e-02 | 20 |
| GO:007258321 | Oral cavity | EOLP | clathrin-dependent endocytosis | 19/2218 | 47/18723 | 6.00e-07 | 1.56e-05 | 19 |
| GO:000689825 | Oral cavity | EOLP | receptor-mediated endocytosis | 55/2218 | 244/18723 | 1.64e-06 | 3.82e-05 | 55 |
| GO:000689831 | Oral cavity | NEOLP | receptor-mediated endocytosis | 51/2005 | 244/18723 | 2.08e-06 | 4.87e-05 | 51 |
| GO:007258331 | Oral cavity | NEOLP | clathrin-dependent endocytosis | 15/2005 | 47/18723 | 7.12e-05 | 9.27e-04 | 15 |
| GO:0006898110 | Thyroid | PTC | receptor-mediated endocytosis | 112/5968 | 244/18723 | 2.87e-06 | 3.74e-05 | 112 |
| GO:007258310 | Thyroid | PTC | clathrin-dependent endocytosis | 30/5968 | 47/18723 | 6.62e-06 | 7.83e-05 | 30 |
| GO:000689826 | Thyroid | ATC | receptor-mediated endocytosis | 118/6293 | 244/18723 | 1.17e-06 | 1.50e-05 | 118 |
| GO:007258315 | Thyroid | ATC | clathrin-dependent endocytosis | 30/6293 | 47/18723 | 2.16e-05 | 1.92e-04 | 30 |
| Page: 1 |
| Pathway ID | Tissue | Disease Stage | Description | Gene Ratio | Bg Ratio | pvalue | p.adjust | qvalue | Count |
| hsa0501630 | Esophagus | HGIN | Huntington disease | 129/1383 | 306/8465 | 6.81e-28 | 7.41e-26 | 5.88e-26 | 129 |
| hsa0414429 | Esophagus | HGIN | Endocytosis | 76/1383 | 251/8465 | 1.74e-08 | 3.34e-07 | 2.65e-07 | 76 |
| hsa05016113 | Esophagus | HGIN | Huntington disease | 129/1383 | 306/8465 | 6.81e-28 | 7.41e-26 | 5.88e-26 | 129 |
| hsa04144113 | Esophagus | HGIN | Endocytosis | 76/1383 | 251/8465 | 1.74e-08 | 3.34e-07 | 2.65e-07 | 76 |
| hsa05016210 | Esophagus | ESCC | Huntington disease | 226/4205 | 306/8465 | 1.38e-18 | 8.72e-17 | 4.46e-17 | 226 |
| hsa04144210 | Esophagus | ESCC | Endocytosis | 186/4205 | 251/8465 | 9.74e-16 | 4.66e-14 | 2.39e-14 | 186 |
| hsa0501638 | Esophagus | ESCC | Huntington disease | 226/4205 | 306/8465 | 1.38e-18 | 8.72e-17 | 4.46e-17 | 226 |
| hsa0414437 | Esophagus | ESCC | Endocytosis | 186/4205 | 251/8465 | 9.74e-16 | 4.66e-14 | 2.39e-14 | 186 |
| hsa0501614 | Liver | Cirrhotic | Huntington disease | 172/2530 | 306/8465 | 1.65e-22 | 1.10e-20 | 6.77e-21 | 172 |
| hsa0414412 | Liver | Cirrhotic | Endocytosis | 119/2530 | 251/8465 | 2.33e-09 | 4.56e-08 | 2.81e-08 | 119 |
| hsa0501615 | Liver | Cirrhotic | Huntington disease | 172/2530 | 306/8465 | 1.65e-22 | 1.10e-20 | 6.77e-21 | 172 |
| hsa0414413 | Liver | Cirrhotic | Endocytosis | 119/2530 | 251/8465 | 2.33e-09 | 4.56e-08 | 2.81e-08 | 119 |
| hsa0501622 | Liver | HCC | Huntington disease | 219/4020 | 306/8465 | 3.06e-18 | 3.42e-16 | 1.90e-16 | 219 |
| hsa0414422 | Liver | HCC | Endocytosis | 178/4020 | 251/8465 | 2.03e-14 | 5.22e-13 | 2.91e-13 | 178 |
| hsa0501632 | Liver | HCC | Huntington disease | 219/4020 | 306/8465 | 3.06e-18 | 3.42e-16 | 1.90e-16 | 219 |
| hsa0414432 | Liver | HCC | Endocytosis | 178/4020 | 251/8465 | 2.03e-14 | 5.22e-13 | 2.91e-13 | 178 |
| hsa0414427 | Oral cavity | OSCC | Endocytosis | 174/3704 | 251/8465 | 9.42e-17 | 4.51e-15 | 2.29e-15 | 174 |
| hsa0501628 | Oral cavity | OSCC | Huntington disease | 204/3704 | 306/8465 | 1.70e-16 | 7.13e-15 | 3.63e-15 | 204 |
| hsa04144112 | Oral cavity | OSCC | Endocytosis | 174/3704 | 251/8465 | 9.42e-17 | 4.51e-15 | 2.29e-15 | 174 |
| hsa05016112 | Oral cavity | OSCC | Huntington disease | 204/3704 | 306/8465 | 1.70e-16 | 7.13e-15 | 3.63e-15 | 204 |
| Page: 1 2 |
Top |
Cell-cell communication analysis |
| Identification of potential cell-cell interactions between two cell types and their ligand-receptor pairs for different disease states |
| Ligand | Receptor | LRpair | Pathway | Tissue | Disease Stage |
| Page: 1 |
Top |
Single-cell gene regulatory network inference analysis |
| Find out the significant the regulons (TFs) and the target genes of each regulon across cell types for different disease states |
| TF | Cell Type | Tissue | Disease Stage | Target Gene | RSS | Regulon Activity |
| ∗The dot plots of a searched regulon are shown for all cell subpopulations in each disease state of each tissue based on the regulon specific score inferred using pySCENIC and by calculating the average expression. |
| Page: 1 |
Top |
Somatic mutation of malignant transformation related genes |
| Annotation of somatic variants for genes involved in malignant transformation |
| Hugo Symbol | Variant Class | Variant Classification | dbSNP RS | HGVSc | HGVSp | HGVSp Short | SWISSPROT | BIOTYPE | SIFT | PolyPhen | Tumor Sample Barcode | Tissue | Histology | Sex | Age | Stage | Therapy Types | Drugs | Outcome |
| AP2A2 | SNV | Missense_Mutation | novel | c.199N>G | p.Leu67Val | p.L67V | O94973 | protein_coding | deleterious(0.01) | probably_damaging(0.97) | TCGA-5L-AAT1-01 | Breast | breast invasive carcinoma | Female | <65 | III/IV | Hormone Therapy | letrozol | SD |
| AP2A2 | SNV | Missense_Mutation | novel | c.1615G>T | p.Ala539Ser | p.A539S | O94973 | protein_coding | tolerated(0.11) | benign(0.178) | TCGA-A2-A25A-01 | Breast | breast invasive carcinoma | Female | <65 | I/II | Unspecific | Cytoxan | SD |
| AP2A2 | SNV | Missense_Mutation | c.343G>A | p.Ala115Thr | p.A115T | O94973 | protein_coding | deleterious(0.04) | probably_damaging(0.936) | TCGA-A7-A4SF-01 | Breast | breast invasive carcinoma | Female | <65 | I/II | Chemotherapy | carboplatin | CR | |
| AP2A2 | SNV | Missense_Mutation | novel | c.2483N>C | p.Phe828Ser | p.F828S | O94973 | protein_coding | tolerated(0.18) | probably_damaging(0.938) | TCGA-BH-A0AZ-01 | Breast | breast invasive carcinoma | Female | <65 | III/IV | Chemotherapy | doxorubicin | CR |
| AP2A2 | SNV | Missense_Mutation | c.1024G>A | p.Glu342Lys | p.E342K | O94973 | protein_coding | deleterious(0) | probably_damaging(0.994) | TCGA-BH-A0W7-01 | Breast | breast invasive carcinoma | Female | <65 | I/II | Chemotherapy | taxotere | CR | |
| AP2A2 | SNV | Missense_Mutation | c.554N>C | p.Met185Thr | p.M185T | O94973 | protein_coding | tolerated(0.39) | benign(0.005) | TCGA-D8-A1XK-01 | Breast | breast invasive carcinoma | Female | <65 | I/II | Chemotherapy | doxorubicine+cyclophosphamide | SD | |
| AP2A2 | insertion | Frame_Shift_Ins | novel | c.191_192insGATCACGTATAAAAGTAAGTCAGGGACGGGCA | p.Phe64LeufsTer28 | p.F64Lfs*28 | O94973 | protein_coding | TCGA-A8-A07L-01 | Breast | breast invasive carcinoma | Female | <65 | III/IV | Chemotherapy | CR | |||
| AP2A2 | deletion | Frame_Shift_Del | novel | c.2517delT | p.Gln840AsnfsTer6 | p.Q840Nfs*6 | O94973 | protein_coding | TCGA-EW-A2FV-01 | Breast | breast invasive carcinoma | Female | <65 | III/IV | Chemotherapy | docetaxel | SD | ||
| AP2A2 | SNV | Missense_Mutation | novel | c.484N>A | p.Asp162Asn | p.D162N | O94973 | protein_coding | tolerated(0.27) | probably_damaging(0.975) | TCGA-2W-A8YY-01 | Cervix | cervical & endocervical cancer | Female | <65 | I/II | Chemotherapy | cisplatin | CR |
| AP2A2 | SNV | Missense_Mutation | c.120C>G | p.Ile40Met | p.I40M | O94973 | protein_coding | deleterious(0) | probably_damaging(0.996) | TCGA-EK-A2PL-01 | Cervix | cervical & endocervical cancer | Female | <65 | III/IV | Unknown | Unknown | SD |
| Page: 1 2 3 4 5 6 7 8 9 10 11 |
Top |
Related drugs of malignant transformation related genes |
| Identification of chemicals and drugs interact with genes involved in malignant transfromation |
| (DGIdb 4.0) |
| Entrez ID | Symbol | Category | Interaction Types | Drug Claim Name | Drug Name | PMIDs |
| Page: 1 |

Copyright 2023-Present -The University of Texas Health Science Center at Houston |