
|
|||||
|
 | |
| |
| |
| |
| |
| |
|
Gene: AP2A1 |
Gene summary for AP2A1 |
| Gene information | Species | Human | Gene symbol | AP2A1 | Gene ID | 160 |
| Gene name | adaptor related protein complex 2 subunit alpha 1 | |
| Gene Alias | ADTAA | |
| Cytomap | 19q13.33 | |
| Gene Type | protein-coding | GO ID | GO:0000271 | UniProtAcc | O95782 |
Top |
Malignant transformation analysis |
| Identification of the aberrant gene expression in precancerous and cancerous lesions by comparing the gene expression of stem-like cells in diseased tissues with normal stem cells |
| Entrez ID | Symbol | Replicates | Species | Organ | Tissue | Adj P-value | Log2FC | Malignancy |
| 160 | AP2A1 | LZE4T | Human | Esophagus | ESCC | 1.28e-06 | 1.51e-01 | 0.0811 |
| 160 | AP2A1 | LZE7T | Human | Esophagus | ESCC | 2.12e-07 | 4.39e-01 | 0.0667 |
| 160 | AP2A1 | LZE8T | Human | Esophagus | ESCC | 8.64e-04 | 1.49e-01 | 0.067 |
| 160 | AP2A1 | LZE20T | Human | Esophagus | ESCC | 1.11e-02 | 2.09e-01 | 0.0662 |
| 160 | AP2A1 | LZE22T | Human | Esophagus | ESCC | 9.28e-05 | 4.86e-01 | 0.068 |
| 160 | AP2A1 | LZE24T | Human | Esophagus | ESCC | 2.34e-25 | 5.92e-01 | 0.0596 |
| 160 | AP2A1 | LZE21T | Human | Esophagus | ESCC | 1.11e-03 | 2.25e-01 | 0.0655 |
| 160 | AP2A1 | LZE6T | Human | Esophagus | ESCC | 1.34e-04 | 2.74e-01 | 0.0845 |
| 160 | AP2A1 | P1T-E | Human | Esophagus | ESCC | 1.30e-14 | 7.74e-01 | 0.0875 |
| 160 | AP2A1 | P2T-E | Human | Esophagus | ESCC | 2.18e-21 | 3.70e-01 | 0.1177 |
| 160 | AP2A1 | P4T-E | Human | Esophagus | ESCC | 6.38e-16 | 3.63e-01 | 0.1323 |
| 160 | AP2A1 | P5T-E | Human | Esophagus | ESCC | 3.29e-08 | 1.79e-01 | 0.1327 |
| 160 | AP2A1 | P8T-E | Human | Esophagus | ESCC | 2.01e-51 | 8.56e-01 | 0.0889 |
| 160 | AP2A1 | P9T-E | Human | Esophagus | ESCC | 7.19e-13 | 2.50e-01 | 0.1131 |
| 160 | AP2A1 | P10T-E | Human | Esophagus | ESCC | 1.65e-23 | 4.77e-01 | 0.116 |
| 160 | AP2A1 | P11T-E | Human | Esophagus | ESCC | 8.81e-27 | 9.57e-01 | 0.1426 |
| 160 | AP2A1 | P12T-E | Human | Esophagus | ESCC | 5.76e-27 | 5.09e-01 | 0.1122 |
| 160 | AP2A1 | P15T-E | Human | Esophagus | ESCC | 6.53e-32 | 6.54e-01 | 0.1149 |
| 160 | AP2A1 | P16T-E | Human | Esophagus | ESCC | 6.62e-15 | 1.91e-01 | 0.1153 |
| 160 | AP2A1 | P17T-E | Human | Esophagus | ESCC | 2.05e-13 | 6.51e-01 | 0.1278 |
| Page: 1 2 3 4 5 6 |
| Tissue | Expression Dynamics | Abbreviation |
| Esophagus |  | ESCC: Esophageal squamous cell carcinoma |
| HGIN: High-grade intraepithelial neoplasias | ||
| LGIN: Low-grade intraepithelial neoplasias | ||
| Liver |  | HCC: Hepatocellular carcinoma |
| NAFLD: Non-alcoholic fatty liver disease | ||
| Oral Cavity | 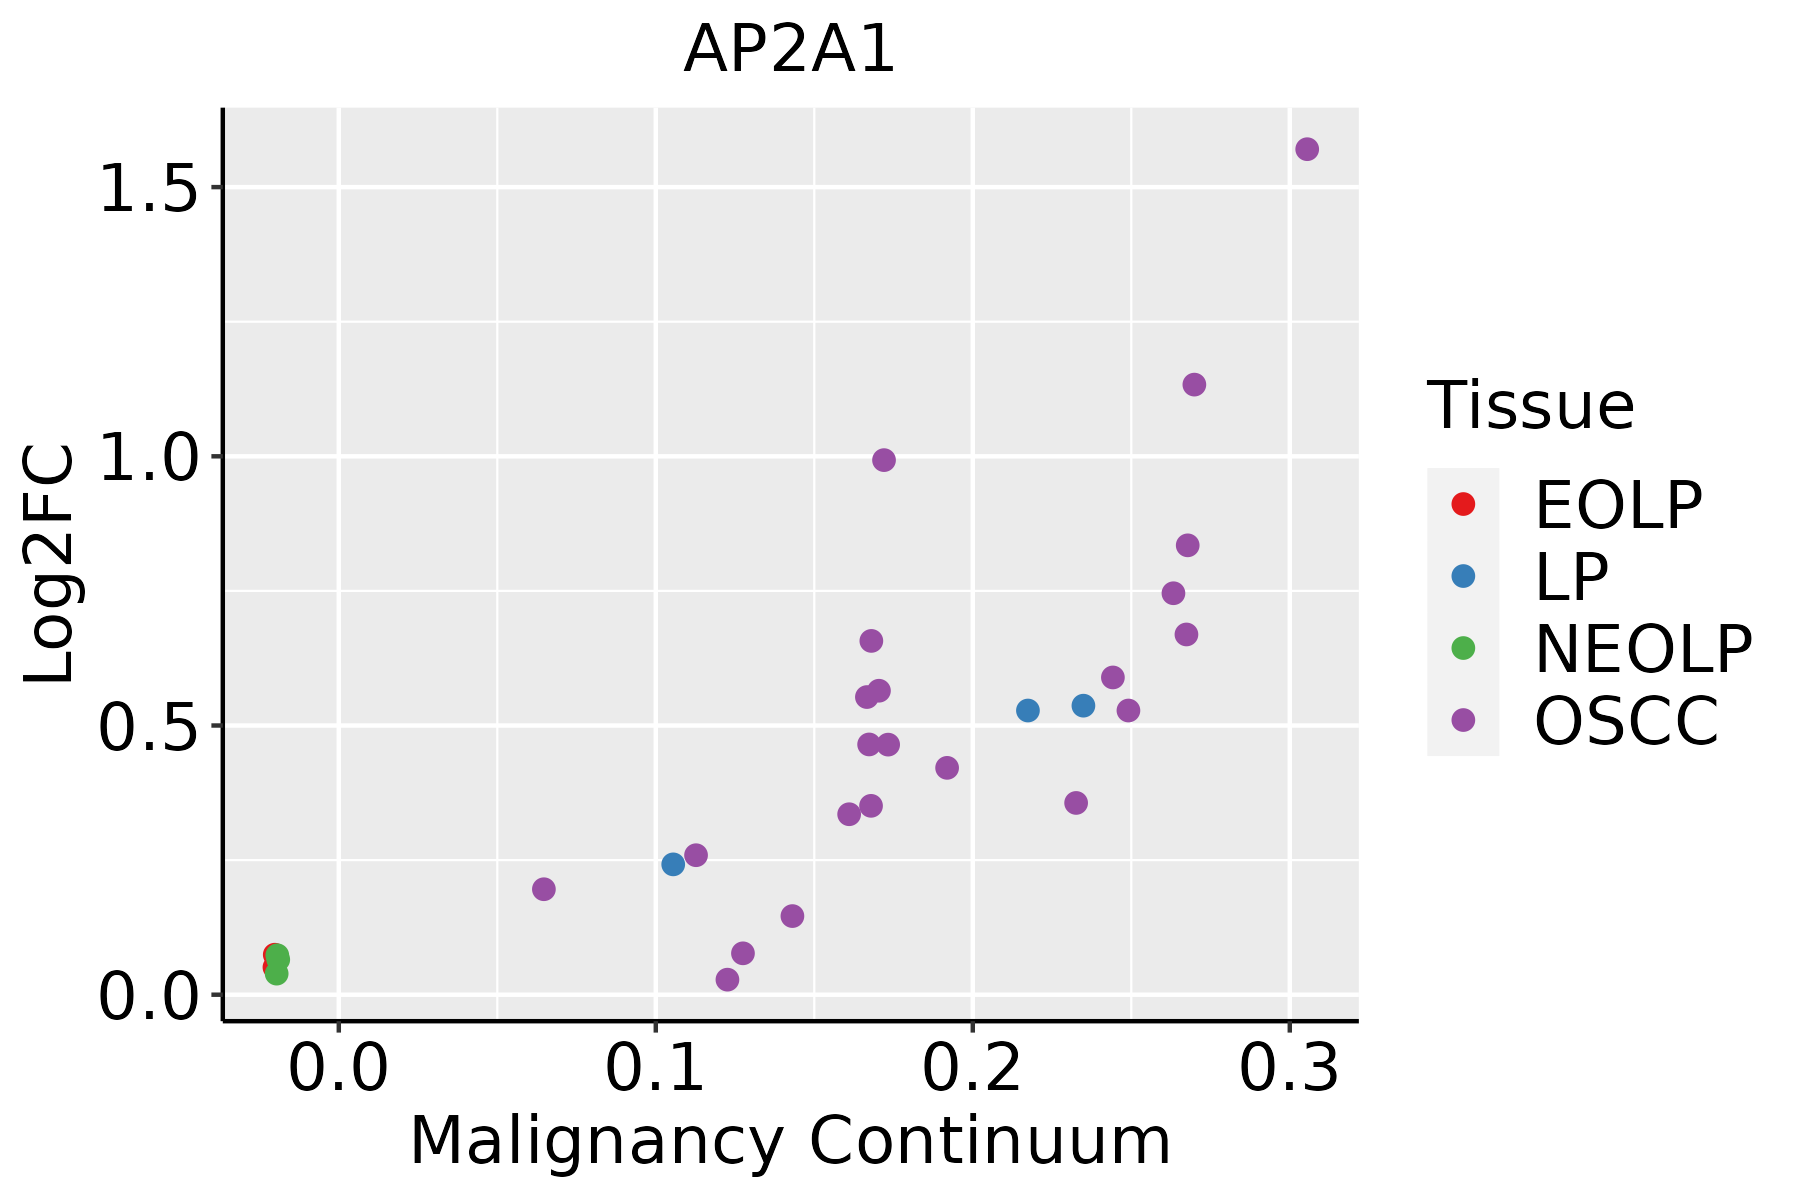 | EOLP: Erosive Oral lichen planus |
| LP: leukoplakia | ||
| NEOLP: Non-erosive oral lichen planus | ||
| OSCC: Oral squamous cell carcinoma | ||
| Skin |  | AK: Actinic keratosis |
| cSCC: Cutaneous squamous cell carcinoma | ||
| SCCIS:squamous cell carcinoma in situ | ||
| Thyroid |  | ATC: Anaplastic thyroid cancer |
| HT: Hashimoto's thyroiditis | ||
| PTC: Papillary thyroid cancer |
| ∗log2FC in expression of this searched gene in stem-like cells from each diseased tissue sample relative to stem-like cells in normal samples in each tissue plotted against the malignancy continuum. Samples are colored based on if they are from different disease stage. |
Top |
Malignant transformation related pathway analysis |
| Find out the enriched GO biological processes and KEGG pathways involved in transition from healthy to precancer to cancer |
| Tissue | Disease Stage | Enriched GO biological Processes |
| Colorectum | AD |  |
| Colorectum | SER |  |
| Colorectum | MSS |  |
| Colorectum | MSI-H |  |
| Colorectum | FAP |  |
| ∗Top 15 enriched GO BP terms are showed in the bar plot of each disease state in each tissue. Each row represents a significant GO biological process which is colored according to the -log10(p.adjust). |
| Page: 1 2 3 4 5 6 7 8 9 |
| GO ID | Tissue | Disease Stage | Description | Gene Ratio | Bg Ratio | pvalue | p.adjust | Count |
| GO:004819318 | Esophagus | ESCC | Golgi vesicle transport | 231/8552 | 296/18723 | 1.82e-30 | 9.63e-28 | 231 |
| GO:001648210 | Esophagus | ESCC | cytosolic transport | 124/8552 | 168/18723 | 9.69e-14 | 4.69e-12 | 124 |
| GO:000689215 | Esophagus | ESCC | post-Golgi vesicle-mediated transport | 82/8552 | 104/18723 | 4.00e-12 | 1.55e-10 | 82 |
| GO:003010018 | Esophagus | ESCC | regulation of endocytosis | 135/8552 | 211/18723 | 5.75e-08 | 1.02e-06 | 135 |
| GO:004580718 | Esophagus | ESCC | positive regulation of endocytosis | 69/8552 | 100/18723 | 1.97e-06 | 2.29e-05 | 69 |
| GO:003134616 | Esophagus | ESCC | positive regulation of cell projection organization | 201/8552 | 353/18723 | 1.19e-05 | 1.11e-04 | 201 |
| GO:000689818 | Esophagus | ESCC | receptor-mediated endocytosis | 142/8552 | 244/18723 | 5.22e-05 | 4.05e-04 | 142 |
| GO:007258314 | Esophagus | ESCC | clathrin-dependent endocytosis | 34/8552 | 47/18723 | 1.91e-04 | 1.21e-03 | 34 |
| GO:001097516 | Esophagus | ESCC | regulation of neuron projection development | 240/8552 | 445/18723 | 2.48e-04 | 1.53e-03 | 240 |
| GO:00160514 | Esophagus | ESCC | carbohydrate biosynthetic process | 117/8552 | 202/18723 | 2.96e-04 | 1.79e-03 | 117 |
| GO:004825916 | Esophagus | ESCC | regulation of receptor-mediated endocytosis | 66/8552 | 110/18723 | 1.72e-03 | 7.96e-03 | 66 |
| GO:00061096 | Esophagus | ESCC | regulation of carbohydrate metabolic process | 101/8552 | 178/18723 | 1.89e-03 | 8.52e-03 | 101 |
| GO:004826010 | Esophagus | ESCC | positive regulation of receptor-mediated endocytosis | 34/8552 | 52/18723 | 3.26e-03 | 1.35e-02 | 34 |
| GO:00109764 | Esophagus | ESCC | positive regulation of neuron projection development | 91/8552 | 163/18723 | 5.72e-03 | 2.13e-02 | 91 |
| GO:0006024 | Esophagus | ESCC | glycosaminoglycan biosynthetic process | 45/8552 | 75/18723 | 8.75e-03 | 3.08e-02 | 45 |
| GO:0006023 | Esophagus | ESCC | aminoglycan biosynthetic process | 47/8552 | 79/18723 | 9.29e-03 | 3.23e-02 | 47 |
| GO:00068953 | Esophagus | ESCC | Golgi to endosome transport | 13/8552 | 17/18723 | 1.00e-02 | 3.42e-02 | 13 |
| GO:004819321 | Liver | HCC | Golgi vesicle transport | 217/7958 | 296/18723 | 2.58e-27 | 1.02e-24 | 217 |
| GO:001648221 | Liver | HCC | cytosolic transport | 117/7958 | 168/18723 | 8.83e-13 | 4.48e-11 | 117 |
| GO:000689221 | Liver | HCC | post-Golgi vesicle-mediated transport | 77/7958 | 104/18723 | 6.14e-11 | 2.24e-09 | 77 |
| Page: 1 2 3 4 5 |
| Pathway ID | Tissue | Disease Stage | Description | Gene Ratio | Bg Ratio | pvalue | p.adjust | qvalue | Count |
| hsa05016210 | Esophagus | ESCC | Huntington disease | 226/4205 | 306/8465 | 1.38e-18 | 8.72e-17 | 4.46e-17 | 226 |
| hsa04144210 | Esophagus | ESCC | Endocytosis | 186/4205 | 251/8465 | 9.74e-16 | 4.66e-14 | 2.39e-14 | 186 |
| hsa0501638 | Esophagus | ESCC | Huntington disease | 226/4205 | 306/8465 | 1.38e-18 | 8.72e-17 | 4.46e-17 | 226 |
| hsa0414437 | Esophagus | ESCC | Endocytosis | 186/4205 | 251/8465 | 9.74e-16 | 4.66e-14 | 2.39e-14 | 186 |
| hsa0501622 | Liver | HCC | Huntington disease | 219/4020 | 306/8465 | 3.06e-18 | 3.42e-16 | 1.90e-16 | 219 |
| hsa0414422 | Liver | HCC | Endocytosis | 178/4020 | 251/8465 | 2.03e-14 | 5.22e-13 | 2.91e-13 | 178 |
| hsa0501632 | Liver | HCC | Huntington disease | 219/4020 | 306/8465 | 3.06e-18 | 3.42e-16 | 1.90e-16 | 219 |
| hsa0414432 | Liver | HCC | Endocytosis | 178/4020 | 251/8465 | 2.03e-14 | 5.22e-13 | 2.91e-13 | 178 |
| hsa0414427 | Oral cavity | OSCC | Endocytosis | 174/3704 | 251/8465 | 9.42e-17 | 4.51e-15 | 2.29e-15 | 174 |
| hsa0501628 | Oral cavity | OSCC | Huntington disease | 204/3704 | 306/8465 | 1.70e-16 | 7.13e-15 | 3.63e-15 | 204 |
| hsa04144112 | Oral cavity | OSCC | Endocytosis | 174/3704 | 251/8465 | 9.42e-17 | 4.51e-15 | 2.29e-15 | 174 |
| hsa05016112 | Oral cavity | OSCC | Huntington disease | 204/3704 | 306/8465 | 1.70e-16 | 7.13e-15 | 3.63e-15 | 204 |
| hsa0501629 | Oral cavity | LP | Huntington disease | 172/2418 | 306/8465 | 6.31e-25 | 5.25e-23 | 3.39e-23 | 172 |
| hsa0414428 | Oral cavity | LP | Endocytosis | 121/2418 | 251/8465 | 1.89e-11 | 3.70e-10 | 2.38e-10 | 121 |
| hsa0501637 | Oral cavity | LP | Huntington disease | 172/2418 | 306/8465 | 6.31e-25 | 5.25e-23 | 3.39e-23 | 172 |
| hsa0414436 | Oral cavity | LP | Endocytosis | 121/2418 | 251/8465 | 1.89e-11 | 3.70e-10 | 2.38e-10 | 121 |
| Page: 1 |
Top |
Cell-cell communication analysis |
| Identification of potential cell-cell interactions between two cell types and their ligand-receptor pairs for different disease states |
| Ligand | Receptor | LRpair | Pathway | Tissue | Disease Stage |
| Page: 1 |
Top |
Single-cell gene regulatory network inference analysis |
| Find out the significant the regulons (TFs) and the target genes of each regulon across cell types for different disease states |
| TF | Cell Type | Tissue | Disease Stage | Target Gene | RSS | Regulon Activity |
| ∗The dot plots of a searched regulon are shown for all cell subpopulations in each disease state of each tissue based on the regulon specific score inferred using pySCENIC and by calculating the average expression. |
| Page: 1 |
Top |
Somatic mutation of malignant transformation related genes |
| Annotation of somatic variants for genes involved in malignant transformation |
| Hugo Symbol | Variant Class | Variant Classification | dbSNP RS | HGVSc | HGVSp | HGVSp Short | SWISSPROT | BIOTYPE | SIFT | PolyPhen | Tumor Sample Barcode | Tissue | Histology | Sex | Age | Stage | Therapy Types | Drugs | Outcome |
| AP2A1 | SNV | Missense_Mutation | c.599N>G | p.His200Arg | p.H200R | O95782 | protein_coding | deleterious(0.02) | probably_damaging(0.989) | TCGA-A8-A07R-01 | Breast | breast invasive carcinoma | Female | >=65 | III/IV | Ancillary | zoledronic | SD | |
| AP2A1 | SNV | Missense_Mutation | c.2617C>G | p.Gln873Glu | p.Q873E | O95782 | protein_coding | tolerated(1) | benign(0) | TCGA-AO-A124-01 | Breast | breast invasive carcinoma | Female | <65 | I/II | Chemotherapy | doxorubicin | SD | |
| AP2A1 | SNV | Missense_Mutation | c.1192N>A | p.Asp398Asn | p.D398N | O95782 | protein_coding | deleterious(0) | benign(0.337) | TCGA-AQ-A0Y5-01 | Breast | breast invasive carcinoma | Female | >=65 | III/IV | Chemotherapy | cytoxan | SD | |
| AP2A1 | SNV | Missense_Mutation | c.1022N>C | p.Arg341Pro | p.R341P | O95782 | protein_coding | deleterious(0) | probably_damaging(0.989) | TCGA-BH-A1EO-01 | Breast | breast invasive carcinoma | Female | >=65 | I/II | Unknown | Unknown | SD | |
| AP2A1 | SNV | Missense_Mutation | rs747466046 | c.859N>T | p.Val287Leu | p.V287L | O95782 | protein_coding | deleterious(0.04) | benign(0.159) | TCGA-BH-A1FJ-01 | Breast | breast invasive carcinoma | Female | >=65 | III/IV | Unknown | Unknown | SD |
| AP2A1 | SNV | Missense_Mutation | c.1417N>A | p.Asp473Asn | p.D473N | O95782 | protein_coding | deleterious(0.02) | possibly_damaging(0.566) | TCGA-EW-A1J5-01 | Breast | breast invasive carcinoma | Female | <65 | I/II | Chemotherapy | adriamycin | SD | |
| AP2A1 | insertion | Frame_Shift_Ins | novel | c.1066_1067insCAGGATTAATGGTAACATGTAA | p.Leu356ProfsTer16 | p.L356Pfs*16 | O95782 | protein_coding | TCGA-A8-A08H-01 | Breast | breast invasive carcinoma | Female | >=65 | I/II | Unknown | Unknown | SD | ||
| AP2A1 | SNV | Missense_Mutation | novel | c.835N>T | p.Arg279Trp | p.R279W | O95782 | protein_coding | deleterious(0.01) | probably_damaging(0.999) | TCGA-2W-A8YY-01 | Cervix | cervical & endocervical cancer | Female | <65 | I/II | Chemotherapy | cisplatin | CR |
| AP2A1 | SNV | Missense_Mutation | novel | c.2221N>A | p.Asp741Asn | p.D741N | O95782 | protein_coding | tolerated(0.09) | probably_damaging(0.959) | TCGA-2W-A8YY-01 | Cervix | cervical & endocervical cancer | Female | <65 | I/II | Chemotherapy | cisplatin | CR |
| AP2A1 | SNV | Missense_Mutation | c.2485G>A | p.Glu829Lys | p.E829K | O95782 | protein_coding | deleterious(0) | possibly_damaging(0.904) | TCGA-EA-A6QX-01 | Cervix | cervical & endocervical cancer | Female | <65 | III/IV | Unknown | Unknown | SD |
| Page: 1 2 3 4 5 6 7 8 |
Top |
Related drugs of malignant transformation related genes |
| Identification of chemicals and drugs interact with genes involved in malignant transfromation |
| (DGIdb 4.0) |
| Entrez ID | Symbol | Category | Interaction Types | Drug Claim Name | Drug Name | PMIDs |
| Page: 1 |

Copyright 2023-Present -The University of Texas Health Science Center at Houston |