
|
|||||
|
 | |
| |
| |
| |
| |
| |
|
Gene: AP1S3 |
Gene summary for AP1S3 |
| Gene information | Species | Human | Gene symbol | AP1S3 | Gene ID | 130340 |
| Gene name | adaptor related protein complex 1 subunit sigma 3 | |
| Gene Alias | PSORS15 | |
| Cytomap | 2q36.1 | |
| Gene Type | protein-coding | GO ID | GO:0006605 | UniProtAcc | Q96PC3 |
Top |
Malignant transformation analysis |
| Identification of the aberrant gene expression in precancerous and cancerous lesions by comparing the gene expression of stem-like cells in diseased tissues with normal stem cells |
| Entrez ID | Symbol | Replicates | Species | Organ | Tissue | Adj P-value | Log2FC | Malignancy |
| 130340 | AP1S3 | P4T-E | Human | Esophagus | ESCC | 1.27e-03 | 1.28e-01 | 0.1323 |
| 130340 | AP1S3 | P5T-E | Human | Esophagus | ESCC | 6.69e-10 | 1.97e-01 | 0.1327 |
| 130340 | AP1S3 | P8T-E | Human | Esophagus | ESCC | 1.82e-04 | 1.09e-01 | 0.0889 |
| 130340 | AP1S3 | P10T-E | Human | Esophagus | ESCC | 1.86e-02 | 3.43e-02 | 0.116 |
| 130340 | AP1S3 | P12T-E | Human | Esophagus | ESCC | 6.13e-06 | 1.45e-01 | 0.1122 |
| 130340 | AP1S3 | P15T-E | Human | Esophagus | ESCC | 1.10e-06 | 1.80e-01 | 0.1149 |
| 130340 | AP1S3 | P21T-E | Human | Esophagus | ESCC | 1.09e-08 | 2.00e-01 | 0.1617 |
| 130340 | AP1S3 | P23T-E | Human | Esophagus | ESCC | 2.20e-03 | 9.04e-02 | 0.108 |
| 130340 | AP1S3 | P24T-E | Human | Esophagus | ESCC | 1.05e-08 | 1.31e-01 | 0.1287 |
| 130340 | AP1S3 | P26T-E | Human | Esophagus | ESCC | 5.76e-08 | 1.77e-01 | 0.1276 |
| 130340 | AP1S3 | P27T-E | Human | Esophagus | ESCC | 1.41e-05 | 8.09e-02 | 0.1055 |
| 130340 | AP1S3 | P28T-E | Human | Esophagus | ESCC | 2.29e-13 | 2.28e-01 | 0.1149 |
| 130340 | AP1S3 | P31T-E | Human | Esophagus | ESCC | 2.06e-02 | 2.22e-02 | 0.1251 |
| 130340 | AP1S3 | P32T-E | Human | Esophagus | ESCC | 4.25e-02 | 3.05e-02 | 0.1666 |
| 130340 | AP1S3 | P39T-E | Human | Esophagus | ESCC | 7.21e-03 | 6.66e-02 | 0.0894 |
| 130340 | AP1S3 | P49T-E | Human | Esophagus | ESCC | 1.52e-05 | 5.95e-01 | 0.1768 |
| 130340 | AP1S3 | P52T-E | Human | Esophagus | ESCC | 2.07e-02 | 1.32e-01 | 0.1555 |
| 130340 | AP1S3 | P54T-E | Human | Esophagus | ESCC | 5.56e-03 | 8.09e-02 | 0.0975 |
| 130340 | AP1S3 | P57T-E | Human | Esophagus | ESCC | 1.89e-09 | 7.93e-02 | 0.0926 |
| 130340 | AP1S3 | P62T-E | Human | Esophagus | ESCC | 8.75e-05 | 9.11e-02 | 0.1302 |
| Page: 1 2 |
| Tissue | Expression Dynamics | Abbreviation |
| Esophagus | 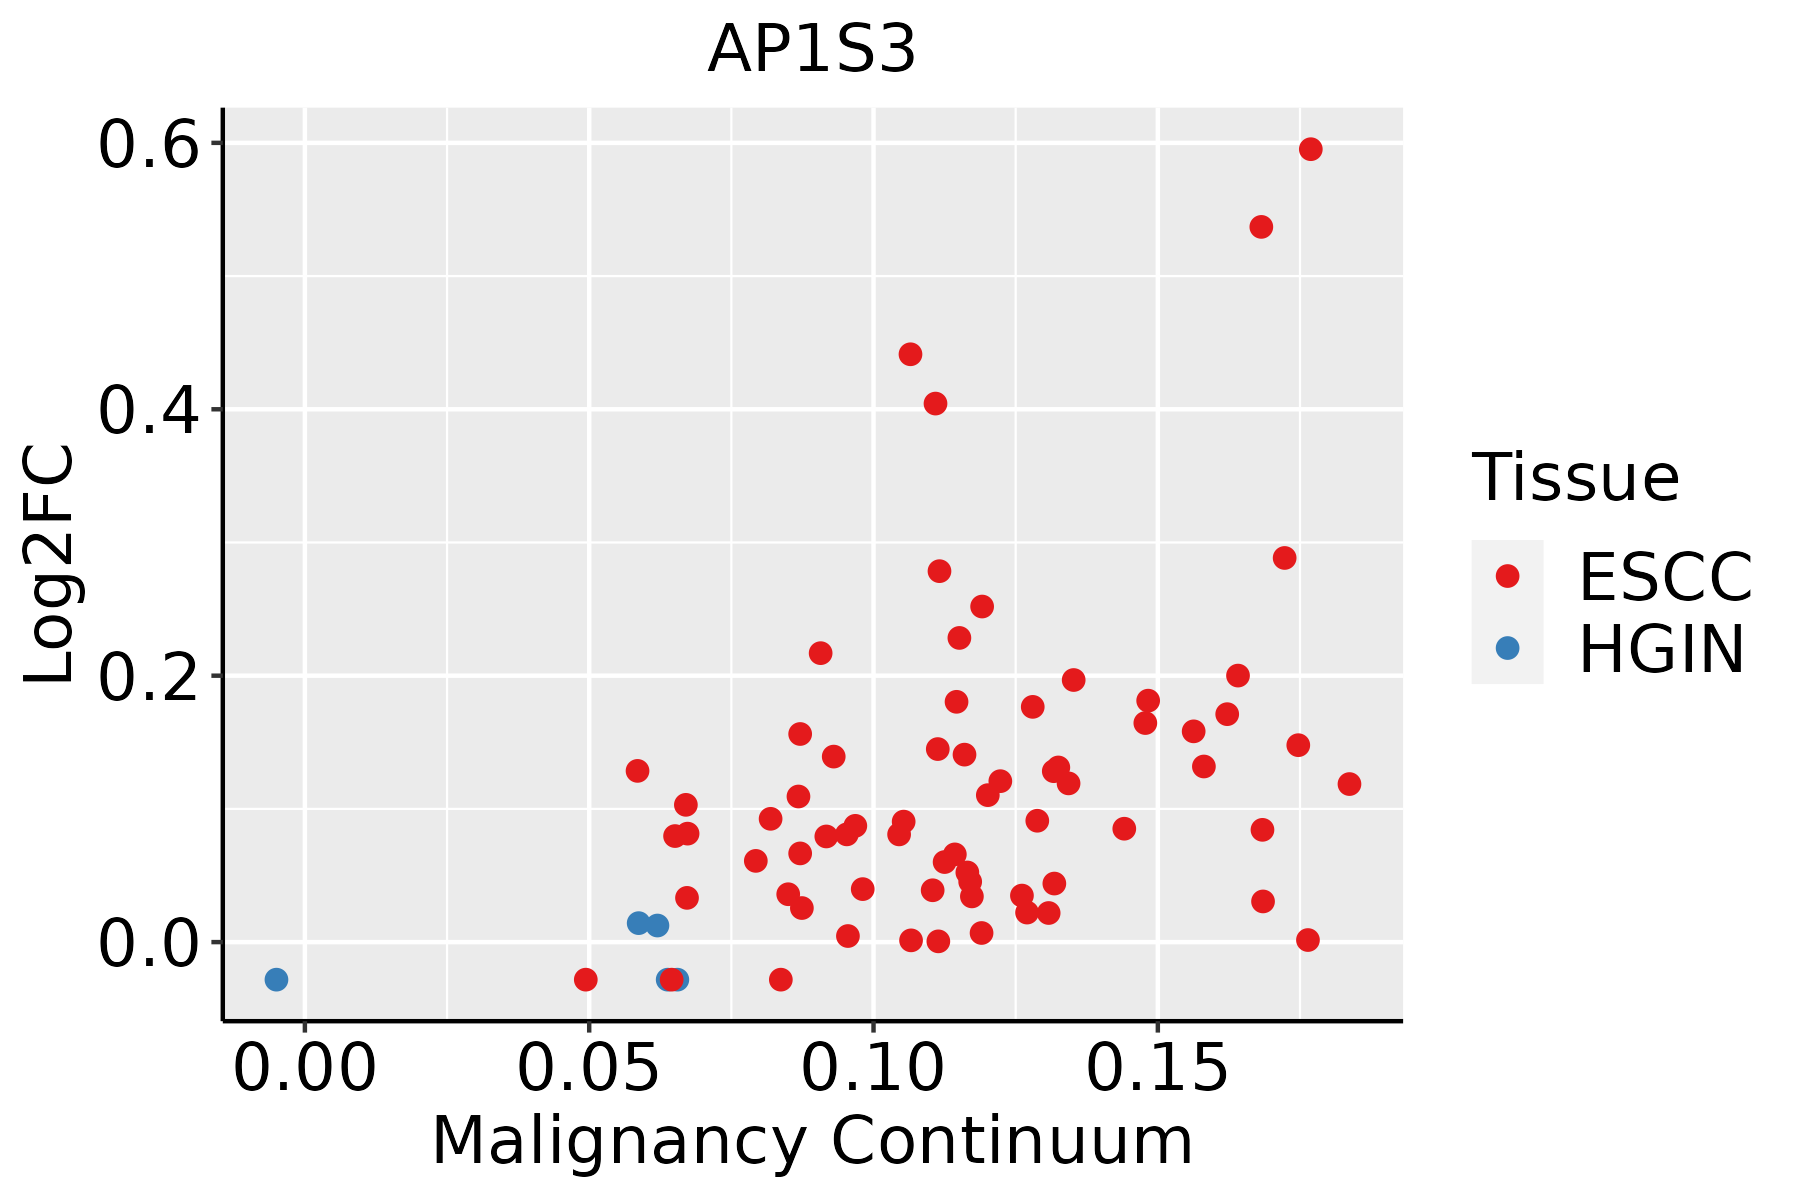 | ESCC: Esophageal squamous cell carcinoma |
| HGIN: High-grade intraepithelial neoplasias | ||
| LGIN: Low-grade intraepithelial neoplasias | ||
| Liver |  | HCC: Hepatocellular carcinoma |
| NAFLD: Non-alcoholic fatty liver disease |
| ∗log2FC in expression of this searched gene in stem-like cells from each diseased tissue sample relative to stem-like cells in normal samples in each tissue plotted against the malignancy continuum. Samples are colored based on if they are from different disease stage. |
Top |
Malignant transformation related pathway analysis |
| Find out the enriched GO biological processes and KEGG pathways involved in transition from healthy to precancer to cancer |
| Tissue | Disease Stage | Enriched GO biological Processes |
| Colorectum | AD |  |
| Colorectum | SER |  |
| Colorectum | MSS |  |
| Colorectum | MSI-H |  |
| Colorectum | FAP |  |
| ∗Top 15 enriched GO BP terms are showed in the bar plot of each disease state in each tissue. Each row represents a significant GO biological process which is colored according to the -log10(p.adjust). |
| Page: 1 2 3 4 5 6 7 8 9 |
| GO ID | Tissue | Disease Stage | Description | Gene Ratio | Bg Ratio | pvalue | p.adjust | Count |
| GO:0006605111 | Esophagus | ESCC | protein targeting | 229/8552 | 314/18723 | 4.93e-23 | 1.01e-20 | 229 |
| GO:000660512 | Liver | HCC | protein targeting | 219/7958 | 314/18723 | 7.74e-23 | 1.49e-20 | 219 |
| Page: 1 |
| Pathway ID | Tissue | Disease Stage | Description | Gene Ratio | Bg Ratio | pvalue | p.adjust | qvalue | Count |
| hsa05170210 | Esophagus | ESCC | Human immunodeficiency virus 1 infection | 147/4205 | 212/8465 | 3.37e-09 | 3.53e-08 | 1.81e-08 | 147 |
| hsa0517038 | Esophagus | ESCC | Human immunodeficiency virus 1 infection | 147/4205 | 212/8465 | 3.37e-09 | 3.53e-08 | 1.81e-08 | 147 |
| hsa041422 | Liver | HCC | Lysosome | 100/4020 | 132/8465 | 2.32e-11 | 4.31e-10 | 2.40e-10 | 100 |
| hsa051709 | Liver | HCC | Human immunodeficiency virus 1 infection | 125/4020 | 212/8465 | 4.51e-04 | 1.94e-03 | 1.08e-03 | 125 |
| hsa041423 | Liver | HCC | Lysosome | 100/4020 | 132/8465 | 2.32e-11 | 4.31e-10 | 2.40e-10 | 100 |
| hsa0517012 | Liver | HCC | Human immunodeficiency virus 1 infection | 125/4020 | 212/8465 | 4.51e-04 | 1.94e-03 | 1.08e-03 | 125 |
| Page: 1 |
Top |
Cell-cell communication analysis |
| Identification of potential cell-cell interactions between two cell types and their ligand-receptor pairs for different disease states |
| Ligand | Receptor | LRpair | Pathway | Tissue | Disease Stage |
| Page: 1 |
Top |
Single-cell gene regulatory network inference analysis |
| Find out the significant the regulons (TFs) and the target genes of each regulon across cell types for different disease states |
| TF | Cell Type | Tissue | Disease Stage | Target Gene | RSS | Regulon Activity |
| ∗The dot plots of a searched regulon are shown for all cell subpopulations in each disease state of each tissue based on the regulon specific score inferred using pySCENIC and by calculating the average expression. |
| Page: 1 |
Top |
Somatic mutation of malignant transformation related genes |
| Annotation of somatic variants for genes involved in malignant transformation |
| Hugo Symbol | Variant Class | Variant Classification | dbSNP RS | HGVSc | HGVSp | HGVSp Short | SWISSPROT | BIOTYPE | SIFT | PolyPhen | Tumor Sample Barcode | Tissue | Histology | Sex | Age | Stage | Therapy Types | Drugs | Outcome |
| AP1S3 | SNV | Missense_Mutation | c.24C>A | p.Phe8Leu | p.F8L | Q96PC3 | protein_coding | tolerated(0.3) | benign(0.203) | TCGA-AR-A0TV-01 | Breast | breast invasive carcinoma | Female | >=65 | I/II | Unknown | Unknown | SD | |
| AP1S3 | SNV | Missense_Mutation | rs750870128 | c.49N>A | p.Gln17Lys | p.Q17K | Q96PC3 | protein_coding | tolerated(0.2) | benign(0.295) | TCGA-B6-A1KI-01 | Breast | breast invasive carcinoma | Female | <65 | I/II | Unknown | Unknown | SD |
| AP1S3 | SNV | Missense_Mutation | rs750870128 | c.49N>A | p.Gln17Lys | p.Q17K | Q96PC3 | protein_coding | tolerated(0.2) | benign(0.295) | TCGA-C8-A274-01 | Breast | breast invasive carcinoma | Female | <65 | I/II | Hormone Therapy | tamoxiphen | SD |
| AP1S3 | SNV | Missense_Mutation | c.406N>A | p.Glu136Lys | p.E136K | Q96PC3 | protein_coding | tolerated(0.26) | benign(0.055) | TCGA-IR-A3LH-01 | Cervix | cervical & endocervical cancer | Female | <65 | I/II | Chemotherapy | cisplatin | CR | |
| AP1S3 | SNV | Missense_Mutation | rs775010779 | c.256C>T | p.Arg86Cys | p.R86C | Q96PC3 | protein_coding | deleterious(0) | probably_damaging(0.998) | TCGA-VS-A8QF-01 | Cervix | cervical & endocervical cancer | Female | <65 | I/II | Chemotherapy | cisplatin | CR |
| AP1S3 | SNV | Missense_Mutation | c.340N>A | p.Leu114Met | p.L114M | Q96PC3 | protein_coding | deleterious(0.02) | probably_damaging(0.983) | TCGA-AY-6197-01 | Colorectum | colon adenocarcinoma | Male | <65 | I/II | Unknown | Unknown | SD | |
| AP1S3 | SNV | Missense_Mutation | c.115N>T | p.Ile39Phe | p.I39F | Q96PC3 | protein_coding | deleterious(0) | possibly_damaging(0.647) | TCGA-DM-A1HA-01 | Colorectum | colon adenocarcinoma | Male | >=65 | III/IV | Unknown | Unknown | SD | |
| AP1S3 | SNV | Missense_Mutation | c.364N>A | p.Glu122Lys | p.E122K | Q96PC3 | protein_coding | deleterious(0.03) | possibly_damaging(0.743) | TCGA-G4-6315-01 | Colorectum | colon adenocarcinoma | Male | >=65 | III/IV | Chemotherapy | fluorouracil | SD | |
| AP1S3 | SNV | Missense_Mutation | rs370314390 | c.239N>T | p.Thr80Met | p.T80M | Q96PC3 | protein_coding | deleterious(0.03) | benign(0.405) | TCGA-WS-AB45-01 | Colorectum | colon adenocarcinoma | Female | <65 | I/II | Unknown | Unknown | SD |
| AP1S3 | SNV | Missense_Mutation | rs755623874 | c.44N>A | p.Arg15Gln | p.R15Q | Q96PC3 | protein_coding | deleterious(0.02) | probably_damaging(0.929) | TCGA-WS-AB45-01 | Colorectum | colon adenocarcinoma | Female | <65 | I/II | Unknown | Unknown | SD |
| Page: 1 2 3 |
Top |
Related drugs of malignant transformation related genes |
| Identification of chemicals and drugs interact with genes involved in malignant transfromation |
| (DGIdb 4.0) |
| Entrez ID | Symbol | Category | Interaction Types | Drug Claim Name | Drug Name | PMIDs |
| Page: 1 |

Copyright 2023-Present -The University of Texas Health Science Center at Houston |