
|
|||||
|
 | |
| |
| |
| |
| |
| |
|
Gene: AP1S2 |
Gene summary for AP1S2 |
| Gene information | Species | Human | Gene symbol | AP1S2 | Gene ID | 8905 |
| Gene name | adaptor related protein complex 1 subunit sigma 2 | |
| Gene Alias | DC22 | |
| Cytomap | Xp22.2 | |
| Gene Type | protein-coding | GO ID | GO:0006810 | UniProtAcc | F6SFB5 |
Top |
Malignant transformation analysis |
| Identification of the aberrant gene expression in precancerous and cancerous lesions by comparing the gene expression of stem-like cells in diseased tissues with normal stem cells |
| Entrez ID | Symbol | Replicates | Species | Organ | Tissue | Adj P-value | Log2FC | Malignancy |
| 8905 | AP1S2 | LZE4T | Human | Esophagus | ESCC | 3.44e-04 | 1.60e-01 | 0.0811 |
| 8905 | AP1S2 | LZE24T | Human | Esophagus | ESCC | 3.37e-12 | 2.03e-01 | 0.0596 |
| 8905 | AP1S2 | P2T-E | Human | Esophagus | ESCC | 1.73e-21 | 7.12e-01 | 0.1177 |
| 8905 | AP1S2 | P4T-E | Human | Esophagus | ESCC | 7.36e-17 | 5.81e-01 | 0.1323 |
| 8905 | AP1S2 | P5T-E | Human | Esophagus | ESCC | 2.54e-04 | 1.18e-01 | 0.1327 |
| 8905 | AP1S2 | P9T-E | Human | Esophagus | ESCC | 6.64e-08 | 4.39e-01 | 0.1131 |
| 8905 | AP1S2 | P10T-E | Human | Esophagus | ESCC | 5.79e-07 | 1.91e-01 | 0.116 |
| 8905 | AP1S2 | P11T-E | Human | Esophagus | ESCC | 6.47e-20 | 1.29e+00 | 0.1426 |
| 8905 | AP1S2 | P12T-E | Human | Esophagus | ESCC | 5.35e-07 | 2.32e-01 | 0.1122 |
| 8905 | AP1S2 | P15T-E | Human | Esophagus | ESCC | 3.20e-10 | 3.85e-01 | 0.1149 |
| 8905 | AP1S2 | P16T-E | Human | Esophagus | ESCC | 7.18e-12 | 3.57e-01 | 0.1153 |
| 8905 | AP1S2 | P19T-E | Human | Esophagus | ESCC | 1.53e-17 | 2.07e+00 | 0.1662 |
| 8905 | AP1S2 | P20T-E | Human | Esophagus | ESCC | 1.43e-06 | 3.13e-01 | 0.1124 |
| 8905 | AP1S2 | P21T-E | Human | Esophagus | ESCC | 1.35e-10 | 2.91e-01 | 0.1617 |
| 8905 | AP1S2 | P22T-E | Human | Esophagus | ESCC | 7.80e-09 | 8.29e-02 | 0.1236 |
| 8905 | AP1S2 | P23T-E | Human | Esophagus | ESCC | 4.37e-06 | 3.18e-01 | 0.108 |
| 8905 | AP1S2 | P24T-E | Human | Esophagus | ESCC | 3.52e-06 | 3.80e-01 | 0.1287 |
| 8905 | AP1S2 | P26T-E | Human | Esophagus | ESCC | 3.56e-50 | 1.10e+00 | 0.1276 |
| 8905 | AP1S2 | P27T-E | Human | Esophagus | ESCC | 1.16e-05 | 7.12e-02 | 0.1055 |
| 8905 | AP1S2 | P30T-E | Human | Esophagus | ESCC | 4.88e-13 | 5.48e-01 | 0.137 |
| Page: 1 2 3 4 |
| Tissue | Expression Dynamics | Abbreviation |
| Esophagus | 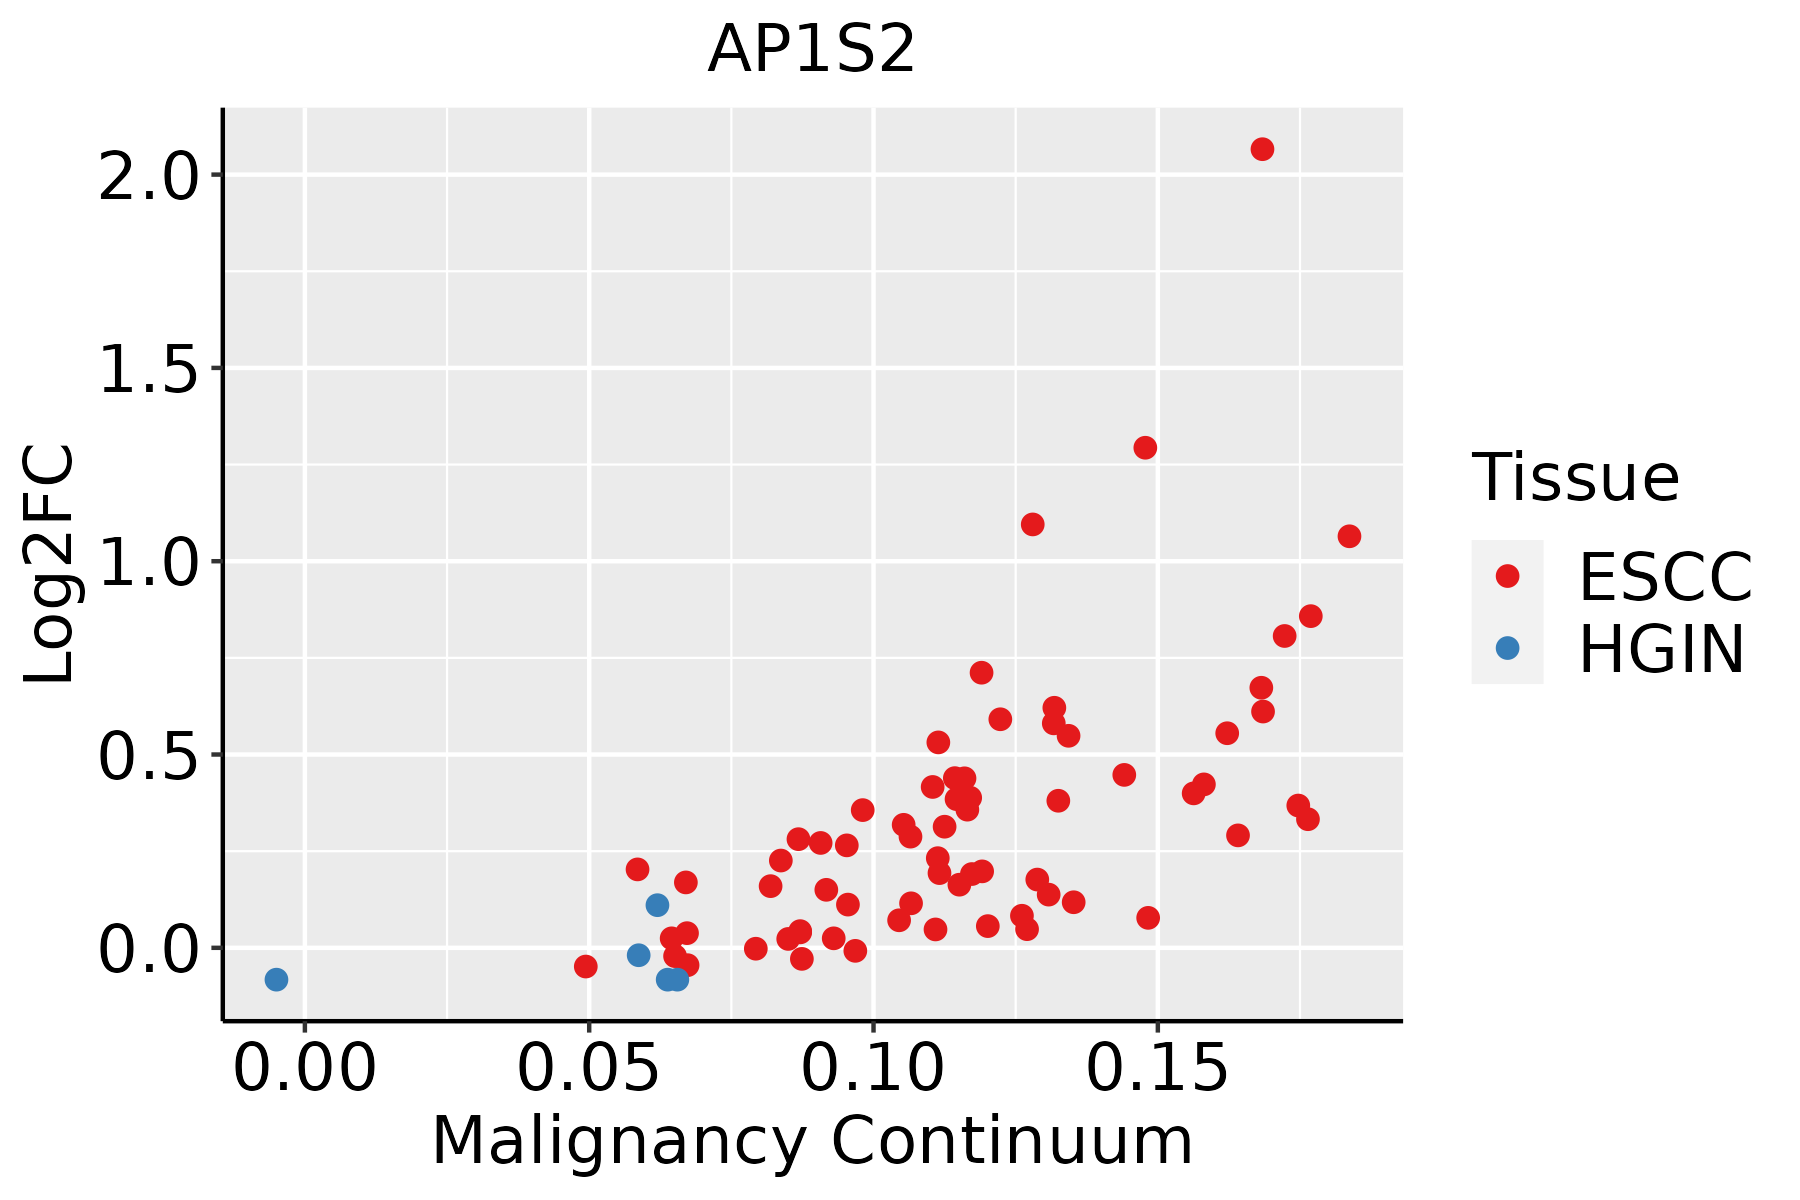 | ESCC: Esophageal squamous cell carcinoma |
| HGIN: High-grade intraepithelial neoplasias | ||
| LGIN: Low-grade intraepithelial neoplasias | ||
| Liver | 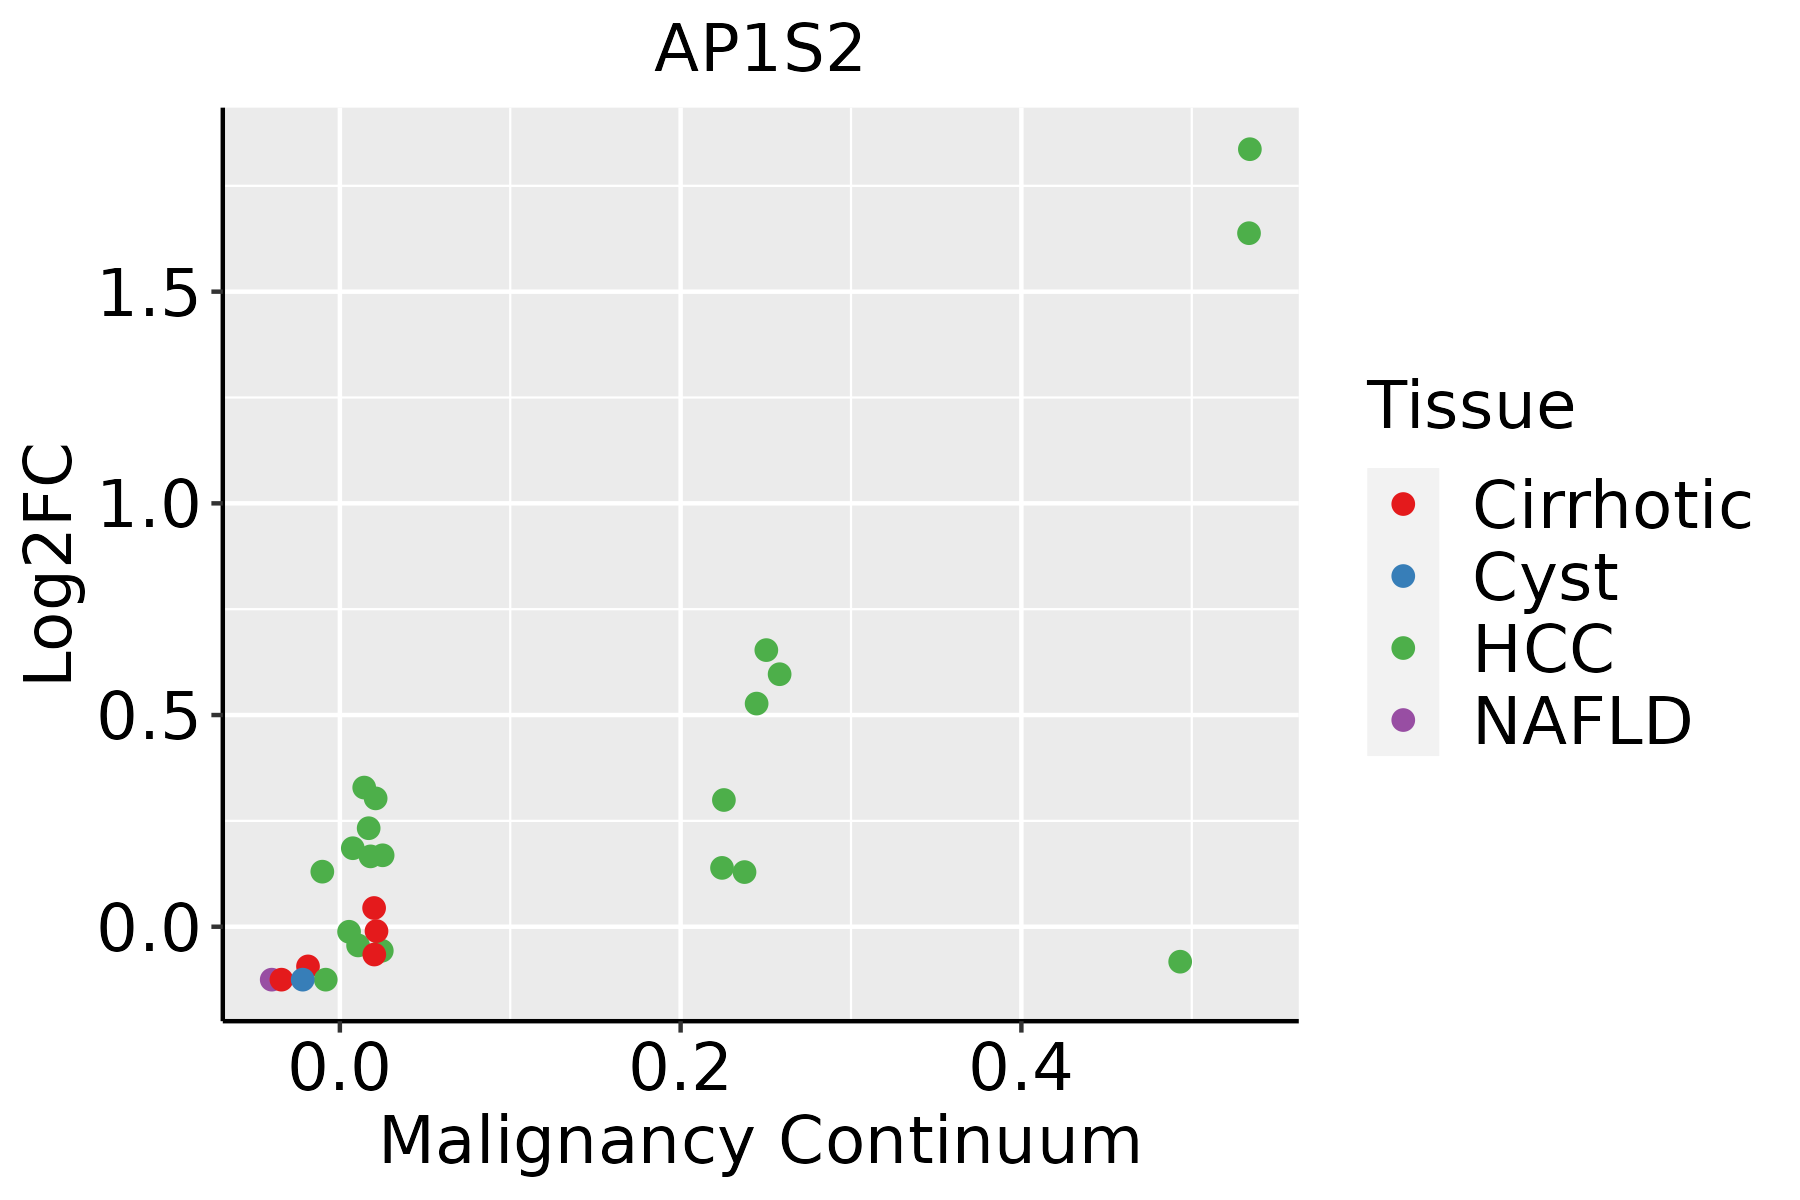 | HCC: Hepatocellular carcinoma |
| NAFLD: Non-alcoholic fatty liver disease | ||
| Thyroid | 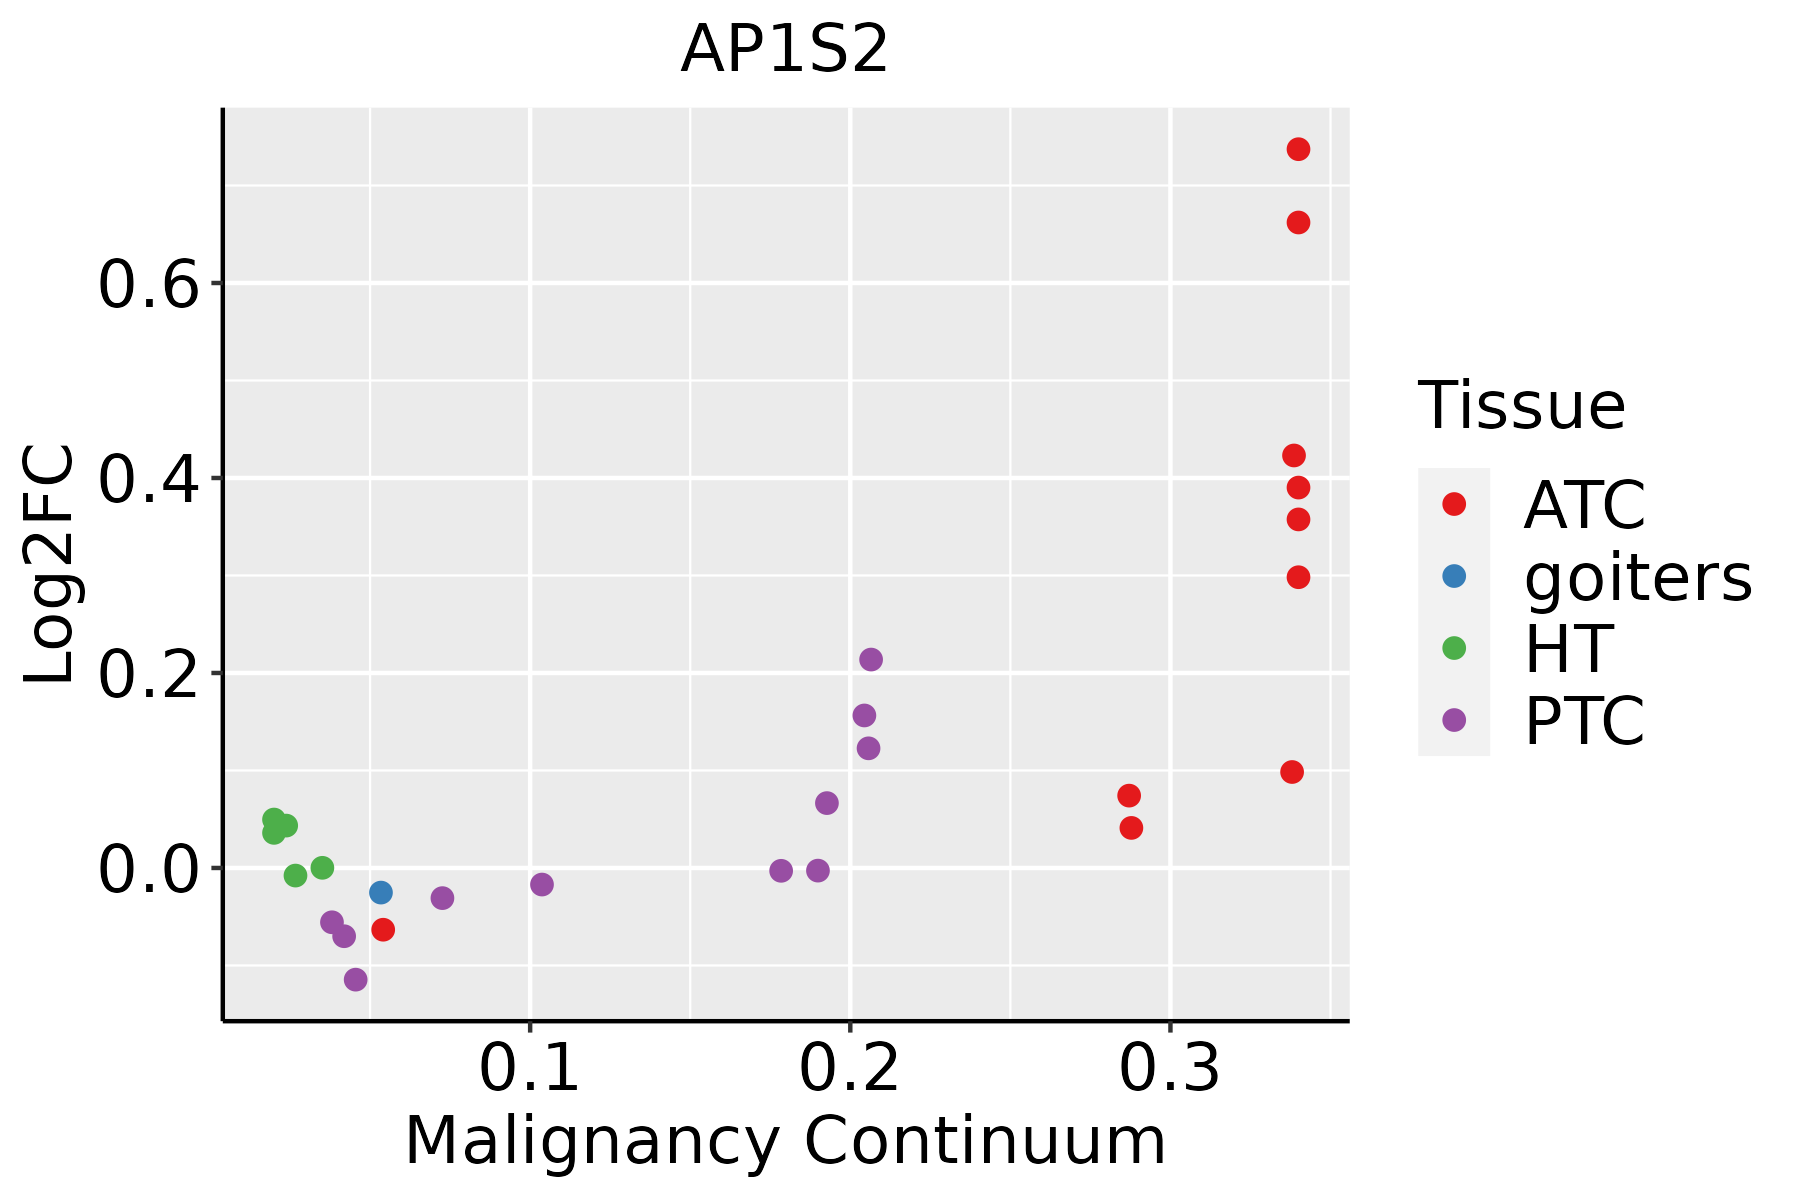 | ATC: Anaplastic thyroid cancer |
| HT: Hashimoto's thyroiditis | ||
| PTC: Papillary thyroid cancer |
| ∗log2FC in expression of this searched gene in stem-like cells from each diseased tissue sample relative to stem-like cells in normal samples in each tissue plotted against the malignancy continuum. Samples are colored based on if they are from different disease stage. |
Top |
Malignant transformation related pathway analysis |
| Find out the enriched GO biological processes and KEGG pathways involved in transition from healthy to precancer to cancer |
| Tissue | Disease Stage | Enriched GO biological Processes |
| Colorectum | AD |  |
| Colorectum | SER |  |
| Colorectum | MSS |  |
| Colorectum | MSI-H |  |
| Colorectum | FAP |  |
| ∗Top 15 enriched GO BP terms are showed in the bar plot of each disease state in each tissue. Each row represents a significant GO biological process which is colored according to the -log10(p.adjust). |
| Page: 1 2 3 4 5 6 7 8 9 |
| GO ID | Tissue | Disease Stage | Description | Gene Ratio | Bg Ratio | pvalue | p.adjust | Count |
| Page: 1 |
| Pathway ID | Tissue | Disease Stage | Description | Gene Ratio | Bg Ratio | pvalue | p.adjust | qvalue | Count |
| hsa0414222 | Esophagus | ESCC | Lysosome | 102/4205 | 132/8465 | 5.11e-11 | 7.13e-10 | 3.65e-10 | 102 |
| hsa05170210 | Esophagus | ESCC | Human immunodeficiency virus 1 infection | 147/4205 | 212/8465 | 3.37e-09 | 3.53e-08 | 1.81e-08 | 147 |
| hsa0414232 | Esophagus | ESCC | Lysosome | 102/4205 | 132/8465 | 5.11e-11 | 7.13e-10 | 3.65e-10 | 102 |
| hsa0517038 | Esophagus | ESCC | Human immunodeficiency virus 1 infection | 147/4205 | 212/8465 | 3.37e-09 | 3.53e-08 | 1.81e-08 | 147 |
| hsa041424 | Liver | Cirrhotic | Lysosome | 68/2530 | 132/8465 | 1.34e-07 | 1.97e-06 | 1.21e-06 | 68 |
| hsa0414211 | Liver | Cirrhotic | Lysosome | 68/2530 | 132/8465 | 1.34e-07 | 1.97e-06 | 1.21e-06 | 68 |
| hsa041422 | Liver | HCC | Lysosome | 100/4020 | 132/8465 | 2.32e-11 | 4.31e-10 | 2.40e-10 | 100 |
| hsa051709 | Liver | HCC | Human immunodeficiency virus 1 infection | 125/4020 | 212/8465 | 4.51e-04 | 1.94e-03 | 1.08e-03 | 125 |
| hsa041423 | Liver | HCC | Lysosome | 100/4020 | 132/8465 | 2.32e-11 | 4.31e-10 | 2.40e-10 | 100 |
| hsa0517012 | Liver | HCC | Human immunodeficiency virus 1 infection | 125/4020 | 212/8465 | 4.51e-04 | 1.94e-03 | 1.08e-03 | 125 |
| Page: 1 |
Top |
Cell-cell communication analysis |
| Identification of potential cell-cell interactions between two cell types and their ligand-receptor pairs for different disease states |
| Ligand | Receptor | LRpair | Pathway | Tissue | Disease Stage |
| Page: 1 |
Top |
Single-cell gene regulatory network inference analysis |
| Find out the significant the regulons (TFs) and the target genes of each regulon across cell types for different disease states |
| TF | Cell Type | Tissue | Disease Stage | Target Gene | RSS | Regulon Activity |
| ∗The dot plots of a searched regulon are shown for all cell subpopulations in each disease state of each tissue based on the regulon specific score inferred using pySCENIC and by calculating the average expression. |
| Page: 1 |
Top |
Somatic mutation of malignant transformation related genes |
| Annotation of somatic variants for genes involved in malignant transformation |
| Hugo Symbol | Variant Class | Variant Classification | dbSNP RS | HGVSc | HGVSp | HGVSp Short | SWISSPROT | BIOTYPE | SIFT | PolyPhen | Tumor Sample Barcode | Tissue | Histology | Sex | Age | Stage | Therapy Types | Drugs | Outcome |
| AP1S2 | SNV | Missense_Mutation | c.148N>C | p.Glu50Gln | p.E50Q | protein_coding | tolerated(0.06) | probably_damaging(0.999) | TCGA-C5-A1BQ-01 | Cervix | cervical & endocervical cancer | Female | >=65 | III/IV | Chemotherapy | cisplatin | CR | ||
| AP1S2 | SNV | Missense_Mutation | c.457N>A | p.Val153Ile | p.V153I | protein_coding | tolerated_low_confidence(0.56) | benign(0) | TCGA-AA-3819-01 | Colorectum | colon adenocarcinoma | Female | <65 | I/II | Unknown | Unknown | SD | ||
| AP1S2 | SNV | Missense_Mutation | c.41N>A | p.Arg14Gln | p.R14Q | protein_coding | deleterious(0.02) | possibly_damaging(0.492) | TCGA-CA-6718-01 | Colorectum | colon adenocarcinoma | Male | <65 | I/II | Unknown | Unknown | PD | ||
| AP1S2 | SNV | Missense_Mutation | c.206C>A | p.Ala69Asp | p.A69D | protein_coding | deleterious(0) | probably_damaging(0.999) | TCGA-A5-A0G1-01 | Endometrium | uterine corpus endometrioid carcinoma | Female | >=65 | I/II | Unknown | Unknown | SD | ||
| AP1S2 | SNV | Missense_Mutation | c.206N>A | p.Ala69Asp | p.A69D | protein_coding | deleterious(0) | probably_damaging(0.999) | TCGA-A5-A0GG-01 | Endometrium | uterine corpus endometrioid carcinoma | Female | >=65 | I/II | Unknown | Unknown | SD | ||
| AP1S2 | SNV | Missense_Mutation | c.282N>A | p.Phe94Leu | p.F94L | protein_coding | deleterious(0) | probably_damaging(0.997) | TCGA-AX-A3FS-01 | Endometrium | uterine corpus endometrioid carcinoma | Female | >=65 | I/II | Unknown | Unknown | SD | ||
| AP1S2 | SNV | Missense_Mutation | novel | c.311N>C | p.Phe104Ser | p.F104S | protein_coding | deleterious(0) | probably_damaging(1) | TCGA-DI-A1BU-01 | Endometrium | uterine corpus endometrioid carcinoma | Female | <65 | I/II | Chemotherapy | paclitaxel | SD | |
| AP1S2 | SNV | Missense_Mutation | c.452G>A | p.Arg151His | p.R151H | protein_coding | tolerated(0.14) | benign(0.001) | TCGA-EO-A22R-01 | Endometrium | uterine corpus endometrioid carcinoma | Female | <65 | I/II | Unknown | Unknown | SD | ||
| AP1S2 | SNV | Missense_Mutation | novel | c.445A>G | p.Thr149Ala | p.T149A | protein_coding | tolerated(0.57) | benign(0.001) | TCGA-EO-A22U-01 | Endometrium | uterine corpus endometrioid carcinoma | Female | >=65 | I/II | Unknown | Unknown | SD | |
| AP1S2 | SNV | Missense_Mutation | novel | c.283G>A | p.Gly95Ser | p.G95S | protein_coding | deleterious(0) | probably_damaging(0.931) | TCGA-EO-A22U-01 | Endometrium | uterine corpus endometrioid carcinoma | Female | >=65 | I/II | Unknown | Unknown | SD |
| Page: 1 2 |
Top |
Related drugs of malignant transformation related genes |
| Identification of chemicals and drugs interact with genes involved in malignant transfromation |
| (DGIdb 4.0) |
| Entrez ID | Symbol | Category | Interaction Types | Drug Claim Name | Drug Name | PMIDs |
| Page: 1 |

Copyright 2023-Present -The University of Texas Health Science Center at Houston |