| Tissue | Expression Dynamics | Abbreviation |
| Breast | 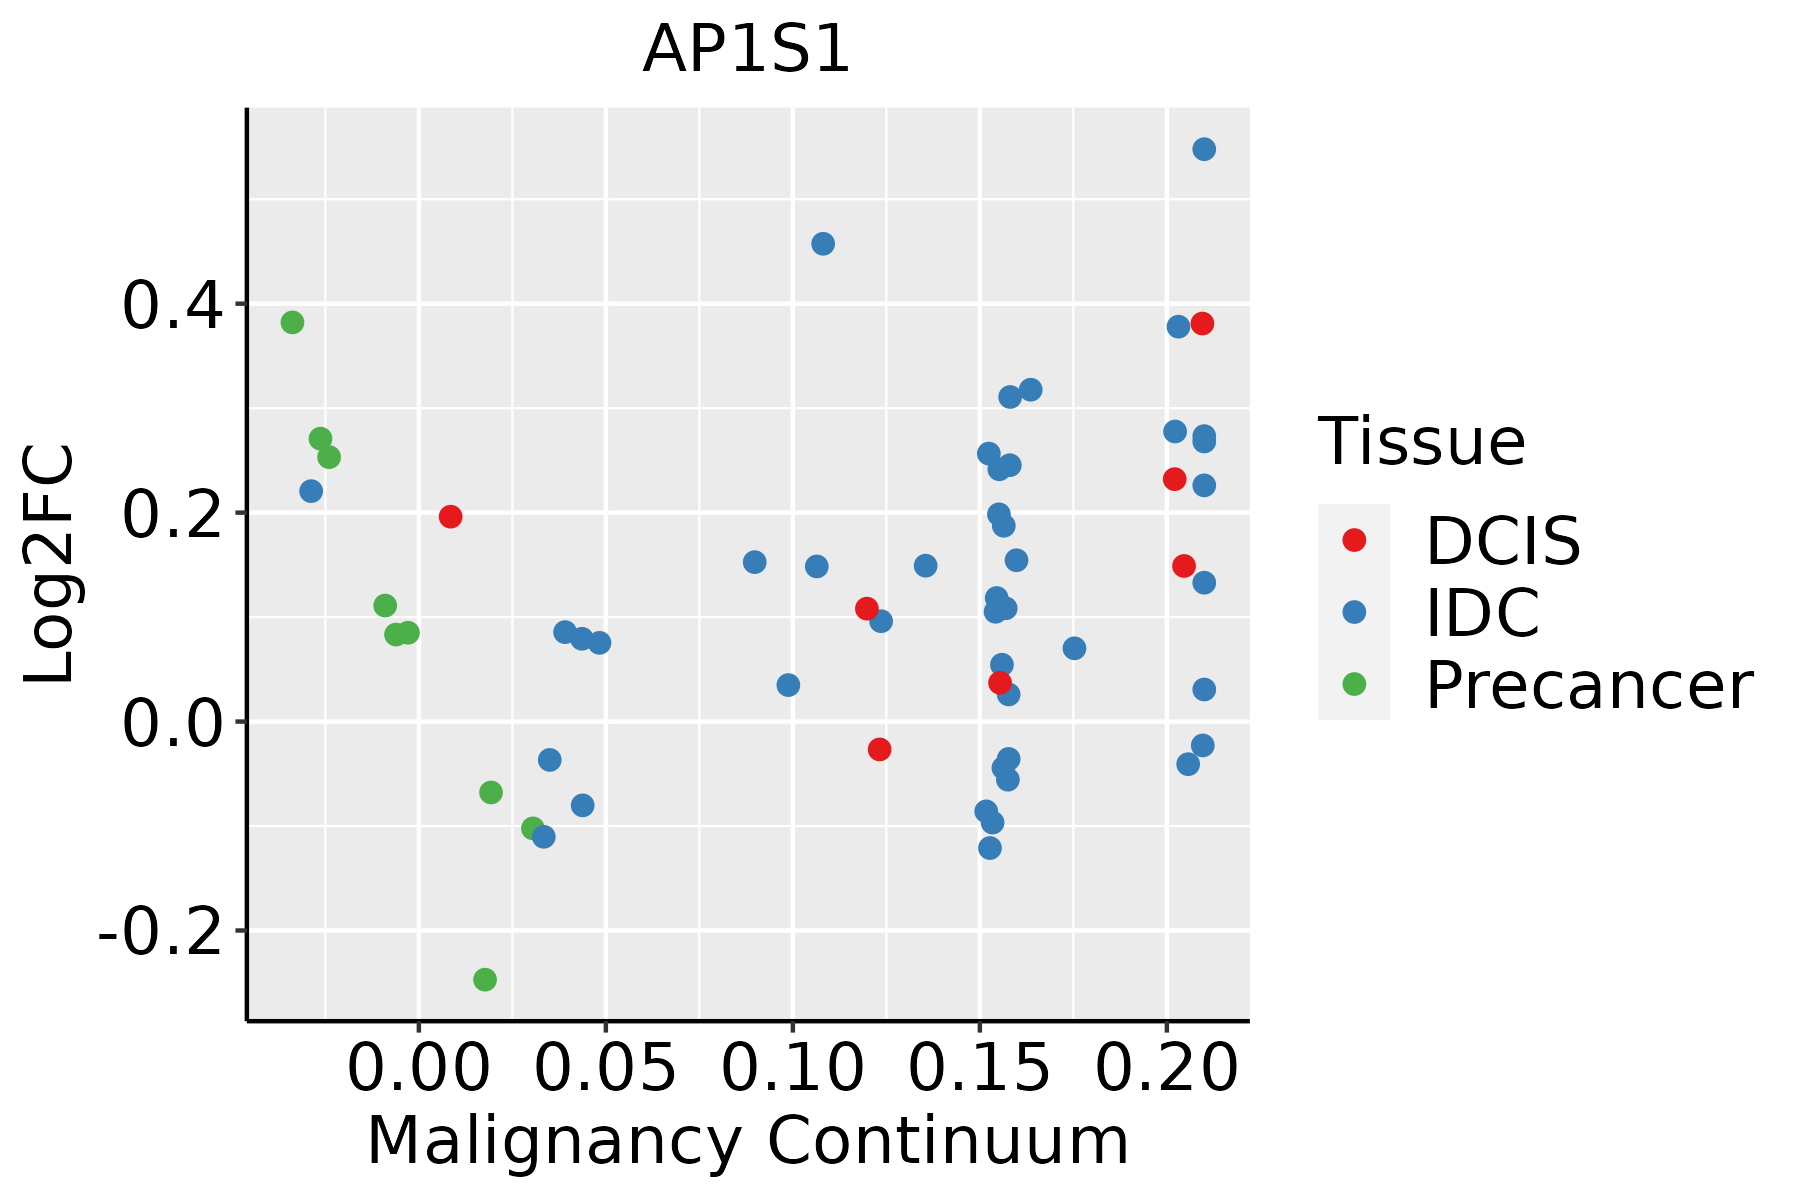 | IDC: Invasive ductal carcinoma |
| DCIS: Ductal carcinoma in situ |
| Precancer(BRCA1-mut): Precancerous lesion from BRCA1 mutation carriers |
| Colorectum (GSE201348) |  | FAP: Familial adenomatous polyposis |
| CRC: Colorectal cancer |
| Colorectum (HTA11) |  | AD: Adenomas |
| SER: Sessile serrated lesions |
| MSI-H: Microsatellite-high colorectal cancer |
| MSS: Microsatellite stable colorectal cancer |
| Esophagus | 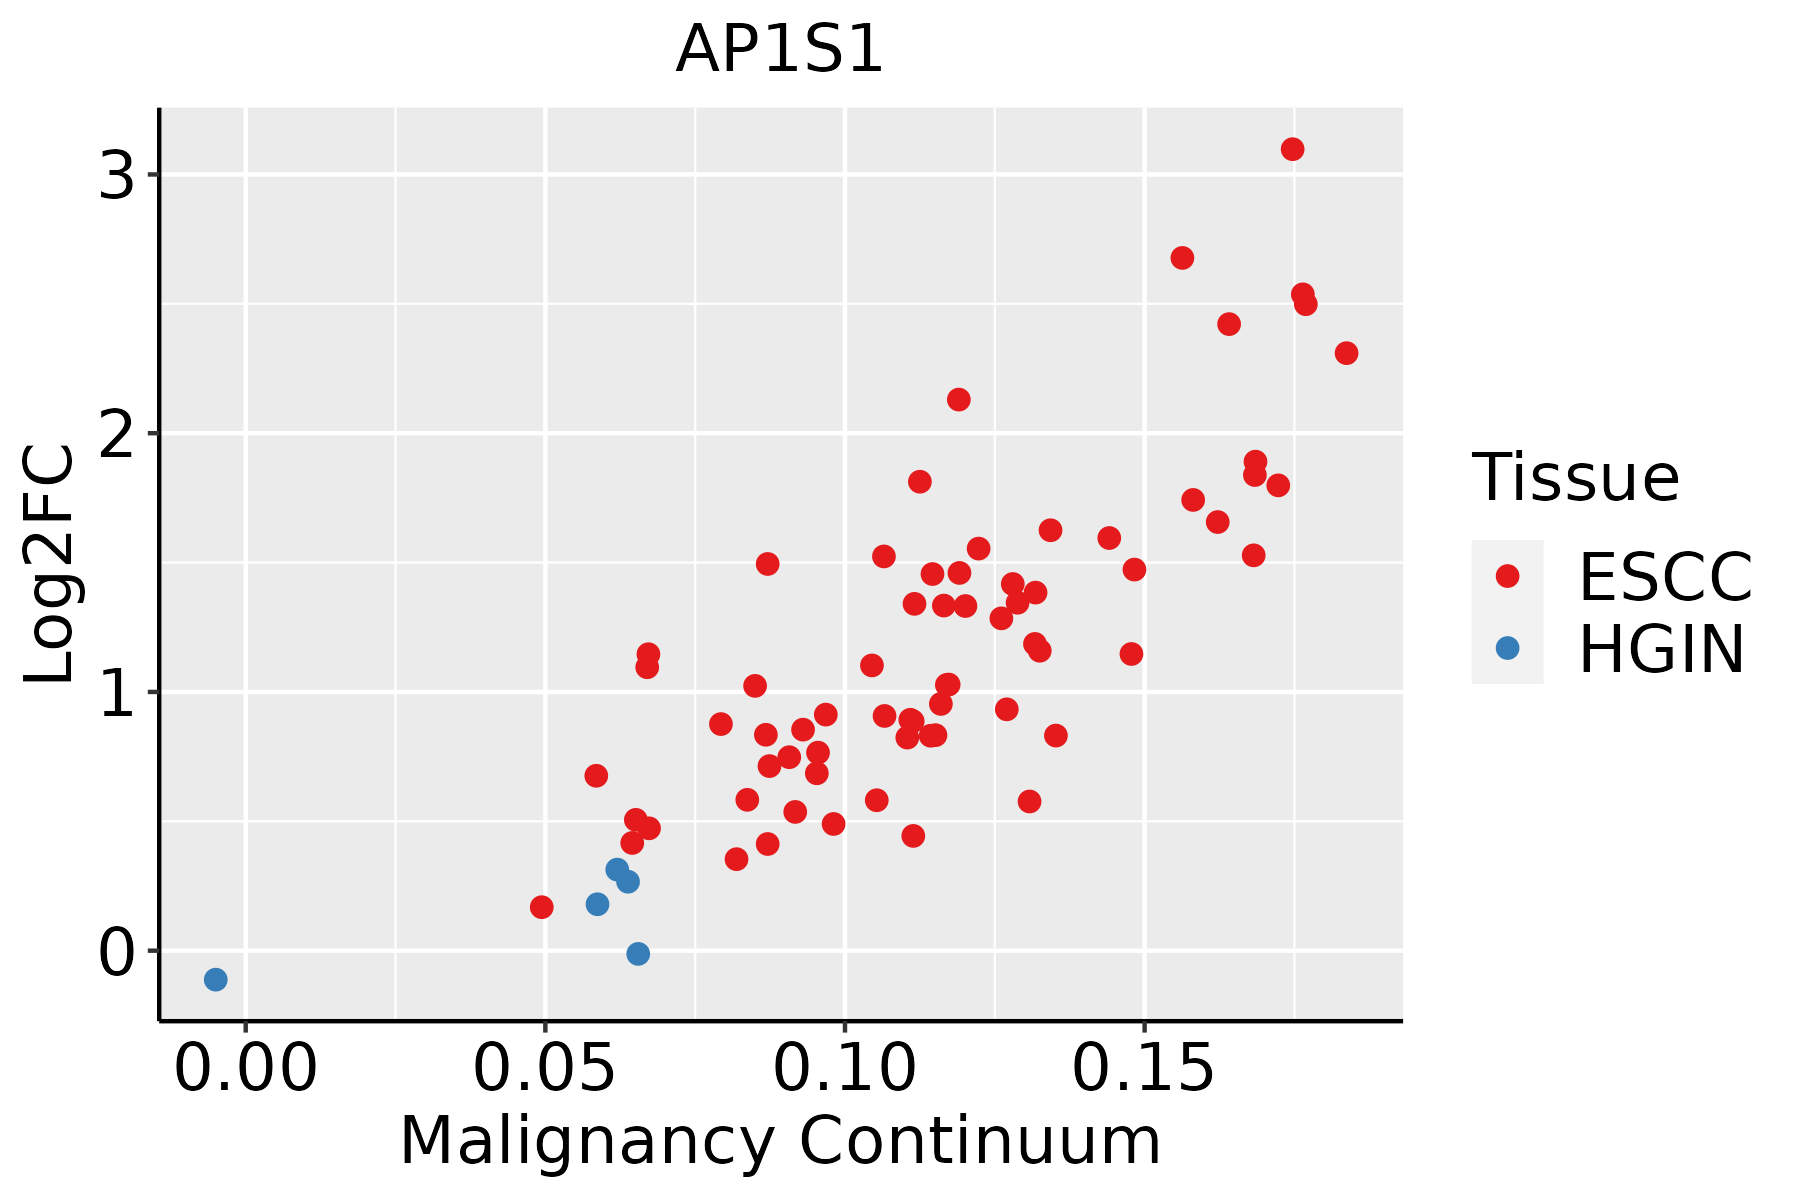 | ESCC: Esophageal squamous cell carcinoma |
| HGIN: High-grade intraepithelial neoplasias |
| LGIN: Low-grade intraepithelial neoplasias |
| Liver | 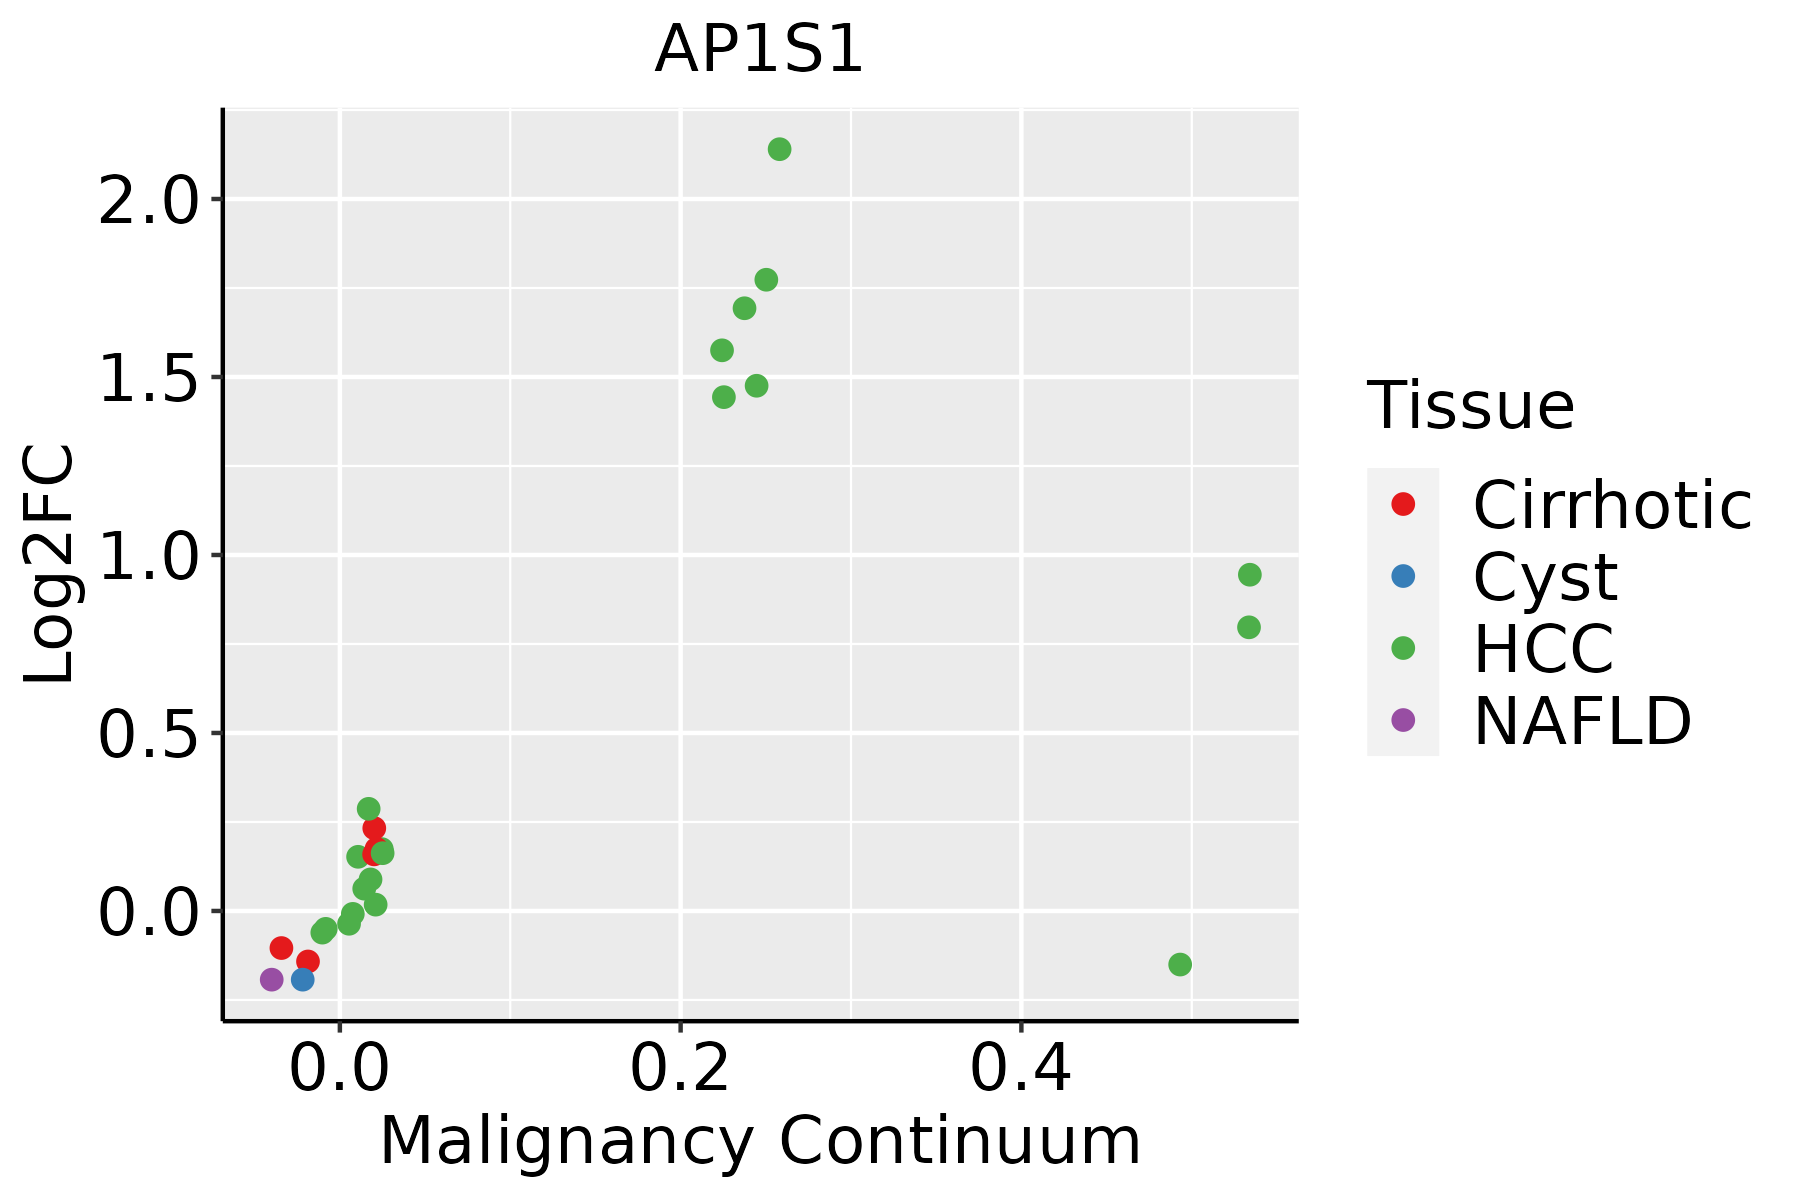 | HCC: Hepatocellular carcinoma |
| NAFLD: Non-alcoholic fatty liver disease |
| Oral Cavity | 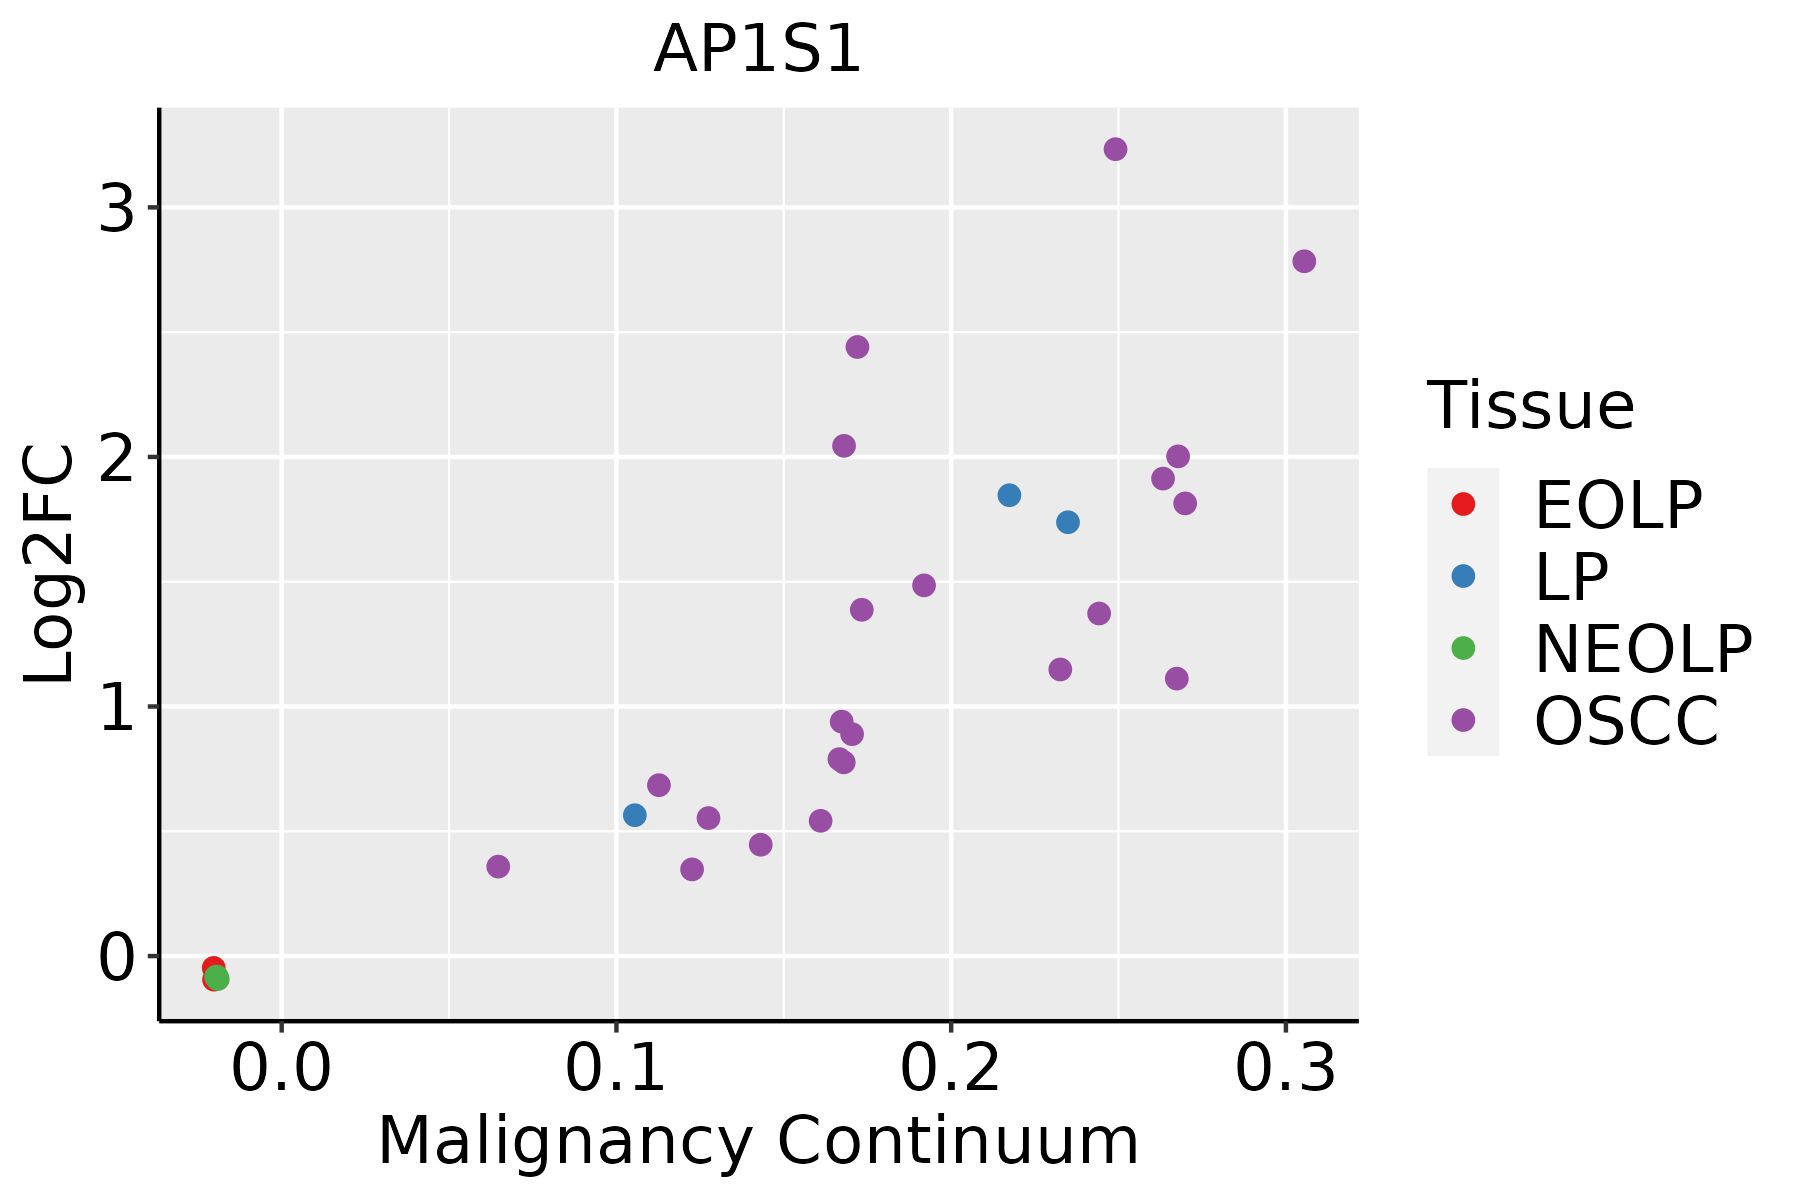 | EOLP: Erosive Oral lichen planus |
| LP: leukoplakia |
| NEOLP: Non-erosive oral lichen planus |
| OSCC: Oral squamous cell carcinoma |
| Prostate | 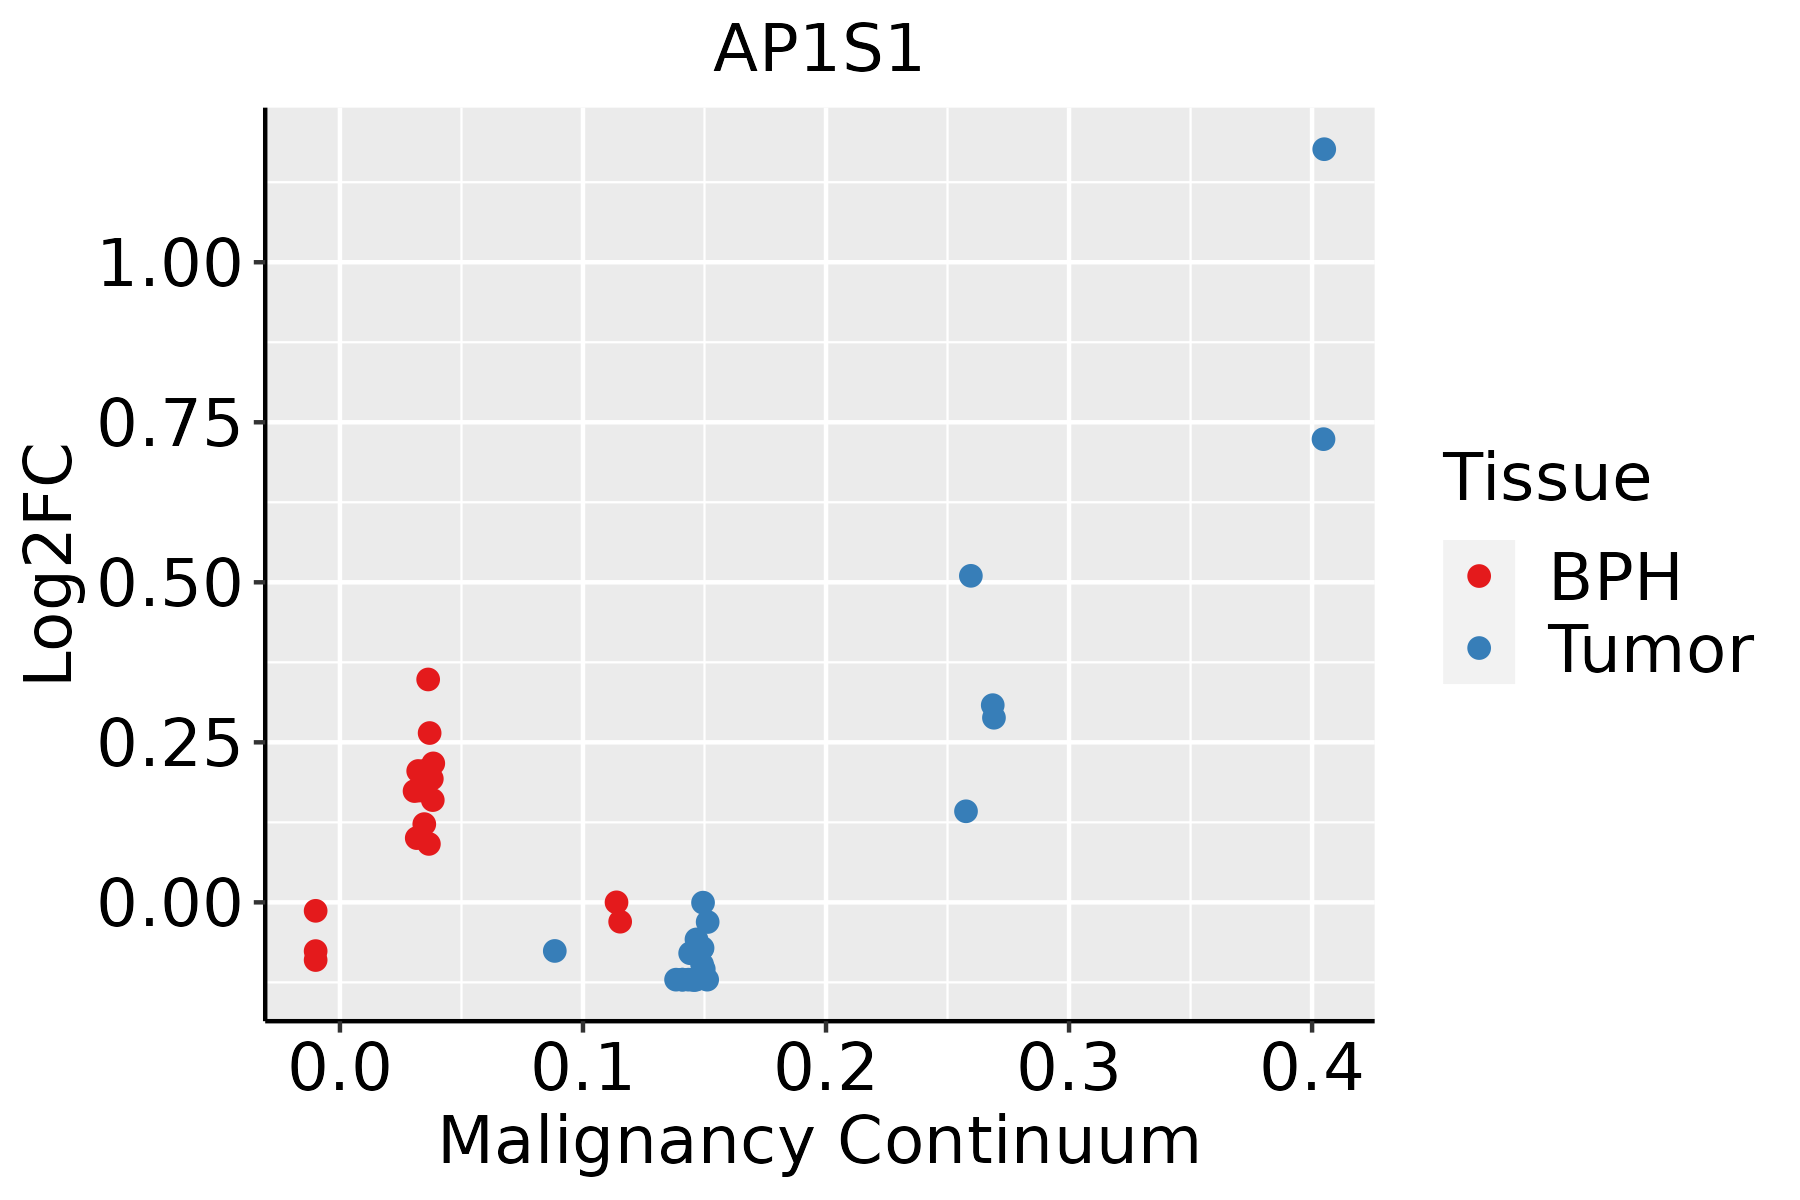 | BPH: Benign Prostatic Hyperplasia |
| Skin | 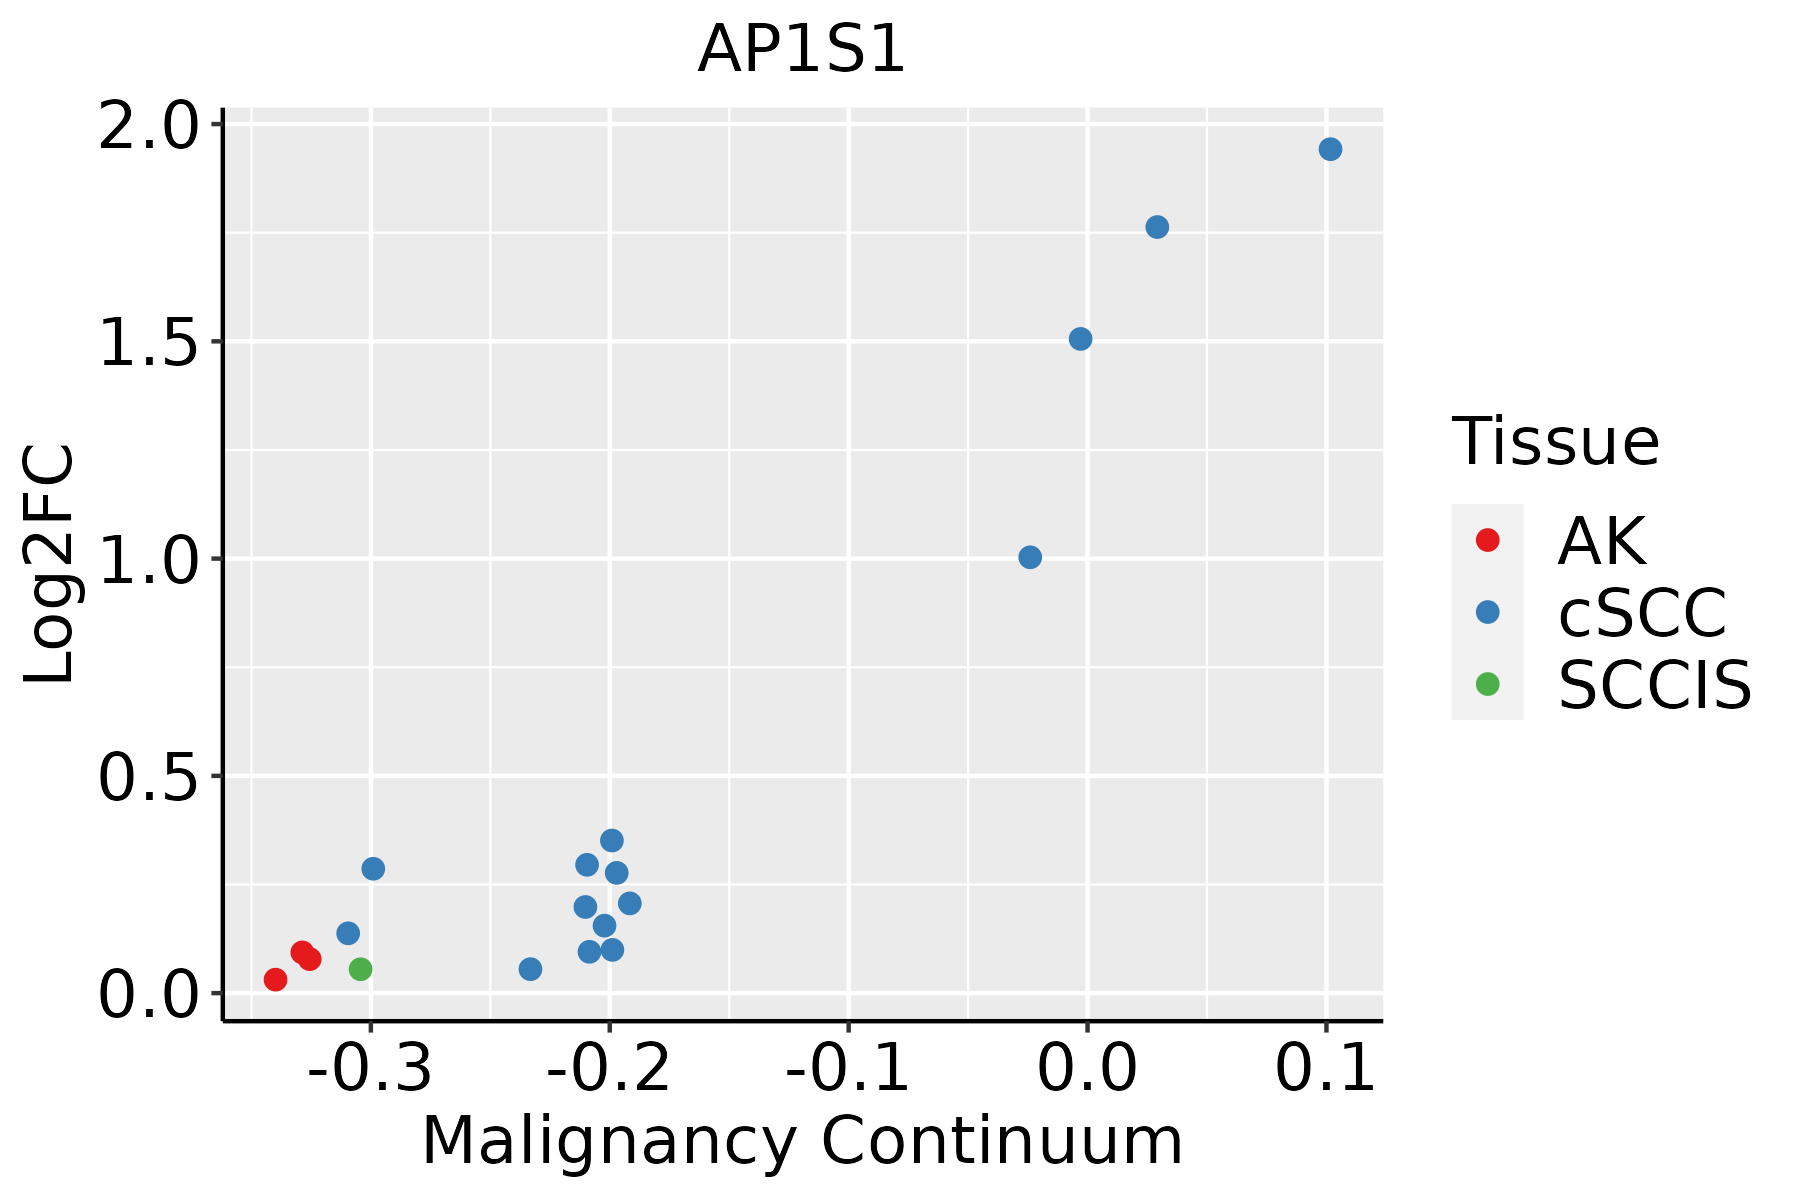 | AK: Actinic keratosis |
| cSCC: Cutaneous squamous cell carcinoma |
| SCCIS:squamous cell carcinoma in situ |
| Thyroid |  | ATC: Anaplastic thyroid cancer |
| HT: Hashimoto's thyroiditis |
| PTC: Papillary thyroid cancer |
| GO ID | Tissue | Disease Stage | Description | Gene Ratio | Bg Ratio | pvalue | p.adjust | Count |
| GO:00068986 | Breast | Precancer | receptor-mediated endocytosis | 27/1080 | 244/18723 | 9.01e-04 | 1.03e-02 | 27 |
| GO:000689813 | Breast | IDC | receptor-mediated endocytosis | 35/1434 | 244/18723 | 2.38e-04 | 3.75e-03 | 35 |
| GO:00096157 | Breast | IDC | response to virus | 47/1434 | 367/18723 | 3.53e-04 | 5.16e-03 | 47 |
| GO:000689823 | Breast | DCIS | receptor-mediated endocytosis | 35/1390 | 244/18723 | 1.31e-04 | 2.25e-03 | 35 |
| GO:000961512 | Breast | DCIS | response to virus | 45/1390 | 367/18723 | 6.16e-04 | 7.82e-03 | 45 |
| GO:0006898 | Colorectum | AD | receptor-mediated endocytosis | 76/3918 | 244/18723 | 1.07e-04 | 1.59e-03 | 76 |
| GO:00068981 | Colorectum | MSS | receptor-mediated endocytosis | 69/3467 | 244/18723 | 1.18e-04 | 1.82e-03 | 69 |
| GO:00068983 | Colorectum | CRC | receptor-mediated endocytosis | 50/2078 | 244/18723 | 1.27e-05 | 4.08e-04 | 50 |
| GO:000961517 | Esophagus | HGIN | response to virus | 69/2587 | 367/18723 | 4.39e-03 | 3.86e-02 | 69 |
| GO:000961518 | Esophagus | ESCC | response to virus | 238/8552 | 367/18723 | 6.65e-14 | 3.32e-12 | 238 |
| GO:000689818 | Esophagus | ESCC | receptor-mediated endocytosis | 142/8552 | 244/18723 | 5.22e-05 | 4.05e-04 | 142 |
| GO:000689811 | Liver | Cirrhotic | receptor-mediated endocytosis | 91/4634 | 244/18723 | 8.13e-06 | 1.22e-04 | 91 |
| GO:00096155 | Liver | Cirrhotic | response to virus | 126/4634 | 367/18723 | 2.10e-05 | 2.77e-04 | 126 |
| GO:000961511 | Liver | HCC | response to virus | 210/7958 | 367/18723 | 7.32e-09 | 1.86e-07 | 210 |
| GO:000689821 | Liver | HCC | receptor-mediated endocytosis | 134/7958 | 244/18723 | 5.73e-05 | 5.31e-04 | 134 |
| GO:000961515 | Oral cavity | OSCC | response to virus | 215/7305 | 367/18723 | 1.63e-14 | 9.41e-13 | 215 |
| GO:000689810 | Oral cavity | OSCC | receptor-mediated endocytosis | 125/7305 | 244/18723 | 6.56e-05 | 5.32e-04 | 125 |
| GO:000961516 | Oral cavity | LP | response to virus | 143/4623 | 367/18723 | 7.42e-10 | 3.52e-08 | 143 |
| GO:000689817 | Oral cavity | LP | receptor-mediated endocytosis | 87/4623 | 244/18723 | 7.83e-05 | 1.02e-03 | 87 |
| GO:000961510 | Prostate | BPH | response to virus | 99/3107 | 367/18723 | 2.82e-07 | 6.07e-06 | 99 |
| Pathway ID | Tissue | Disease Stage | Description | Gene Ratio | Bg Ratio | pvalue | p.adjust | qvalue | Count |
| hsa0517014 | Breast | IDC | Human immunodeficiency virus 1 infection | 33/867 | 212/8465 | 9.28e-03 | 4.37e-02 | 3.27e-02 | 33 |
| hsa0517015 | Breast | IDC | Human immunodeficiency virus 1 infection | 33/867 | 212/8465 | 9.28e-03 | 4.37e-02 | 3.27e-02 | 33 |
| hsa0517024 | Breast | DCIS | Human immunodeficiency virus 1 infection | 33/846 | 212/8465 | 6.49e-03 | 3.22e-02 | 2.37e-02 | 33 |
| hsa0517034 | Breast | DCIS | Human immunodeficiency virus 1 infection | 33/846 | 212/8465 | 6.49e-03 | 3.22e-02 | 2.37e-02 | 33 |
| hsa05170 | Colorectum | AD | Human immunodeficiency virus 1 infection | 72/2092 | 212/8465 | 1.40e-03 | 8.46e-03 | 5.39e-03 | 72 |
| hsa051701 | Colorectum | AD | Human immunodeficiency virus 1 infection | 72/2092 | 212/8465 | 1.40e-03 | 8.46e-03 | 5.39e-03 | 72 |
| hsa051702 | Colorectum | SER | Human immunodeficiency virus 1 infection | 58/1580 | 212/8465 | 1.08e-03 | 8.56e-03 | 6.21e-03 | 58 |
| hsa04142 | Colorectum | SER | Lysosome | 38/1580 | 132/8465 | 2.87e-03 | 2.03e-02 | 1.47e-02 | 38 |
| hsa051703 | Colorectum | SER | Human immunodeficiency virus 1 infection | 58/1580 | 212/8465 | 1.08e-03 | 8.56e-03 | 6.21e-03 | 58 |
| hsa041421 | Colorectum | SER | Lysosome | 38/1580 | 132/8465 | 2.87e-03 | 2.03e-02 | 1.47e-02 | 38 |
| hsa051704 | Colorectum | MSS | Human immunodeficiency virus 1 infection | 69/1875 | 212/8465 | 2.66e-04 | 1.98e-03 | 1.21e-03 | 69 |
| hsa051705 | Colorectum | MSS | Human immunodeficiency virus 1 infection | 69/1875 | 212/8465 | 2.66e-04 | 1.98e-03 | 1.21e-03 | 69 |
| hsa0517029 | Esophagus | HGIN | Human immunodeficiency virus 1 infection | 51/1383 | 212/8465 | 2.16e-03 | 1.90e-02 | 1.51e-02 | 51 |
| hsa041426 | Esophagus | HGIN | Lysosome | 33/1383 | 132/8465 | 6.65e-03 | 4.37e-02 | 3.47e-02 | 33 |
| hsa05170112 | Esophagus | HGIN | Human immunodeficiency virus 1 infection | 51/1383 | 212/8465 | 2.16e-03 | 1.90e-02 | 1.51e-02 | 51 |
| hsa0414213 | Esophagus | HGIN | Lysosome | 33/1383 | 132/8465 | 6.65e-03 | 4.37e-02 | 3.47e-02 | 33 |
| hsa0414222 | Esophagus | ESCC | Lysosome | 102/4205 | 132/8465 | 5.11e-11 | 7.13e-10 | 3.65e-10 | 102 |
| hsa05170210 | Esophagus | ESCC | Human immunodeficiency virus 1 infection | 147/4205 | 212/8465 | 3.37e-09 | 3.53e-08 | 1.81e-08 | 147 |
| hsa0414232 | Esophagus | ESCC | Lysosome | 102/4205 | 132/8465 | 5.11e-11 | 7.13e-10 | 3.65e-10 | 102 |
| hsa0517038 | Esophagus | ESCC | Human immunodeficiency virus 1 infection | 147/4205 | 212/8465 | 3.37e-09 | 3.53e-08 | 1.81e-08 | 147 |
| Hugo Symbol | Variant Class | Variant Classification | dbSNP RS | HGVSc | HGVSp | HGVSp Short | SWISSPROT | BIOTYPE | SIFT | PolyPhen | Tumor Sample Barcode | Tissue | Histology | Sex | Age | Stage | Therapy Types | Drugs | Outcome |
| AP1S1 | insertion | Nonsense_Mutation | novel | c.159_160insCTTGCATAACTAGTAGAGCCAGGATTTGAACCCAGCT | p.Asp54LeufsTer3 | p.D54Lfs*3 | P61966 | protein_coding | | | TCGA-AR-A0TY-01 | Breast | breast invasive carcinoma | Female | <65 | I/II | Unspecific | Paclitaxel | PD |
| AP1S1 | insertion | In_Frame_Ins | novel | c.253_254insCCTTCTCCTCGGAGCAGGTAAATTACTTGGCTCAGGTTTTTGCTG | p.His85delinsProPheSerSerGluGlnValAsnTyrLeuAlaGlnValPheAlaAsp | p.H85delinsPFSSEQVNYLAQVFAD | P61966 | protein_coding | | | TCGA-B6-A0I5-01 | Breast | breast invasive carcinoma | Female | <65 | I/II | Unknown | Unknown | SD |
| AP1S1 | SNV | Missense_Mutation | novel | c.158G>T | p.Arg53Met | p.R53M | P61966 | protein_coding | deleterious(0.01) | benign(0.321) | TCGA-AA-3947-01 | Colorectum | colon adenocarcinoma | Female | <65 | I/II | Unknown | Unknown | SD |
| AP1S1 | SNV | Missense_Mutation | rs754050754 | c.83N>A | p.Arg28Gln | p.R28Q | P61966 | protein_coding | deleterious(0) | benign(0.066) | TCGA-AZ-4315-01 | Colorectum | colon adenocarcinoma | Male | <65 | I/II | Unknown | Unknown | SD |
| AP1S1 | SNV | Missense_Mutation | novel | c.407N>G | p.Glu136Gly | p.E136G | P61966 | protein_coding | tolerated(0.26) | benign(0) | TCGA-CM-5349-01 | Colorectum | colon adenocarcinoma | Female | >=65 | I/II | Unknown | Unknown | SD |
| AP1S1 | SNV | Missense_Mutation | novel | c.361G>A | p.Gly121Arg | p.G121R | P61966 | protein_coding | deleterious(0.01) | probably_damaging(0.998) | TCGA-F4-6570-01 | Colorectum | colon adenocarcinoma | Female | >=65 | I/II | Unknown | Unknown | SD |
| AP1S1 | SNV | Missense_Mutation | novel | c.350T>G | p.Phe117Cys | p.F117C | P61966 | protein_coding | deleterious(0) | probably_damaging(0.99) | TCGA-A5-A0G2-01 | Endometrium | uterine corpus endometrioid carcinoma | Female | <65 | III/IV | Unknown | Unknown | SD |
| AP1S1 | SNV | Missense_Mutation | rs760826610 | c.71C>T | p.Ser24Leu | p.S24L | P61966 | protein_coding | tolerated(0.1) | benign(0.013) | TCGA-A5-A2K5-01 | Endometrium | uterine corpus endometrioid carcinoma | Female | >=65 | I/II | Unknown | Unknown | SD |
| AP1S1 | SNV | Missense_Mutation | | c.28C>T | p.Arg10Trp | p.R10W | P61966 | protein_coding | deleterious(0) | probably_damaging(0.998) | TCGA-AP-A051-01 | Endometrium | uterine corpus endometrioid carcinoma | Female | >=65 | I/II | Unknown | Unknown | SD |
| AP1S1 | SNV | Missense_Mutation | novel | c.440N>T | p.Ser147Leu | p.S147L | P61966 | protein_coding | tolerated(0.42) | benign(0) | TCGA-AP-A1E0-01 | Endometrium | uterine corpus endometrioid carcinoma | Female | <65 | III/IV | Chemotherapy | paclitaxel | SD |


