
|
|||||
|
 | |
| |
| |
| |
| |
| |
|
Gene: AP1M2 |
Gene summary for AP1M2 |
| Gene information | Species | Human | Gene symbol | AP1M2 | Gene ID | 10053 |
| Gene name | adaptor related protein complex 1 subunit mu 2 | |
| Gene Alias | AP1-mu2 | |
| Cytomap | 19p13.2 | |
| Gene Type | protein-coding | GO ID | GO:0006605 | UniProtAcc | Q53GI5 |
Top |
Malignant transformation analysis |
| Identification of the aberrant gene expression in precancerous and cancerous lesions by comparing the gene expression of stem-like cells in diseased tissues with normal stem cells |
| Entrez ID | Symbol | Replicates | Species | Organ | Tissue | Adj P-value | Log2FC | Malignancy |
| 10053 | AP1M2 | HTA11_3410_2000001011 | Human | Colorectum | AD | 1.25e-14 | 4.89e-01 | 0.0155 |
| 10053 | AP1M2 | HTA11_2487_2000001011 | Human | Colorectum | SER | 1.27e-15 | 7.36e-01 | -0.1808 |
| 10053 | AP1M2 | HTA11_1938_2000001011 | Human | Colorectum | AD | 1.54e-15 | 7.96e-01 | -0.0811 |
| 10053 | AP1M2 | HTA11_78_2000001011 | Human | Colorectum | AD | 3.40e-08 | 5.48e-01 | -0.1088 |
| 10053 | AP1M2 | HTA11_347_2000001011 | Human | Colorectum | AD | 2.45e-22 | 7.40e-01 | -0.1954 |
| 10053 | AP1M2 | HTA11_411_2000001011 | Human | Colorectum | SER | 2.10e-09 | 1.15e+00 | -0.2602 |
| 10053 | AP1M2 | HTA11_2112_2000001011 | Human | Colorectum | SER | 4.33e-02 | 6.21e-01 | -0.2196 |
| 10053 | AP1M2 | HTA11_3361_2000001011 | Human | Colorectum | AD | 1.44e-07 | 6.83e-01 | -0.1207 |
| 10053 | AP1M2 | HTA11_83_2000001011 | Human | Colorectum | SER | 3.96e-10 | 6.19e-01 | -0.1526 |
| 10053 | AP1M2 | HTA11_696_2000001011 | Human | Colorectum | AD | 1.94e-22 | 7.33e-01 | -0.1464 |
| 10053 | AP1M2 | HTA11_866_2000001011 | Human | Colorectum | AD | 2.66e-06 | 4.31e-01 | -0.1001 |
| 10053 | AP1M2 | HTA11_1391_2000001011 | Human | Colorectum | AD | 1.55e-22 | 9.66e-01 | -0.059 |
| 10053 | AP1M2 | HTA11_5212_2000001011 | Human | Colorectum | AD | 3.79e-03 | 5.19e-01 | -0.2061 |
| 10053 | AP1M2 | HTA11_5216_2000001011 | Human | Colorectum | SER | 4.79e-06 | 8.37e-01 | -0.1462 |
| 10053 | AP1M2 | HTA11_546_2000001011 | Human | Colorectum | AD | 5.19e-09 | 6.92e-01 | -0.0842 |
| 10053 | AP1M2 | HTA11_7862_2000001011 | Human | Colorectum | AD | 7.71e-03 | 3.59e-01 | -0.0179 |
| 10053 | AP1M2 | HTA11_866_3004761011 | Human | Colorectum | AD | 1.45e-15 | 5.67e-01 | 0.096 |
| 10053 | AP1M2 | HTA11_4255_2000001011 | Human | Colorectum | SER | 9.05e-03 | 6.39e-01 | 0.0446 |
| 10053 | AP1M2 | HTA11_8622_2000001021 | Human | Colorectum | SER | 1.23e-07 | 7.66e-01 | 0.0528 |
| 10053 | AP1M2 | HTA11_7663_2000001011 | Human | Colorectum | SER | 3.46e-03 | 6.01e-01 | 0.0131 |
| Page: 1 2 3 4 5 6 7 |
| Tissue | Expression Dynamics | Abbreviation |
| Colorectum (GSE201348) |  | FAP: Familial adenomatous polyposis |
| CRC: Colorectal cancer | ||
| Colorectum (HTA11) |  | AD: Adenomas |
| SER: Sessile serrated lesions | ||
| MSI-H: Microsatellite-high colorectal cancer | ||
| MSS: Microsatellite stable colorectal cancer | ||
| Esophagus | 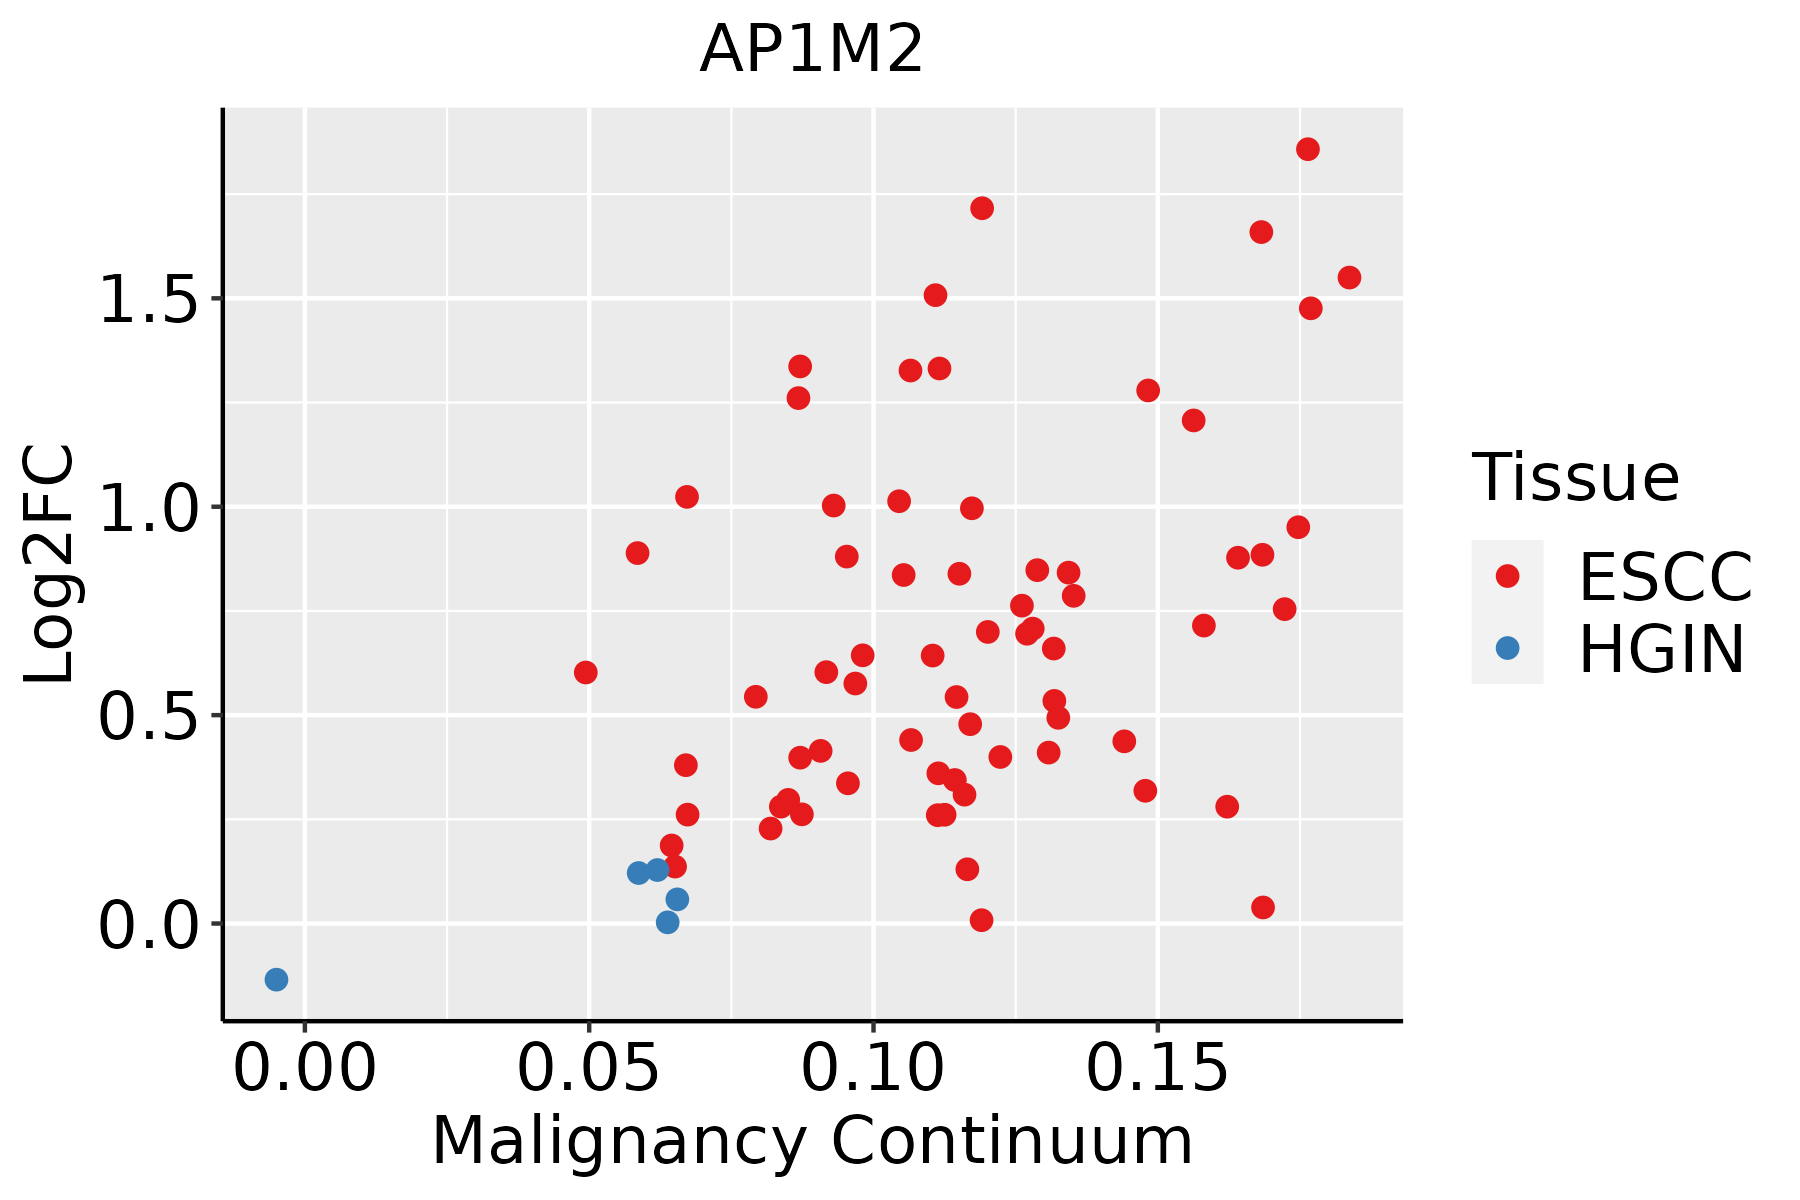 | ESCC: Esophageal squamous cell carcinoma |
| HGIN: High-grade intraepithelial neoplasias | ||
| LGIN: Low-grade intraepithelial neoplasias | ||
| Liver |  | HCC: Hepatocellular carcinoma |
| NAFLD: Non-alcoholic fatty liver disease | ||
| Oral Cavity | 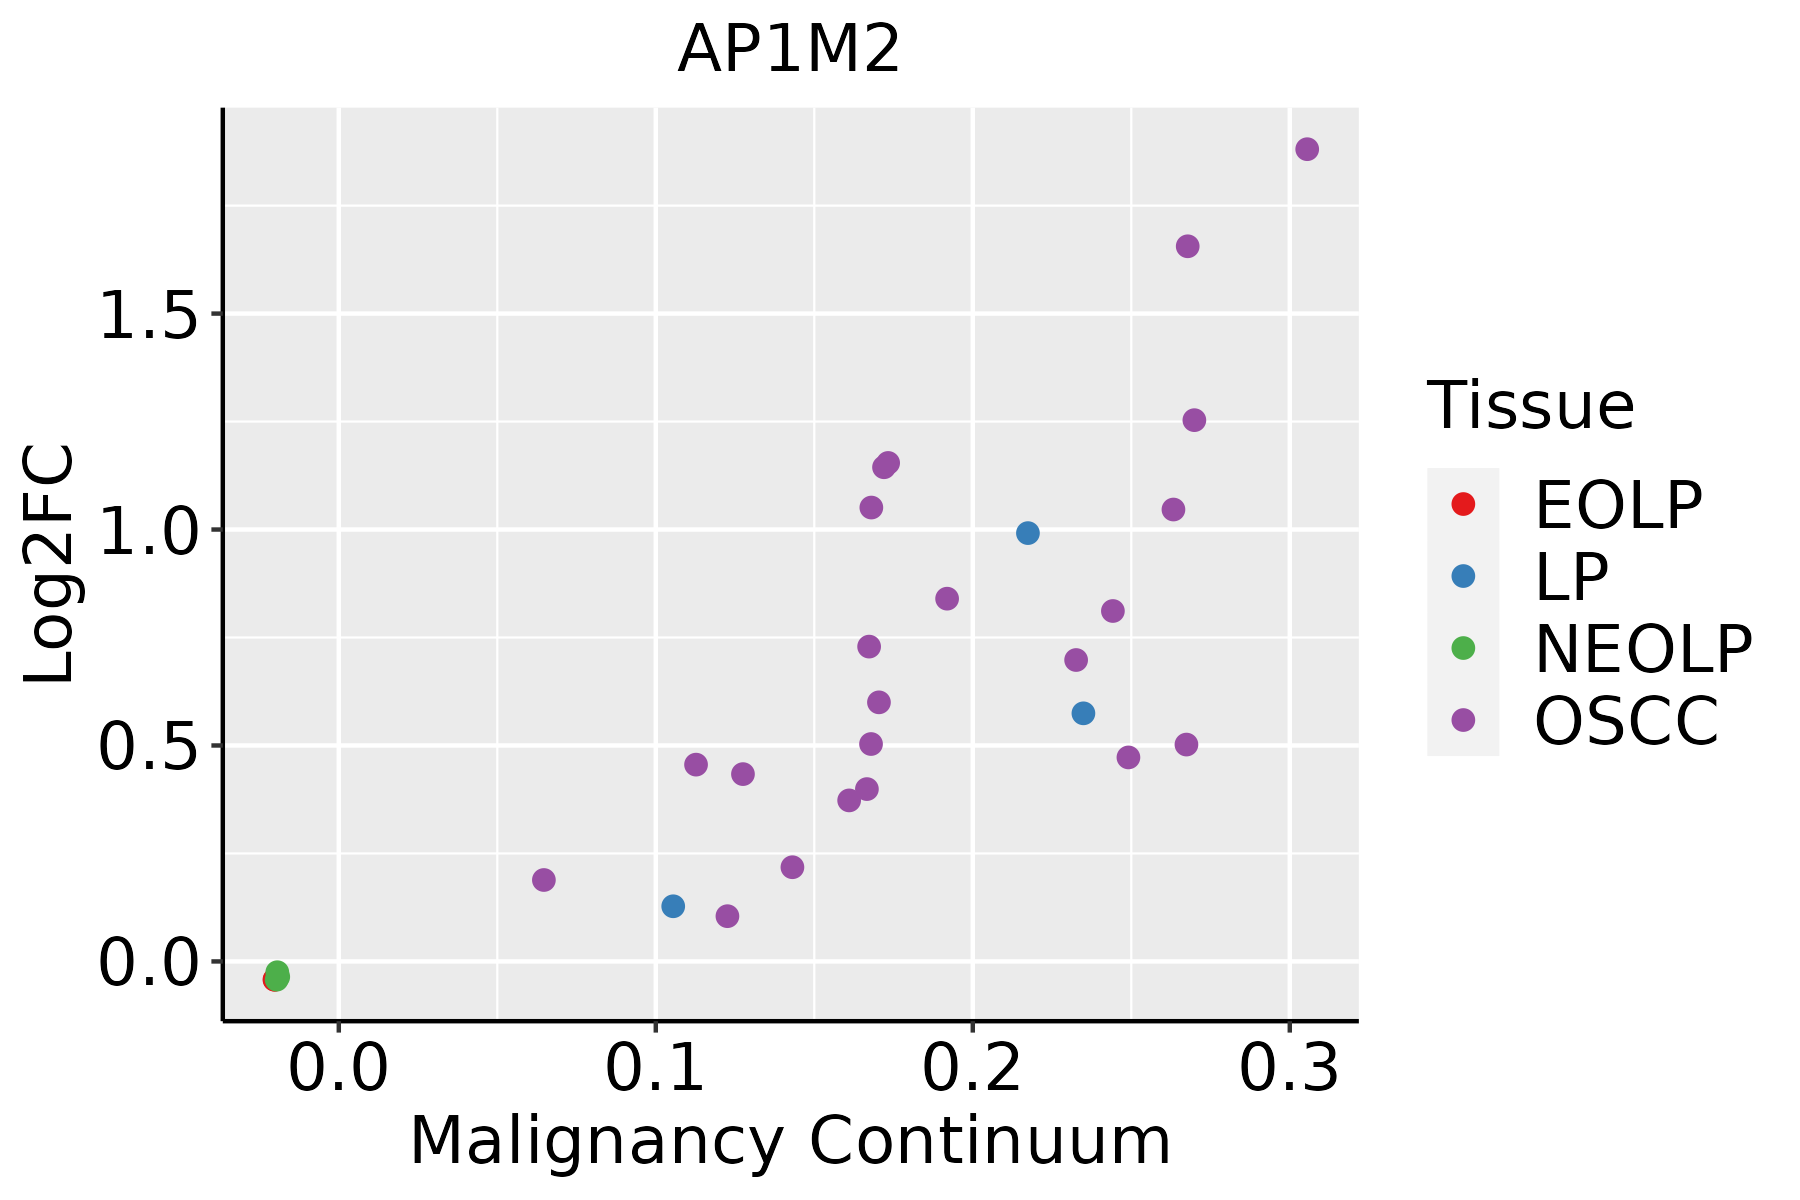 | EOLP: Erosive Oral lichen planus |
| LP: leukoplakia | ||
| NEOLP: Non-erosive oral lichen planus | ||
| OSCC: Oral squamous cell carcinoma | ||
| Prostate | 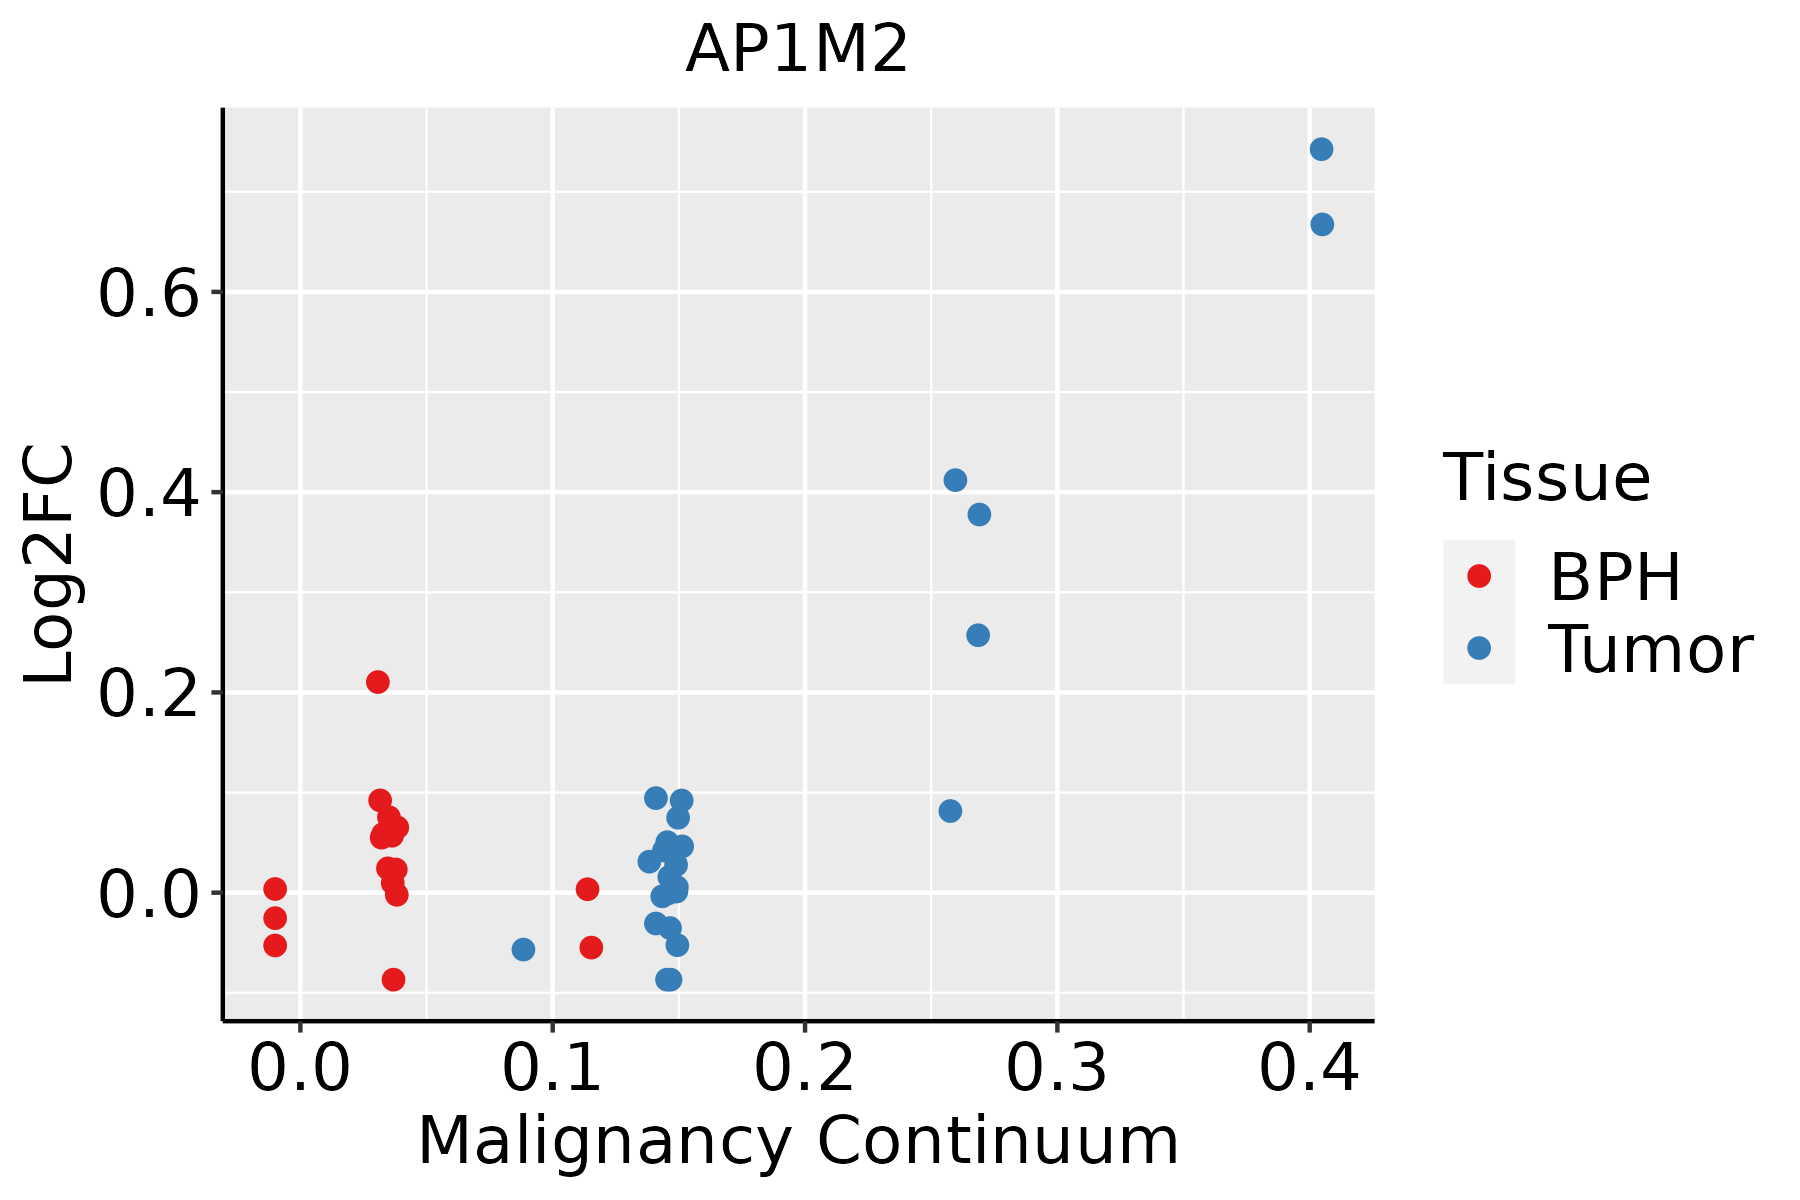 | BPH: Benign Prostatic Hyperplasia |
| Skin | 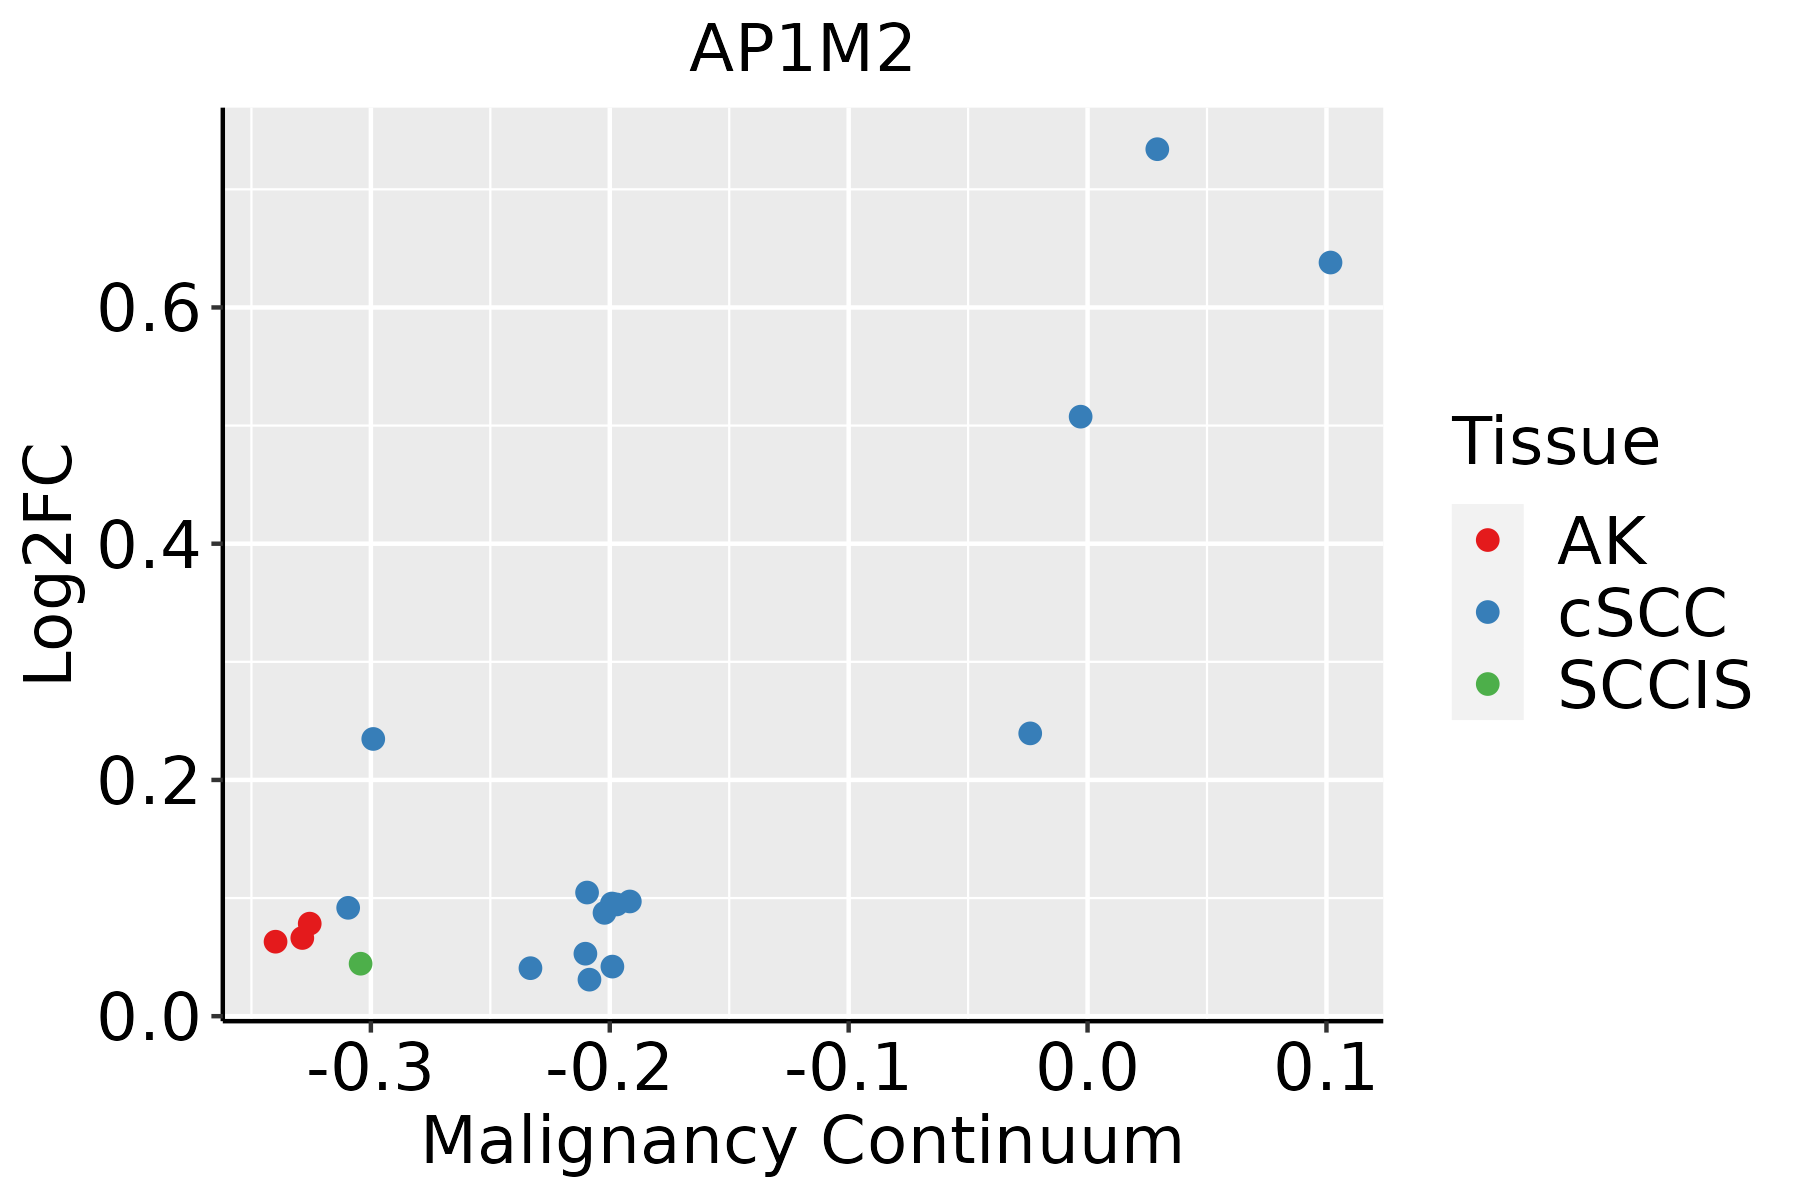 | AK: Actinic keratosis |
| cSCC: Cutaneous squamous cell carcinoma | ||
| SCCIS:squamous cell carcinoma in situ | ||
| Thyroid | 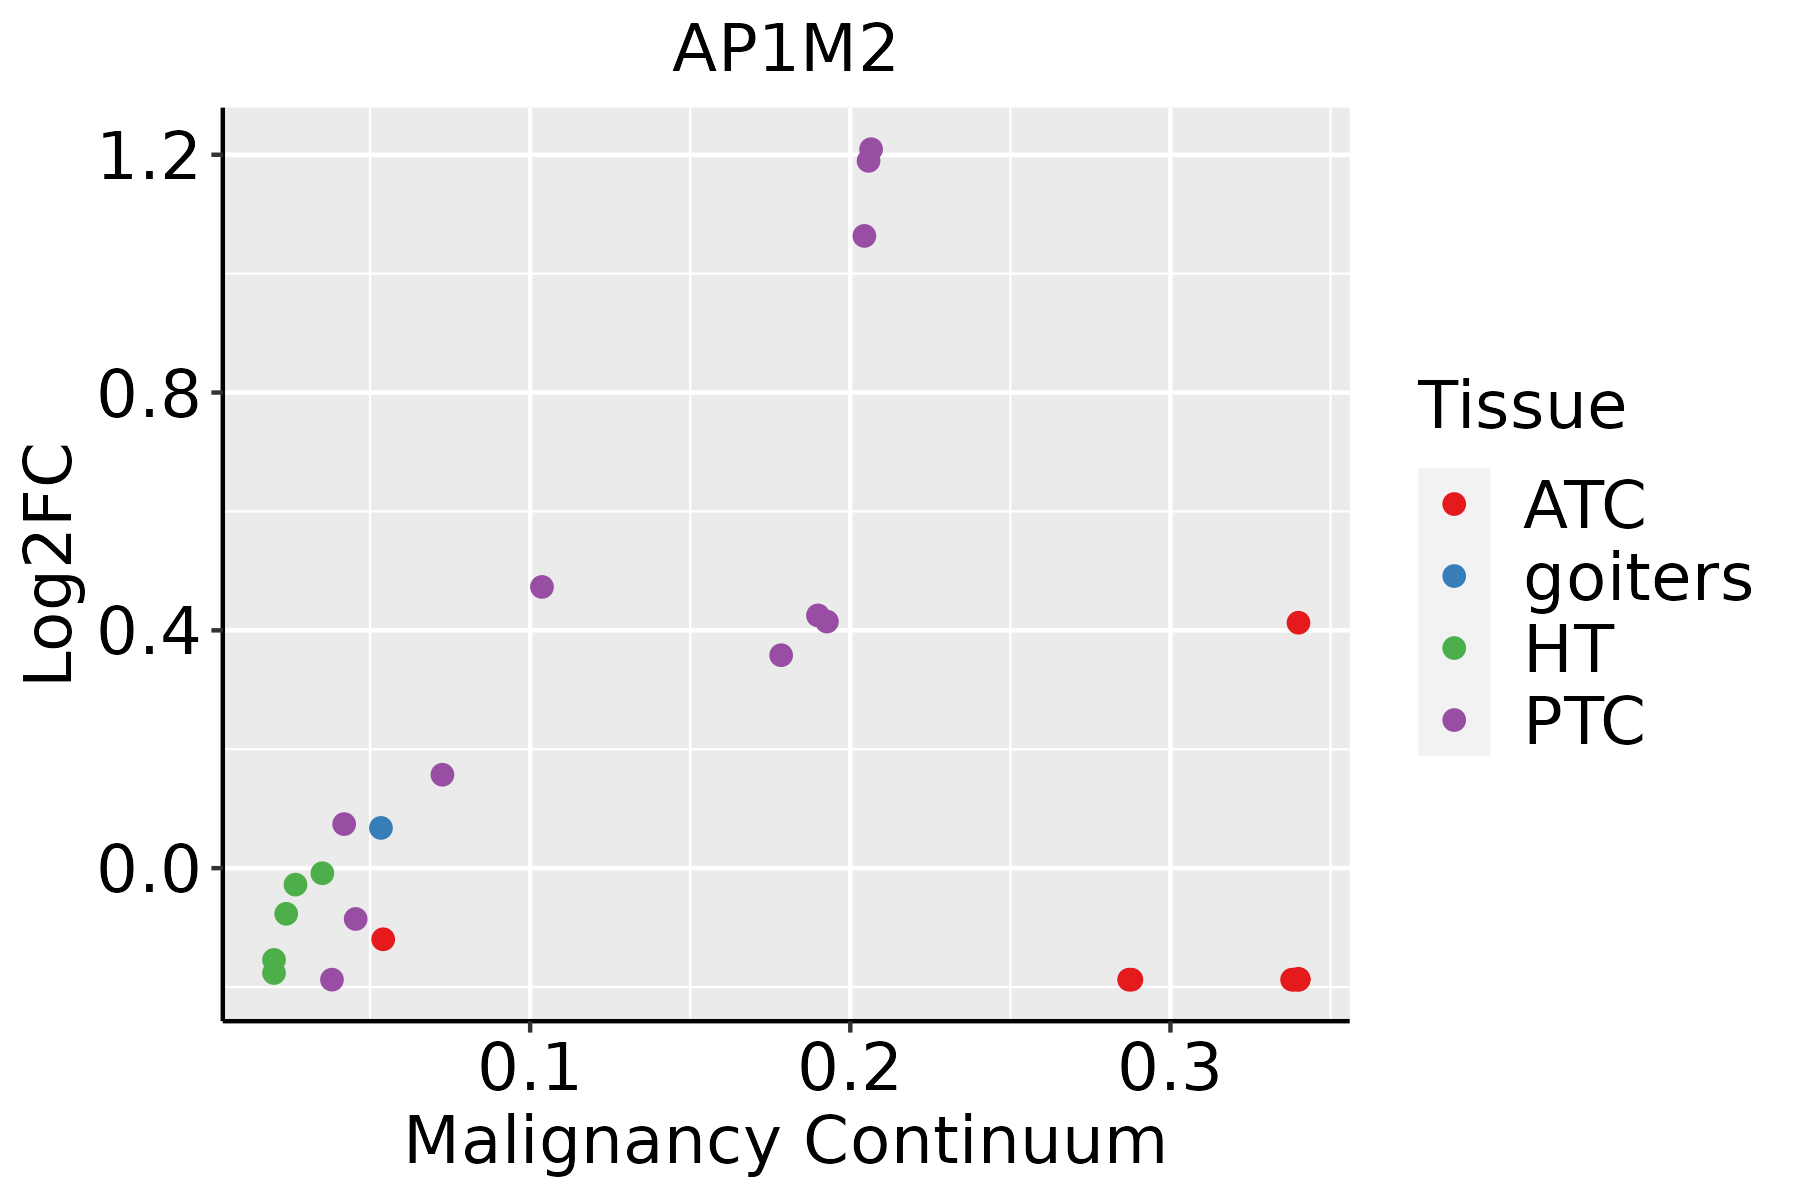 | ATC: Anaplastic thyroid cancer |
| HT: Hashimoto's thyroiditis | ||
| PTC: Papillary thyroid cancer |
| ∗log2FC in expression of this searched gene in stem-like cells from each diseased tissue sample relative to stem-like cells in normal samples in each tissue plotted against the malignancy continuum. Samples are colored based on if they are from different disease stage. |
Top |
Malignant transformation related pathway analysis |
| Find out the enriched GO biological processes and KEGG pathways involved in transition from healthy to precancer to cancer |
| Tissue | Disease Stage | Enriched GO biological Processes |
| Colorectum | AD |  |
| Colorectum | SER |  |
| Colorectum | MSS |  |
| Colorectum | MSI-H |  |
| Colorectum | FAP |  |
| ∗Top 15 enriched GO BP terms are showed in the bar plot of each disease state in each tissue. Each row represents a significant GO biological process which is colored according to the -log10(p.adjust). |
| Page: 1 2 3 4 5 6 7 8 9 |
| GO ID | Tissue | Disease Stage | Description | Gene Ratio | Bg Ratio | pvalue | p.adjust | Count |
| GO:0051656 | Colorectum | AD | establishment of organelle localization | 131/3918 | 390/18723 | 3.00e-09 | 2.06e-07 | 131 |
| GO:0006605 | Colorectum | AD | protein targeting | 105/3918 | 314/18723 | 1.39e-07 | 6.44e-06 | 105 |
| GO:0051650 | Colorectum | AD | establishment of vesicle localization | 57/3918 | 161/18723 | 1.47e-05 | 3.15e-04 | 57 |
| GO:0051648 | Colorectum | AD | vesicle localization | 59/3918 | 177/18723 | 7.83e-05 | 1.25e-03 | 59 |
| GO:0006903 | Colorectum | AD | vesicle targeting | 19/3918 | 45/18723 | 9.94e-04 | 9.28e-03 | 19 |
| GO:00516561 | Colorectum | SER | establishment of organelle localization | 100/2897 | 390/18723 | 1.11e-07 | 6.79e-06 | 100 |
| GO:00066051 | Colorectum | SER | protein targeting | 76/2897 | 314/18723 | 3.19e-05 | 8.47e-04 | 76 |
| GO:00516501 | Colorectum | SER | establishment of vesicle localization | 42/2897 | 161/18723 | 3.38e-04 | 5.35e-03 | 42 |
| GO:00516481 | Colorectum | SER | vesicle localization | 43/2897 | 177/18723 | 1.41e-03 | 1.53e-02 | 43 |
| GO:00069031 | Colorectum | SER | vesicle targeting | 14/2897 | 45/18723 | 6.36e-03 | 4.57e-02 | 14 |
| GO:00066052 | Colorectum | MSS | protein targeting | 97/3467 | 314/18723 | 6.76e-08 | 3.46e-06 | 97 |
| GO:00516562 | Colorectum | MSS | establishment of organelle localization | 115/3467 | 390/18723 | 7.30e-08 | 3.67e-06 | 115 |
| GO:00516502 | Colorectum | MSS | establishment of vesicle localization | 51/3467 | 161/18723 | 3.92e-05 | 7.45e-04 | 51 |
| GO:00516482 | Colorectum | MSS | vesicle localization | 53/3467 | 177/18723 | 1.47e-04 | 2.16e-03 | 53 |
| GO:00069032 | Colorectum | MSS | vesicle targeting | 17/3467 | 45/18723 | 1.89e-03 | 1.65e-02 | 17 |
| GO:00066053 | Colorectum | MSI-H | protein targeting | 44/1319 | 314/18723 | 9.50e-06 | 4.55e-04 | 44 |
| GO:00516563 | Colorectum | FAP | establishment of organelle localization | 97/2622 | 390/18723 | 5.91e-09 | 9.48e-07 | 97 |
| GO:00516503 | Colorectum | FAP | establishment of vesicle localization | 48/2622 | 161/18723 | 1.56e-07 | 9.64e-06 | 48 |
| GO:00516483 | Colorectum | FAP | vesicle localization | 50/2622 | 177/18723 | 5.41e-07 | 2.72e-05 | 50 |
| GO:00066054 | Colorectum | FAP | protein targeting | 74/2622 | 314/18723 | 3.21e-06 | 1.17e-04 | 74 |
| Page: 1 2 3 4 |
| Pathway ID | Tissue | Disease Stage | Description | Gene Ratio | Bg Ratio | pvalue | p.adjust | qvalue | Count |
| hsa051702 | Colorectum | SER | Human immunodeficiency virus 1 infection | 58/1580 | 212/8465 | 1.08e-03 | 8.56e-03 | 6.21e-03 | 58 |
| hsa04142 | Colorectum | SER | Lysosome | 38/1580 | 132/8465 | 2.87e-03 | 2.03e-02 | 1.47e-02 | 38 |
| hsa051703 | Colorectum | SER | Human immunodeficiency virus 1 infection | 58/1580 | 212/8465 | 1.08e-03 | 8.56e-03 | 6.21e-03 | 58 |
| hsa041421 | Colorectum | SER | Lysosome | 38/1580 | 132/8465 | 2.87e-03 | 2.03e-02 | 1.47e-02 | 38 |
| hsa051704 | Colorectum | MSS | Human immunodeficiency virus 1 infection | 69/1875 | 212/8465 | 2.66e-04 | 1.98e-03 | 1.21e-03 | 69 |
| hsa051705 | Colorectum | MSS | Human immunodeficiency virus 1 infection | 69/1875 | 212/8465 | 2.66e-04 | 1.98e-03 | 1.21e-03 | 69 |
| hsa051706 | Colorectum | FAP | Human immunodeficiency virus 1 infection | 51/1404 | 212/8465 | 2.98e-03 | 1.29e-02 | 7.87e-03 | 51 |
| hsa051707 | Colorectum | FAP | Human immunodeficiency virus 1 infection | 51/1404 | 212/8465 | 2.98e-03 | 1.29e-02 | 7.87e-03 | 51 |
| hsa0414222 | Esophagus | ESCC | Lysosome | 102/4205 | 132/8465 | 5.11e-11 | 7.13e-10 | 3.65e-10 | 102 |
| hsa05170210 | Esophagus | ESCC | Human immunodeficiency virus 1 infection | 147/4205 | 212/8465 | 3.37e-09 | 3.53e-08 | 1.81e-08 | 147 |
| hsa0414232 | Esophagus | ESCC | Lysosome | 102/4205 | 132/8465 | 5.11e-11 | 7.13e-10 | 3.65e-10 | 102 |
| hsa0517038 | Esophagus | ESCC | Human immunodeficiency virus 1 infection | 147/4205 | 212/8465 | 3.37e-09 | 3.53e-08 | 1.81e-08 | 147 |
| hsa041424 | Liver | Cirrhotic | Lysosome | 68/2530 | 132/8465 | 1.34e-07 | 1.97e-06 | 1.21e-06 | 68 |
| hsa0414211 | Liver | Cirrhotic | Lysosome | 68/2530 | 132/8465 | 1.34e-07 | 1.97e-06 | 1.21e-06 | 68 |
| hsa041422 | Liver | HCC | Lysosome | 100/4020 | 132/8465 | 2.32e-11 | 4.31e-10 | 2.40e-10 | 100 |
| hsa051709 | Liver | HCC | Human immunodeficiency virus 1 infection | 125/4020 | 212/8465 | 4.51e-04 | 1.94e-03 | 1.08e-03 | 125 |
| hsa041423 | Liver | HCC | Lysosome | 100/4020 | 132/8465 | 2.32e-11 | 4.31e-10 | 2.40e-10 | 100 |
| hsa0517012 | Liver | HCC | Human immunodeficiency virus 1 infection | 125/4020 | 212/8465 | 4.51e-04 | 1.94e-03 | 1.08e-03 | 125 |
| hsa0517027 | Oral cavity | OSCC | Human immunodeficiency virus 1 infection | 133/3704 | 212/8465 | 1.42e-08 | 1.40e-07 | 7.12e-08 | 133 |
| hsa041425 | Oral cavity | OSCC | Lysosome | 87/3704 | 132/8465 | 1.97e-07 | 1.35e-06 | 6.86e-07 | 87 |
| Page: 1 2 |
Top |
Cell-cell communication analysis |
| Identification of potential cell-cell interactions between two cell types and their ligand-receptor pairs for different disease states |
| Ligand | Receptor | LRpair | Pathway | Tissue | Disease Stage |
| Page: 1 |
Top |
Single-cell gene regulatory network inference analysis |
| Find out the significant the regulons (TFs) and the target genes of each regulon across cell types for different disease states |
| TF | Cell Type | Tissue | Disease Stage | Target Gene | RSS | Regulon Activity |
| ∗The dot plots of a searched regulon are shown for all cell subpopulations in each disease state of each tissue based on the regulon specific score inferred using pySCENIC and by calculating the average expression. |
| Page: 1 |
Top |
Somatic mutation of malignant transformation related genes |
| Annotation of somatic variants for genes involved in malignant transformation |
| Hugo Symbol | Variant Class | Variant Classification | dbSNP RS | HGVSc | HGVSp | HGVSp Short | SWISSPROT | BIOTYPE | SIFT | PolyPhen | Tumor Sample Barcode | Tissue | Histology | Sex | Age | Stage | Therapy Types | Drugs | Outcome |
| AP1M2 | SNV | Missense_Mutation | rs372188688 | c.478N>T | p.Arg160Cys | p.R160C | Q9Y6Q5 | protein_coding | deleterious(0) | probably_damaging(1) | TCGA-BH-A0HA-01 | Breast | breast invasive carcinoma | Female | <65 | I/II | Unknown | Unknown | SD |
| AP1M2 | SNV | Missense_Mutation | c.837C>G | p.Ile279Met | p.I279M | Q9Y6Q5 | protein_coding | deleterious(0.01) | benign(0.358) | TCGA-E9-A228-01 | Breast | breast invasive carcinoma | Female | <65 | I/II | Chemotherapy | doxorubicin | SD | |
| AP1M2 | SNV | Missense_Mutation | c.508G>A | p.Glu170Lys | p.E170K | Q9Y6Q5 | protein_coding | deleterious(0) | probably_damaging(0.997) | TCGA-EK-A3GJ-01 | Cervix | cervical & endocervical cancer | Female | <65 | I/II | Unknown | Unknown | SD | |
| AP1M2 | SNV | Missense_Mutation | rs754967797 | c.541N>A | p.Leu181Met | p.L181M | Q9Y6Q5 | protein_coding | tolerated(0.49) | benign(0.076) | TCGA-A6-2672-01 | Colorectum | colon adenocarcinoma | Female | >=65 | III/IV | Unknown | Unknown | SD |
| AP1M2 | SNV | Missense_Mutation | novel | c.346N>A | p.Glu116Lys | p.E116K | Q9Y6Q5 | protein_coding | deleterious(0) | probably_damaging(0.999) | TCGA-A6-2672-01 | Colorectum | colon adenocarcinoma | Female | >=65 | III/IV | Unknown | Unknown | SD |
| AP1M2 | SNV | Missense_Mutation | c.1135N>A | p.Gly379Arg | p.G379R | Q9Y6Q5 | protein_coding | tolerated(0.5) | benign(0) | TCGA-A6-2677-01 | Colorectum | colon adenocarcinoma | Female | >=65 | III/IV | Ancillary | leucovorin | SD | |
| AP1M2 | SNV | Missense_Mutation | c.889G>A | p.Val297Ile | p.V297I | Q9Y6Q5 | protein_coding | tolerated(0.53) | benign(0.024) | TCGA-AA-A01P-01 | Colorectum | colon adenocarcinoma | Female | >=65 | III/IV | Unknown | Unknown | PD | |
| AP1M2 | SNV | Missense_Mutation | c.158G>A | p.Gly53Asp | p.G53D | Q9Y6Q5 | protein_coding | tolerated(0.9) | benign(0.003) | TCGA-AY-6197-01 | Colorectum | colon adenocarcinoma | Male | <65 | I/II | Unknown | Unknown | SD | |
| AP1M2 | SNV | Missense_Mutation | rs370107597 | c.431N>T | p.Thr144Met | p.T144M | Q9Y6Q5 | protein_coding | tolerated(0.1) | benign(0.103) | TCGA-AZ-6598-01 | Colorectum | colon adenocarcinoma | Female | >=65 | I/II | Unknown | Unknown | SD |
| AP1M2 | SNV | Missense_Mutation | rs780844145 | c.133N>A | p.Ala45Thr | p.A45T | Q9Y6Q5 | protein_coding | tolerated(0.59) | benign(0.005) | TCGA-AZ-6601-01 | Colorectum | colon adenocarcinoma | Male | >=65 | I/II | Unknown | Unknown | PD |
| Page: 1 2 3 4 5 |
Top |
Related drugs of malignant transformation related genes |
| Identification of chemicals and drugs interact with genes involved in malignant transfromation |
| (DGIdb 4.0) |
| Entrez ID | Symbol | Category | Interaction Types | Drug Claim Name | Drug Name | PMIDs |
| Page: 1 |

Copyright 2023-Present -The University of Texas Health Science Center at Houston |