
|
|||||
|
 | |
| |
| |
| |
| |
| |
|
Gene: AP1M1 |
Gene summary for AP1M1 |
| Gene information | Species | Human | Gene symbol | AP1M1 | Gene ID | 8907 |
| Gene name | adaptor related protein complex 1 subunit mu 1 | |
| Gene Alias | AP47 | |
| Cytomap | 19p13.11 | |
| Gene Type | protein-coding | GO ID | GO:0006810 | UniProtAcc | Q59EK3 |
Top |
Malignant transformation analysis |
| Identification of the aberrant gene expression in precancerous and cancerous lesions by comparing the gene expression of stem-like cells in diseased tissues with normal stem cells |
| Entrez ID | Symbol | Replicates | Species | Organ | Tissue | Adj P-value | Log2FC | Malignancy |
| 8907 | AP1M1 | LZE4T | Human | Esophagus | ESCC | 9.72e-06 | 2.33e-01 | 0.0811 |
| 8907 | AP1M1 | LZE7T | Human | Esophagus | ESCC | 5.26e-04 | 2.44e-01 | 0.0667 |
| 8907 | AP1M1 | LZE22T | Human | Esophagus | ESCC | 2.74e-04 | 3.84e-01 | 0.068 |
| 8907 | AP1M1 | LZE24T | Human | Esophagus | ESCC | 2.01e-08 | 1.62e-01 | 0.0596 |
| 8907 | AP1M1 | LZE21T | Human | Esophagus | ESCC | 4.13e-02 | 2.20e-01 | 0.0655 |
| 8907 | AP1M1 | P1T-E | Human | Esophagus | ESCC | 6.05e-06 | 2.91e-01 | 0.0875 |
| 8907 | AP1M1 | P2T-E | Human | Esophagus | ESCC | 1.87e-23 | 2.86e-01 | 0.1177 |
| 8907 | AP1M1 | P4T-E | Human | Esophagus | ESCC | 1.74e-12 | 3.12e-01 | 0.1323 |
| 8907 | AP1M1 | P5T-E | Human | Esophagus | ESCC | 2.36e-23 | 4.07e-01 | 0.1327 |
| 8907 | AP1M1 | P8T-E | Human | Esophagus | ESCC | 7.37e-26 | 3.81e-01 | 0.0889 |
| 8907 | AP1M1 | P9T-E | Human | Esophagus | ESCC | 8.61e-11 | 2.81e-01 | 0.1131 |
| 8907 | AP1M1 | P10T-E | Human | Esophagus | ESCC | 5.40e-33 | 5.21e-01 | 0.116 |
| 8907 | AP1M1 | P11T-E | Human | Esophagus | ESCC | 1.18e-18 | 5.84e-01 | 0.1426 |
| 8907 | AP1M1 | P12T-E | Human | Esophagus | ESCC | 4.97e-19 | 3.12e-01 | 0.1122 |
| 8907 | AP1M1 | P15T-E | Human | Esophagus | ESCC | 2.83e-11 | 2.53e-01 | 0.1149 |
| 8907 | AP1M1 | P16T-E | Human | Esophagus | ESCC | 1.81e-10 | 2.20e-01 | 0.1153 |
| 8907 | AP1M1 | P17T-E | Human | Esophagus | ESCC | 4.70e-12 | 5.40e-01 | 0.1278 |
| 8907 | AP1M1 | P19T-E | Human | Esophagus | ESCC | 1.86e-17 | 7.78e-01 | 0.1662 |
| 8907 | AP1M1 | P20T-E | Human | Esophagus | ESCC | 2.52e-17 | 3.23e-01 | 0.1124 |
| 8907 | AP1M1 | P21T-E | Human | Esophagus | ESCC | 6.21e-28 | 5.79e-01 | 0.1617 |
| Page: 1 2 3 4 5 |
| Tissue | Expression Dynamics | Abbreviation |
| Esophagus | 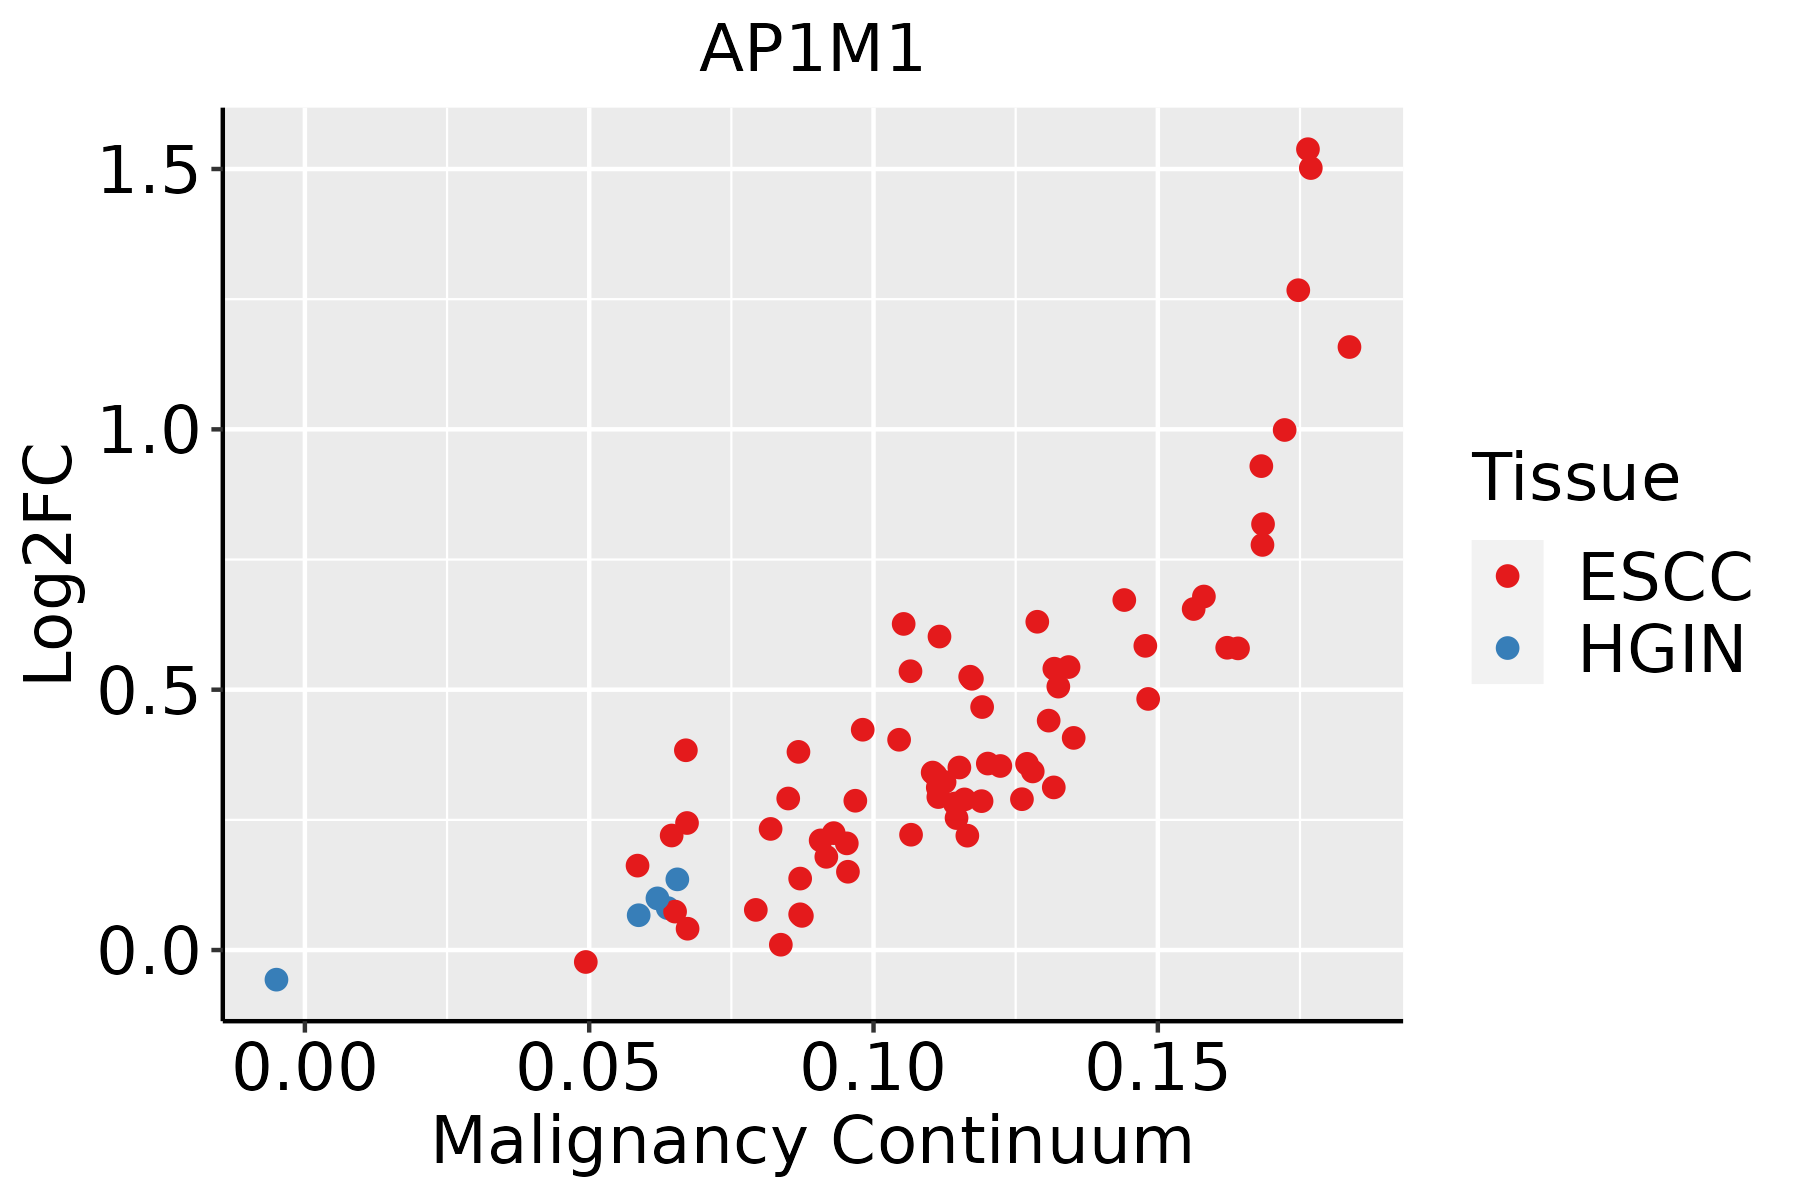 | ESCC: Esophageal squamous cell carcinoma |
| HGIN: High-grade intraepithelial neoplasias | ||
| LGIN: Low-grade intraepithelial neoplasias | ||
| Liver | 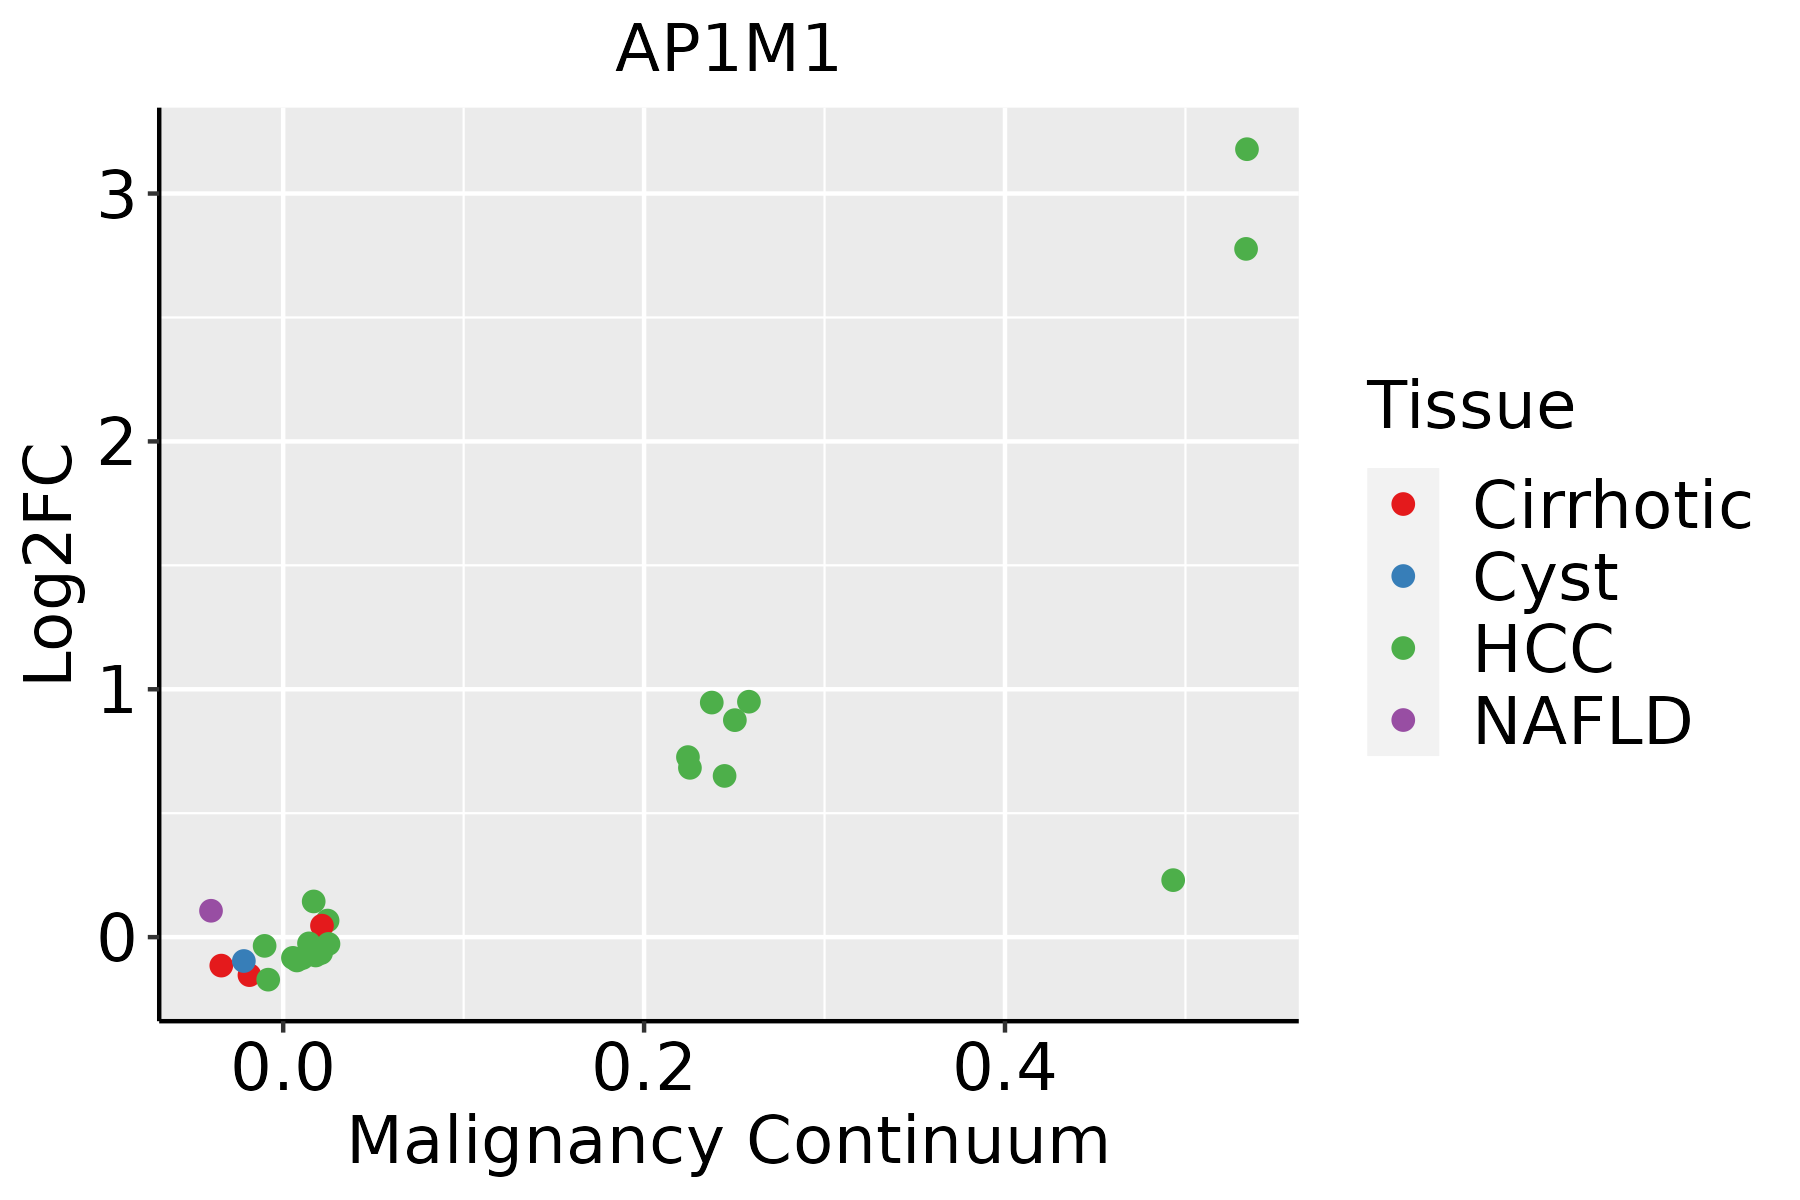 | HCC: Hepatocellular carcinoma |
| NAFLD: Non-alcoholic fatty liver disease | ||
| Oral Cavity | 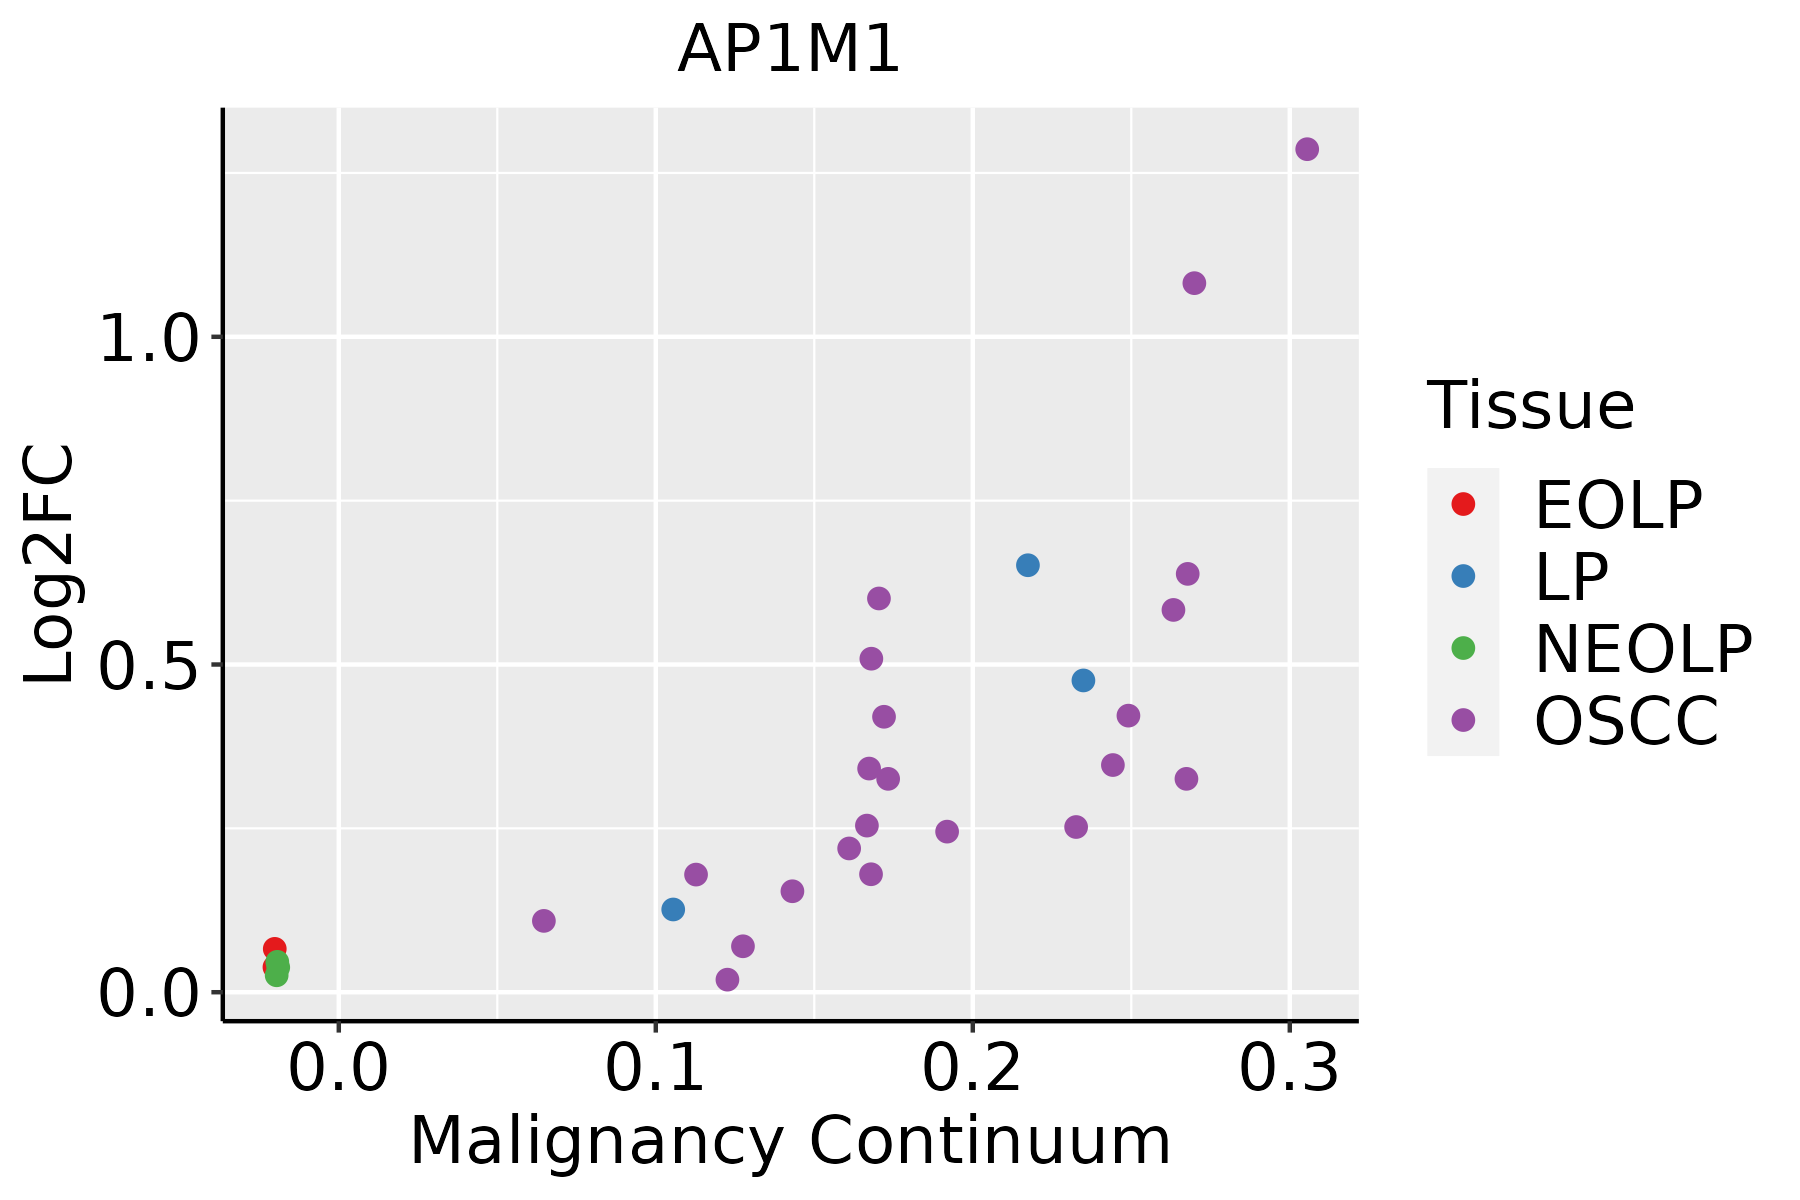 | EOLP: Erosive Oral lichen planus |
| LP: leukoplakia | ||
| NEOLP: Non-erosive oral lichen planus | ||
| OSCC: Oral squamous cell carcinoma | ||
| Thyroid |  | ATC: Anaplastic thyroid cancer |
| HT: Hashimoto's thyroiditis | ||
| PTC: Papillary thyroid cancer |
| ∗log2FC in expression of this searched gene in stem-like cells from each diseased tissue sample relative to stem-like cells in normal samples in each tissue plotted against the malignancy continuum. Samples are colored based on if they are from different disease stage. |
Top |
Malignant transformation related pathway analysis |
| Find out the enriched GO biological processes and KEGG pathways involved in transition from healthy to precancer to cancer |
| Tissue | Disease Stage | Enriched GO biological Processes |
| Colorectum | AD |  |
| Colorectum | SER |  |
| Colorectum | MSS |  |
| Colorectum | MSI-H |  |
| Colorectum | FAP |  |
| ∗Top 15 enriched GO BP terms are showed in the bar plot of each disease state in each tissue. Each row represents a significant GO biological process which is colored according to the -log10(p.adjust). |
| Page: 1 2 3 4 5 6 7 8 9 |
| GO ID | Tissue | Disease Stage | Description | Gene Ratio | Bg Ratio | pvalue | p.adjust | Count |
| GO:001605014 | Esophagus | ESCC | vesicle organization | 211/8552 | 300/18723 | 2.85e-18 | 2.87e-16 | 211 |
| GO:00330593 | Esophagus | ESCC | cellular pigmentation | 40/8552 | 53/18723 | 9.67e-06 | 9.21e-05 | 40 |
| GO:00487531 | Esophagus | ESCC | pigment granule organization | 23/8552 | 29/18723 | 2.25e-04 | 1.40e-03 | 23 |
| GO:00324381 | Esophagus | ESCC | melanosome organization | 22/8552 | 28/18723 | 3.95e-04 | 2.26e-03 | 22 |
| GO:00434731 | Esophagus | ESCC | pigmentation | 59/8552 | 98/18723 | 2.64e-03 | 1.12e-02 | 59 |
| GO:0035646 | Esophagus | ESCC | endosome to melanosome transport | 9/8552 | 10/18723 | 5.09e-03 | 1.92e-02 | 9 |
| GO:0043485 | Esophagus | ESCC | endosome to pigment granule transport | 9/8552 | 10/18723 | 5.09e-03 | 1.92e-02 | 9 |
| GO:0048757 | Esophagus | ESCC | pigment granule maturation | 9/8552 | 10/18723 | 5.09e-03 | 1.92e-02 | 9 |
| GO:0043476 | Esophagus | ESCC | pigment accumulation | 10/8552 | 12/18723 | 8.94e-03 | 3.12e-02 | 10 |
| GO:0043482 | Esophagus | ESCC | cellular pigment accumulation | 10/8552 | 12/18723 | 8.94e-03 | 3.12e-02 | 10 |
| GO:001605021 | Liver | HCC | vesicle organization | 194/7958 | 300/18723 | 5.58e-15 | 3.97e-13 | 194 |
| GO:00160508 | Oral cavity | OSCC | vesicle organization | 189/7305 | 300/18723 | 2.40e-17 | 2.14e-15 | 189 |
| GO:0033059 | Oral cavity | OSCC | cellular pigmentation | 33/7305 | 53/18723 | 5.11e-04 | 2.98e-03 | 33 |
| GO:0048753 | Oral cavity | OSCC | pigment granule organization | 20/7305 | 29/18723 | 1.05e-03 | 5.39e-03 | 20 |
| GO:0032438 | Oral cavity | OSCC | melanosome organization | 19/7305 | 28/18723 | 1.88e-03 | 8.84e-03 | 19 |
| GO:001605013 | Oral cavity | LP | vesicle organization | 128/4623 | 300/18723 | 4.96e-12 | 3.98e-10 | 128 |
| GO:00330591 | Oral cavity | LP | cellular pigmentation | 22/4623 | 53/18723 | 5.20e-03 | 3.19e-02 | 22 |
| GO:001605017 | Thyroid | PTC | vesicle organization | 163/5968 | 300/18723 | 4.74e-16 | 3.69e-14 | 163 |
| GO:001605023 | Thyroid | ATC | vesicle organization | 166/6293 | 300/18723 | 6.14e-15 | 3.92e-13 | 166 |
| GO:00330595 | Thyroid | ATC | cellular pigmentation | 26/6293 | 53/18723 | 1.42e-02 | 4.91e-02 | 26 |
| Page: 1 |
| Pathway ID | Tissue | Disease Stage | Description | Gene Ratio | Bg Ratio | pvalue | p.adjust | qvalue | Count |
| hsa0414222 | Esophagus | ESCC | Lysosome | 102/4205 | 132/8465 | 5.11e-11 | 7.13e-10 | 3.65e-10 | 102 |
| hsa05170210 | Esophagus | ESCC | Human immunodeficiency virus 1 infection | 147/4205 | 212/8465 | 3.37e-09 | 3.53e-08 | 1.81e-08 | 147 |
| hsa0414232 | Esophagus | ESCC | Lysosome | 102/4205 | 132/8465 | 5.11e-11 | 7.13e-10 | 3.65e-10 | 102 |
| hsa0517038 | Esophagus | ESCC | Human immunodeficiency virus 1 infection | 147/4205 | 212/8465 | 3.37e-09 | 3.53e-08 | 1.81e-08 | 147 |
| hsa041422 | Liver | HCC | Lysosome | 100/4020 | 132/8465 | 2.32e-11 | 4.31e-10 | 2.40e-10 | 100 |
| hsa051709 | Liver | HCC | Human immunodeficiency virus 1 infection | 125/4020 | 212/8465 | 4.51e-04 | 1.94e-03 | 1.08e-03 | 125 |
| hsa041423 | Liver | HCC | Lysosome | 100/4020 | 132/8465 | 2.32e-11 | 4.31e-10 | 2.40e-10 | 100 |
| hsa0517012 | Liver | HCC | Human immunodeficiency virus 1 infection | 125/4020 | 212/8465 | 4.51e-04 | 1.94e-03 | 1.08e-03 | 125 |
| hsa0517027 | Oral cavity | OSCC | Human immunodeficiency virus 1 infection | 133/3704 | 212/8465 | 1.42e-08 | 1.40e-07 | 7.12e-08 | 133 |
| hsa041425 | Oral cavity | OSCC | Lysosome | 87/3704 | 132/8465 | 1.97e-07 | 1.35e-06 | 6.86e-07 | 87 |
| hsa05170111 | Oral cavity | OSCC | Human immunodeficiency virus 1 infection | 133/3704 | 212/8465 | 1.42e-08 | 1.40e-07 | 7.12e-08 | 133 |
| hsa0414212 | Oral cavity | OSCC | Lysosome | 87/3704 | 132/8465 | 1.97e-07 | 1.35e-06 | 6.86e-07 | 87 |
| hsa0414221 | Oral cavity | LP | Lysosome | 67/2418 | 132/8465 | 5.13e-08 | 7.77e-07 | 5.01e-07 | 67 |
| hsa0517028 | Oral cavity | LP | Human immunodeficiency virus 1 infection | 92/2418 | 212/8465 | 2.18e-06 | 2.20e-05 | 1.42e-05 | 92 |
| hsa0414231 | Oral cavity | LP | Lysosome | 67/2418 | 132/8465 | 5.13e-08 | 7.77e-07 | 5.01e-07 | 67 |
| hsa0517037 | Oral cavity | LP | Human immunodeficiency virus 1 infection | 92/2418 | 212/8465 | 2.18e-06 | 2.20e-05 | 1.42e-05 | 92 |
| Page: 1 |
Top |
Cell-cell communication analysis |
| Identification of potential cell-cell interactions between two cell types and their ligand-receptor pairs for different disease states |
| Ligand | Receptor | LRpair | Pathway | Tissue | Disease Stage |
| Page: 1 |
Top |
Single-cell gene regulatory network inference analysis |
| Find out the significant the regulons (TFs) and the target genes of each regulon across cell types for different disease states |
| TF | Cell Type | Tissue | Disease Stage | Target Gene | RSS | Regulon Activity |
| ∗The dot plots of a searched regulon are shown for all cell subpopulations in each disease state of each tissue based on the regulon specific score inferred using pySCENIC and by calculating the average expression. |
| Page: 1 |
Top |
Somatic mutation of malignant transformation related genes |
| Annotation of somatic variants for genes involved in malignant transformation |
| Hugo Symbol | Variant Class | Variant Classification | dbSNP RS | HGVSc | HGVSp | HGVSp Short | SWISSPROT | BIOTYPE | SIFT | PolyPhen | Tumor Sample Barcode | Tissue | Histology | Sex | Age | Stage | Therapy Types | Drugs | Outcome |
| AP1M1 | SNV | Missense_Mutation | novel | c.1019C>T | p.Thr340Met | p.T340M | Q9BXS5 | protein_coding | deleterious(0) | possibly_damaging(0.903) | TCGA-E2-A576-01 | Breast | breast invasive carcinoma | Female | >=65 | I/II | Chemotherapy | taxotere | SD |
| AP1M1 | SNV | Missense_Mutation | novel | c.727G>A | p.Val243Met | p.V243M | Q9BXS5 | protein_coding | deleterious(0.01) | probably_damaging(0.991) | TCGA-LL-A5YP-01 | Breast | breast invasive carcinoma | Female | <65 | I/II | Chemotherapy | cytoxan | SD |
| AP1M1 | SNV | Missense_Mutation | rs376335032 | c.874N>A | p.Glu292Lys | p.E292K | Q9BXS5 | protein_coding | deleterious(0.01) | probably_damaging(0.933) | TCGA-2W-A8YY-01 | Cervix | cervical & endocervical cancer | Female | <65 | I/II | Chemotherapy | cisplatin | CR |
| AP1M1 | SNV | Missense_Mutation | rs774173547 | c.964N>A | p.Val322Met | p.V322M | Q9BXS5 | protein_coding | deleterious(0.02) | probably_damaging(0.993) | TCGA-2W-A8YY-01 | Cervix | cervical & endocervical cancer | Female | <65 | I/II | Chemotherapy | cisplatin | CR |
| AP1M1 | SNV | Missense_Mutation | rs200460904 | c.70N>A | p.Asp24Asn | p.D24N | Q9BXS5 | protein_coding | deleterious(0.02) | benign(0.127) | TCGA-FU-A3HZ-01 | Cervix | cervical & endocervical cancer | Female | <65 | I/II | Chemotherapy | cisplatin | CR |
| AP1M1 | SNV | Missense_Mutation | c.233N>T | p.Ser78Leu | p.S78L | Q9BXS5 | protein_coding | tolerated(0.39) | benign(0.094) | TCGA-JW-A852-01 | Cervix | cervical & endocervical cancer | Female | <65 | I/II | Unknown | Unknown | PD | |
| AP1M1 | SNV | Missense_Mutation | rs774173547 | c.964G>A | p.Val322Met | p.V322M | Q9BXS5 | protein_coding | deleterious(0.02) | probably_damaging(0.993) | TCGA-ZJ-A8QR-01 | Cervix | cervical & endocervical cancer | Female | <65 | I/II | Unknown | Unknown | SD |
| AP1M1 | SNV | Missense_Mutation | rs749998518 | c.223N>A | p.Ala75Thr | p.A75T | Q9BXS5 | protein_coding | tolerated(0.38) | benign(0.145) | TCGA-A6-3809-01 | Colorectum | colon adenocarcinoma | Female | >=65 | I/II | Unknown | Unknown | SD |
| AP1M1 | SNV | Missense_Mutation | c.463N>T | p.Asn155Tyr | p.N155Y | Q9BXS5 | protein_coding | deleterious(0) | probably_damaging(0.986) | TCGA-AA-3819-01 | Colorectum | colon adenocarcinoma | Female | <65 | I/II | Unknown | Unknown | SD | |
| AP1M1 | SNV | Missense_Mutation | novel | c.224C>T | p.Ala75Val | p.A75V | Q9BXS5 | protein_coding | tolerated(0.17) | benign(0.089) | TCGA-AA-A00N-01 | Colorectum | colon adenocarcinoma | Male | >=65 | I/II | Unknown | Unknown | PD |
| Page: 1 2 3 4 5 6 |
Top |
Related drugs of malignant transformation related genes |
| Identification of chemicals and drugs interact with genes involved in malignant transfromation |
| (DGIdb 4.0) |
| Entrez ID | Symbol | Category | Interaction Types | Drug Claim Name | Drug Name | PMIDs |
| Page: 1 |

Copyright 2023-Present -The University of Texas Health Science Center at Houston |