
|
|||||
|
 | |
| |
| |
| |
| |
| |
|
Gene: AP1G2 |
Gene summary for AP1G2 |
| Gene information | Species | Human | Gene symbol | AP1G2 | Gene ID | 8906 |
| Gene name | adaptor related protein complex 1 subunit gamma 2 | |
| Gene Alias | G2AD | |
| Cytomap | 14q11.2 | |
| Gene Type | protein-coding | GO ID | GO:0006810 | UniProtAcc | Q86U03 |
Top |
Malignant transformation analysis |
| Identification of the aberrant gene expression in precancerous and cancerous lesions by comparing the gene expression of stem-like cells in diseased tissues with normal stem cells |
| Entrez ID | Symbol | Replicates | Species | Organ | Tissue | Adj P-value | Log2FC | Malignancy |
| 8906 | AP1G2 | LZE4T | Human | Esophagus | ESCC | 8.72e-14 | 3.73e-01 | 0.0811 |
| 8906 | AP1G2 | LZE5T | Human | Esophagus | ESCC | 1.02e-06 | 3.16e-01 | 0.0514 |
| 8906 | AP1G2 | LZE7T | Human | Esophagus | ESCC | 1.08e-02 | 8.84e-02 | 0.0667 |
| 8906 | AP1G2 | LZE8T | Human | Esophagus | ESCC | 2.37e-09 | 2.22e-01 | 0.067 |
| 8906 | AP1G2 | LZE20T | Human | Esophagus | ESCC | 1.45e-03 | 1.26e-01 | 0.0662 |
| 8906 | AP1G2 | LZE21D1 | Human | Esophagus | HGIN | 5.45e-06 | 3.00e-01 | 0.0632 |
| 8906 | AP1G2 | LZE22D1 | Human | Esophagus | HGIN | 4.52e-04 | 5.69e-02 | 0.0595 |
| 8906 | AP1G2 | LZE22T | Human | Esophagus | ESCC | 4.12e-04 | 2.11e-01 | 0.068 |
| 8906 | AP1G2 | LZE24T | Human | Esophagus | ESCC | 4.39e-25 | 4.89e-01 | 0.0596 |
| 8906 | AP1G2 | LZE21T | Human | Esophagus | ESCC | 1.69e-04 | 1.75e-01 | 0.0655 |
| 8906 | AP1G2 | LZE6T | Human | Esophagus | ESCC | 1.07e-02 | 1.56e-01 | 0.0845 |
| 8906 | AP1G2 | P1T-E | Human | Esophagus | ESCC | 3.89e-07 | 2.90e-01 | 0.0875 |
| 8906 | AP1G2 | P2T-E | Human | Esophagus | ESCC | 2.55e-20 | 1.95e-01 | 0.1177 |
| 8906 | AP1G2 | P4T-E | Human | Esophagus | ESCC | 6.92e-22 | 2.56e-01 | 0.1323 |
| 8906 | AP1G2 | P5T-E | Human | Esophagus | ESCC | 1.69e-08 | 1.24e-01 | 0.1327 |
| 8906 | AP1G2 | P8T-E | Human | Esophagus | ESCC | 2.81e-46 | 7.27e-01 | 0.0889 |
| 8906 | AP1G2 | P9T-E | Human | Esophagus | ESCC | 1.97e-18 | 2.48e-01 | 0.1131 |
| 8906 | AP1G2 | P10T-E | Human | Esophagus | ESCC | 3.69e-21 | 3.78e-01 | 0.116 |
| 8906 | AP1G2 | P11T-E | Human | Esophagus | ESCC | 2.62e-10 | 5.70e-01 | 0.1426 |
| 8906 | AP1G2 | P12T-E | Human | Esophagus | ESCC | 4.76e-42 | 8.36e-01 | 0.1122 |
| Page: 1 2 3 4 5 |
| Tissue | Expression Dynamics | Abbreviation |
| Esophagus | 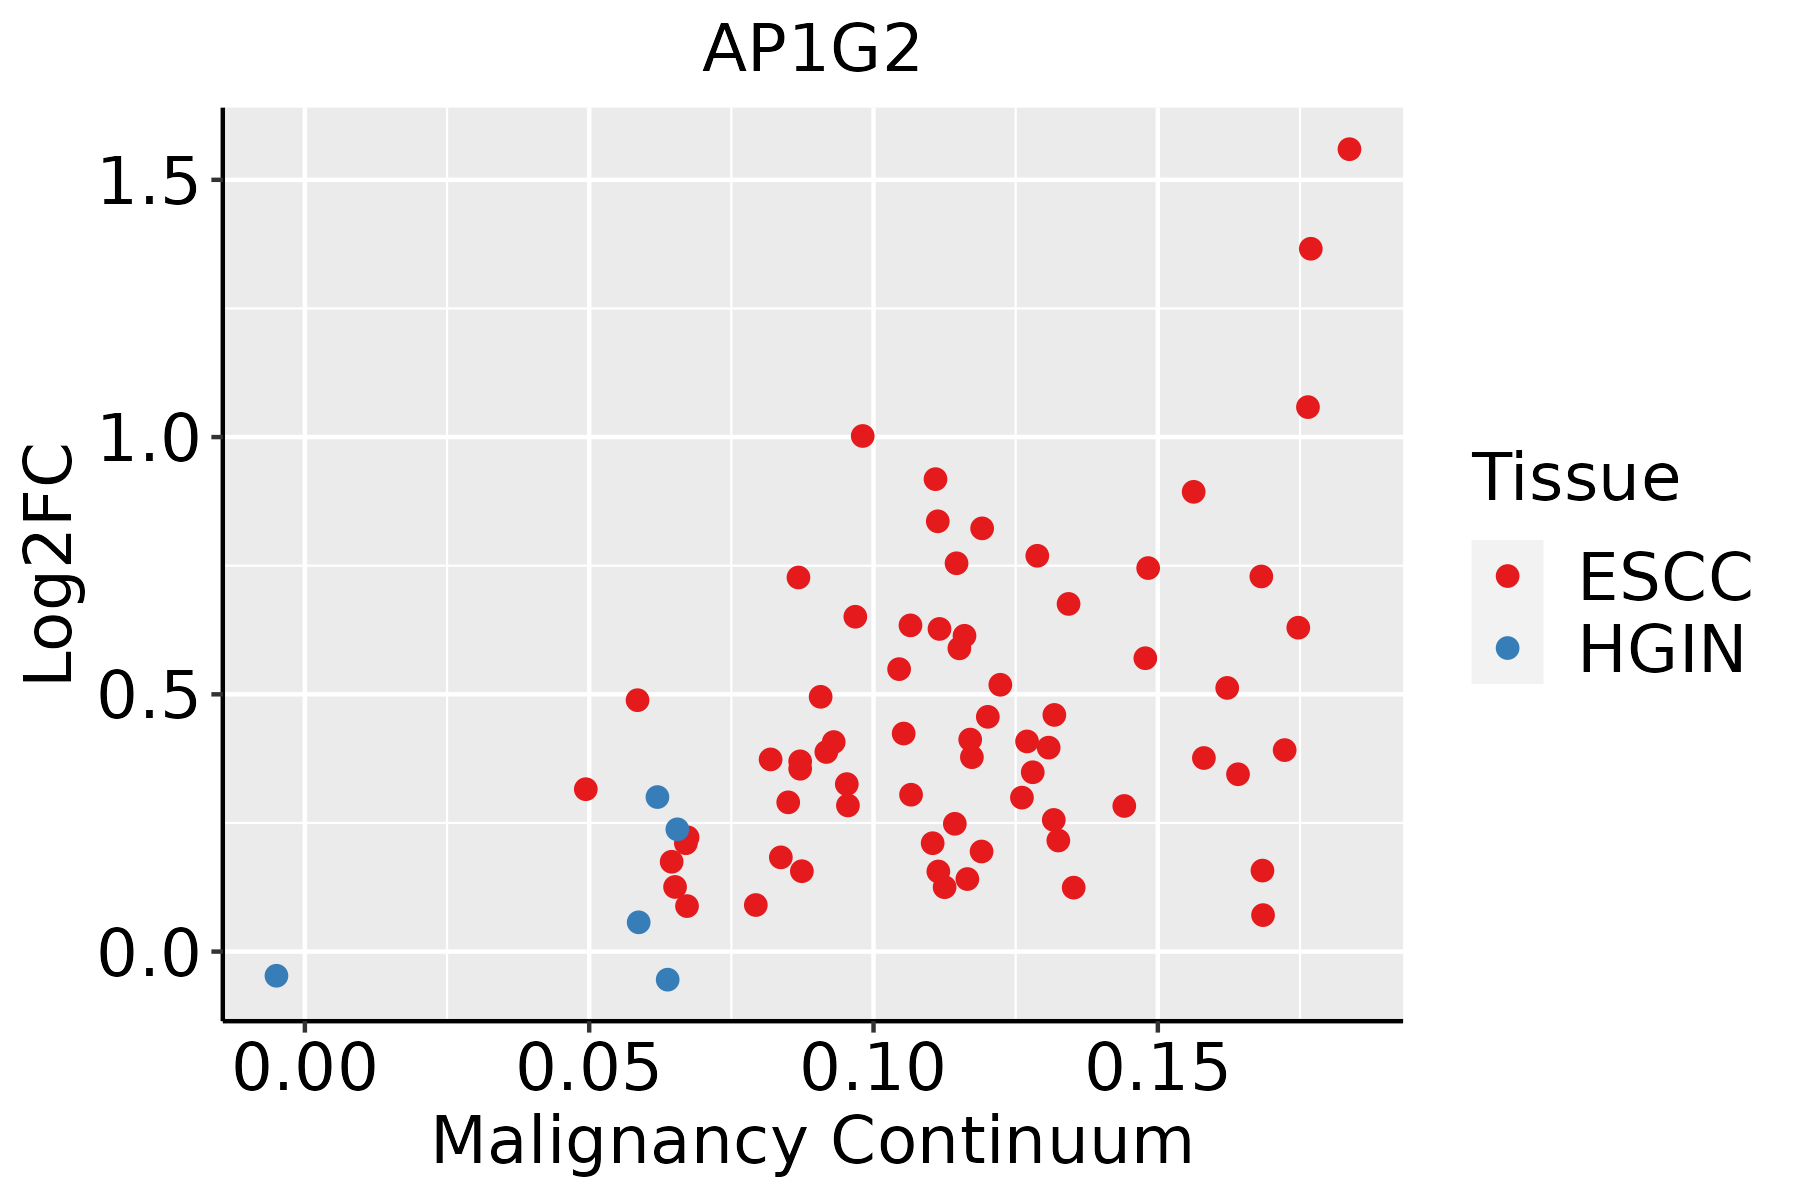 | ESCC: Esophageal squamous cell carcinoma |
| HGIN: High-grade intraepithelial neoplasias | ||
| LGIN: Low-grade intraepithelial neoplasias | ||
| Oral Cavity | 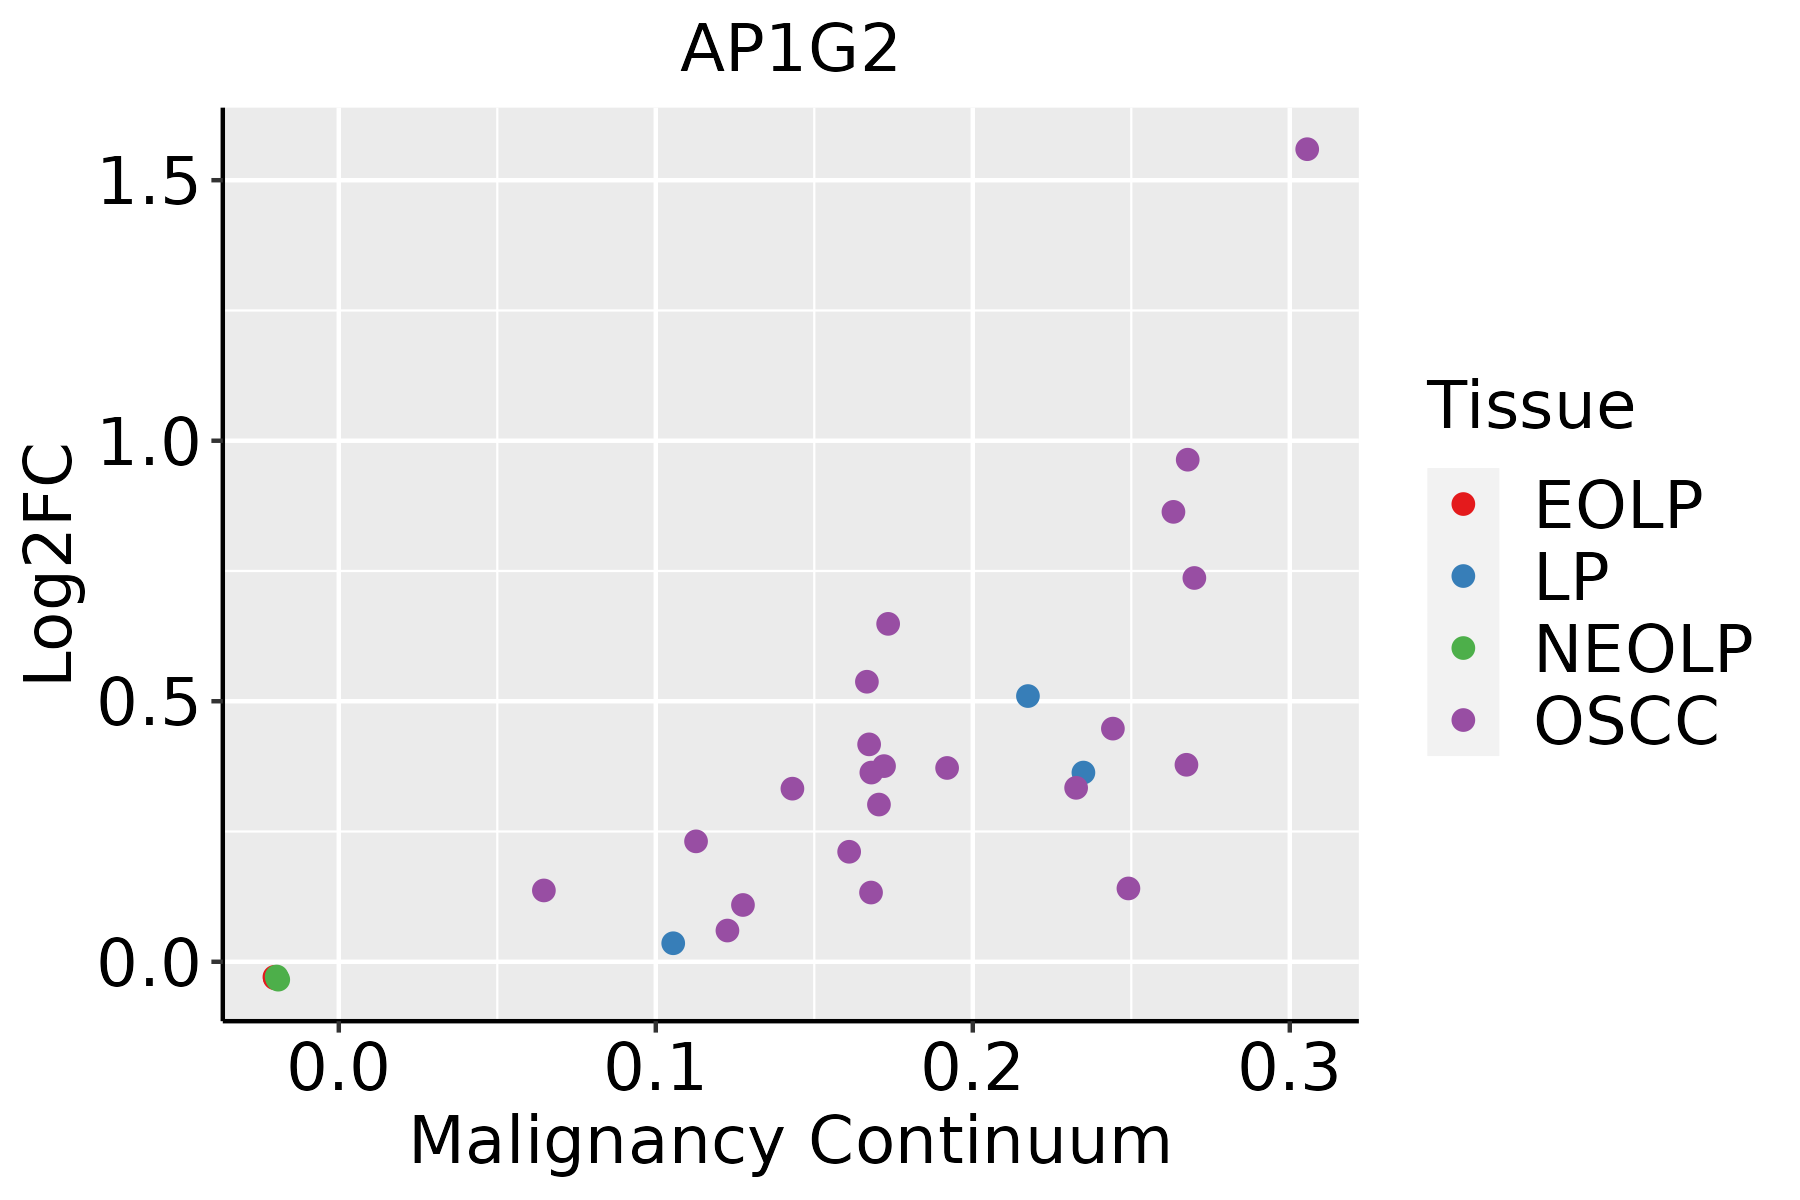 | EOLP: Erosive Oral lichen planus |
| LP: leukoplakia | ||
| NEOLP: Non-erosive oral lichen planus | ||
| OSCC: Oral squamous cell carcinoma | ||
| Skin | 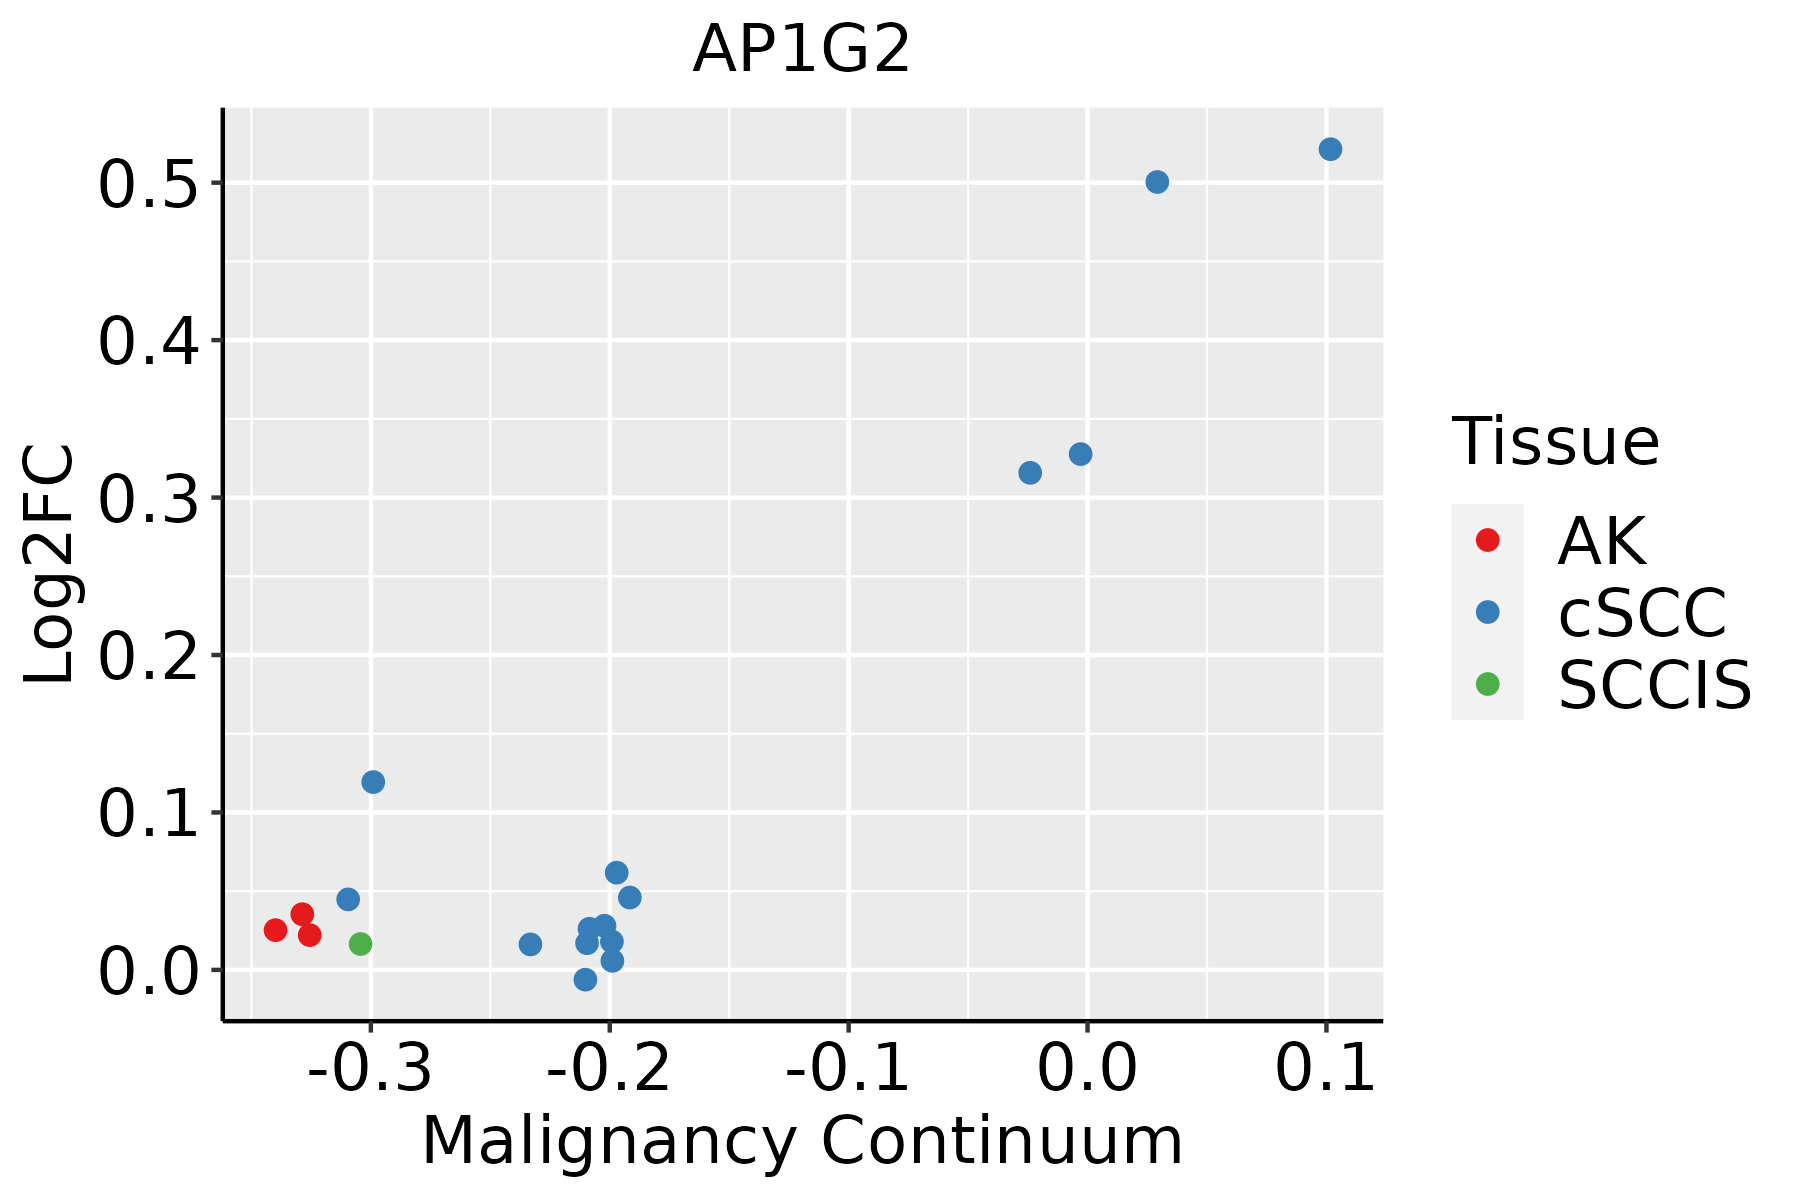 | AK: Actinic keratosis |
| cSCC: Cutaneous squamous cell carcinoma | ||
| SCCIS:squamous cell carcinoma in situ |
| ∗log2FC in expression of this searched gene in stem-like cells from each diseased tissue sample relative to stem-like cells in normal samples in each tissue plotted against the malignancy continuum. Samples are colored based on if they are from different disease stage. |
Top |
Malignant transformation related pathway analysis |
| Find out the enriched GO biological processes and KEGG pathways involved in transition from healthy to precancer to cancer |
| Tissue | Disease Stage | Enriched GO biological Processes |
| Colorectum | AD |  |
| Colorectum | SER |  |
| Colorectum | MSS |  |
| Colorectum | MSI-H |  |
| Colorectum | FAP |  |
| ∗Top 15 enriched GO BP terms are showed in the bar plot of each disease state in each tissue. Each row represents a significant GO biological process which is colored according to the -log10(p.adjust). |
| Page: 1 2 3 4 5 6 7 8 9 |
| GO ID | Tissue | Disease Stage | Description | Gene Ratio | Bg Ratio | pvalue | p.adjust | Count |
| GO:004819317 | Esophagus | HGIN | Golgi vesicle transport | 83/2587 | 296/18723 | 8.59e-11 | 8.89e-09 | 83 |
| GO:000689210 | Esophagus | HGIN | post-Golgi vesicle-mediated transport | 26/2587 | 104/18723 | 1.63e-03 | 1.81e-02 | 26 |
| GO:000703416 | Esophagus | HGIN | vacuolar transport | 35/2587 | 157/18723 | 2.52e-03 | 2.51e-02 | 35 |
| GO:004819318 | Esophagus | ESCC | Golgi vesicle transport | 231/8552 | 296/18723 | 1.82e-30 | 9.63e-28 | 231 |
| GO:000703417 | Esophagus | ESCC | vacuolar transport | 119/8552 | 157/18723 | 1.16e-14 | 6.30e-13 | 119 |
| GO:000689215 | Esophagus | ESCC | post-Golgi vesicle-mediated transport | 82/8552 | 104/18723 | 4.00e-12 | 1.55e-10 | 82 |
| GO:000689818 | Esophagus | ESCC | receptor-mediated endocytosis | 142/8552 | 244/18723 | 5.22e-05 | 4.05e-04 | 142 |
| GO:00068963 | Esophagus | ESCC | Golgi to vacuole transport | 16/8552 | 20/18723 | 1.85e-03 | 8.40e-03 | 16 |
| GO:004819315 | Oral cavity | OSCC | Golgi vesicle transport | 209/7305 | 296/18723 | 1.39e-28 | 6.30e-26 | 209 |
| GO:000703410 | Oral cavity | OSCC | vacuolar transport | 103/7305 | 157/18723 | 1.25e-11 | 4.44e-10 | 103 |
| GO:00068929 | Oral cavity | OSCC | post-Golgi vesicle-mediated transport | 71/7305 | 104/18723 | 1.37e-09 | 3.33e-08 | 71 |
| GO:000689810 | Oral cavity | OSCC | receptor-mediated endocytosis | 125/7305 | 244/18723 | 6.56e-05 | 5.32e-04 | 125 |
| GO:00068962 | Oral cavity | OSCC | Golgi to vacuole transport | 14/7305 | 20/18723 | 4.95e-03 | 1.94e-02 | 14 |
| GO:004819316 | Oral cavity | LP | Golgi vesicle transport | 141/4623 | 296/18723 | 6.11e-18 | 1.06e-15 | 141 |
| GO:000703415 | Oral cavity | LP | vacuolar transport | 74/4623 | 157/18723 | 7.85e-10 | 3.70e-08 | 74 |
| GO:000689214 | Oral cavity | LP | post-Golgi vesicle-mediated transport | 44/4623 | 104/18723 | 5.90e-05 | 8.05e-04 | 44 |
| GO:000689817 | Oral cavity | LP | receptor-mediated endocytosis | 87/4623 | 244/18723 | 7.83e-05 | 1.02e-03 | 87 |
| GO:00068961 | Oral cavity | LP | Golgi to vacuole transport | 12/4623 | 20/18723 | 8.24e-04 | 7.23e-03 | 12 |
| GO:0048193110 | Skin | cSCC | Golgi vesicle transport | 153/4864 | 296/18723 | 1.85e-21 | 3.41e-19 | 153 |
| GO:000703419 | Skin | cSCC | vacuolar transport | 74/4864 | 157/18723 | 8.60e-09 | 2.72e-07 | 74 |
| Page: 1 2 |
| Pathway ID | Tissue | Disease Stage | Description | Gene Ratio | Bg Ratio | pvalue | p.adjust | qvalue | Count |
| hsa0517029 | Esophagus | HGIN | Human immunodeficiency virus 1 infection | 51/1383 | 212/8465 | 2.16e-03 | 1.90e-02 | 1.51e-02 | 51 |
| hsa041426 | Esophagus | HGIN | Lysosome | 33/1383 | 132/8465 | 6.65e-03 | 4.37e-02 | 3.47e-02 | 33 |
| hsa05170112 | Esophagus | HGIN | Human immunodeficiency virus 1 infection | 51/1383 | 212/8465 | 2.16e-03 | 1.90e-02 | 1.51e-02 | 51 |
| hsa0414213 | Esophagus | HGIN | Lysosome | 33/1383 | 132/8465 | 6.65e-03 | 4.37e-02 | 3.47e-02 | 33 |
| hsa0414222 | Esophagus | ESCC | Lysosome | 102/4205 | 132/8465 | 5.11e-11 | 7.13e-10 | 3.65e-10 | 102 |
| hsa05170210 | Esophagus | ESCC | Human immunodeficiency virus 1 infection | 147/4205 | 212/8465 | 3.37e-09 | 3.53e-08 | 1.81e-08 | 147 |
| hsa0414232 | Esophagus | ESCC | Lysosome | 102/4205 | 132/8465 | 5.11e-11 | 7.13e-10 | 3.65e-10 | 102 |
| hsa0517038 | Esophagus | ESCC | Human immunodeficiency virus 1 infection | 147/4205 | 212/8465 | 3.37e-09 | 3.53e-08 | 1.81e-08 | 147 |
| hsa0517027 | Oral cavity | OSCC | Human immunodeficiency virus 1 infection | 133/3704 | 212/8465 | 1.42e-08 | 1.40e-07 | 7.12e-08 | 133 |
| hsa041425 | Oral cavity | OSCC | Lysosome | 87/3704 | 132/8465 | 1.97e-07 | 1.35e-06 | 6.86e-07 | 87 |
| hsa05170111 | Oral cavity | OSCC | Human immunodeficiency virus 1 infection | 133/3704 | 212/8465 | 1.42e-08 | 1.40e-07 | 7.12e-08 | 133 |
| hsa0414212 | Oral cavity | OSCC | Lysosome | 87/3704 | 132/8465 | 1.97e-07 | 1.35e-06 | 6.86e-07 | 87 |
| hsa0414221 | Oral cavity | LP | Lysosome | 67/2418 | 132/8465 | 5.13e-08 | 7.77e-07 | 5.01e-07 | 67 |
| hsa0517028 | Oral cavity | LP | Human immunodeficiency virus 1 infection | 92/2418 | 212/8465 | 2.18e-06 | 2.20e-05 | 1.42e-05 | 92 |
| hsa0414231 | Oral cavity | LP | Lysosome | 67/2418 | 132/8465 | 5.13e-08 | 7.77e-07 | 5.01e-07 | 67 |
| hsa0517037 | Oral cavity | LP | Human immunodeficiency virus 1 infection | 92/2418 | 212/8465 | 2.18e-06 | 2.20e-05 | 1.42e-05 | 92 |
| Page: 1 |
Top |
Cell-cell communication analysis |
| Identification of potential cell-cell interactions between two cell types and their ligand-receptor pairs for different disease states |
| Ligand | Receptor | LRpair | Pathway | Tissue | Disease Stage |
| Page: 1 |
Top |
Single-cell gene regulatory network inference analysis |
| Find out the significant the regulons (TFs) and the target genes of each regulon across cell types for different disease states |
| TF | Cell Type | Tissue | Disease Stage | Target Gene | RSS | Regulon Activity |
| ∗The dot plots of a searched regulon are shown for all cell subpopulations in each disease state of each tissue based on the regulon specific score inferred using pySCENIC and by calculating the average expression. |
| Page: 1 |
Top |
Somatic mutation of malignant transformation related genes |
| Annotation of somatic variants for genes involved in malignant transformation |
| Hugo Symbol | Variant Class | Variant Classification | dbSNP RS | HGVSc | HGVSp | HGVSp Short | SWISSPROT | BIOTYPE | SIFT | PolyPhen | Tumor Sample Barcode | Tissue | Histology | Sex | Age | Stage | Therapy Types | Drugs | Outcome |
| AP1G2 | SNV | Missense_Mutation | c.361G>A | p.Gly121Ser | p.G121S | O75843 | protein_coding | tolerated(0.19) | possibly_damaging(0.889) | TCGA-A2-A04Y-01 | Breast | breast invasive carcinoma | Female | <65 | I/II | Chemotherapy | cytoxan | SD | |
| AP1G2 | SNV | Missense_Mutation | novel | c.1976N>A | p.Cys659Tyr | p.C659Y | O75843 | protein_coding | tolerated(0.13) | benign(0.191) | TCGA-A2-A0ES-01 | Breast | breast invasive carcinoma | Female | <65 | I/II | Chemotherapy | docetaxel | SD |
| AP1G2 | SNV | Missense_Mutation | novel | c.381N>C | p.Leu127Phe | p.L127F | O75843 | protein_coding | tolerated(0.12) | probably_damaging(0.962) | TCGA-AC-A3BB-01 | Breast | breast invasive carcinoma | Female | <65 | III/IV | Chemotherapy | cytoxan | CR |
| AP1G2 | SNV | Missense_Mutation | rs138395869 | c.610N>A | p.Glu204Lys | p.E204K | O75843 | protein_coding | deleterious(0.05) | benign(0.062) | TCGA-AN-A0AK-01 | Breast | breast invasive carcinoma | Female | >=65 | I/II | Unknown | Unknown | SD |
| AP1G2 | SNV | Missense_Mutation | c.495G>A | p.Met165Ile | p.M165I | O75843 | protein_coding | tolerated(1) | benign(0.007) | TCGA-B6-A0IN-01 | Breast | breast invasive carcinoma | Female | <65 | I/II | Unknown | Unknown | PD | |
| AP1G2 | SNV | Missense_Mutation | c.2348N>T | p.Ser783Leu | p.S783L | O75843 | protein_coding | tolerated(0.35) | benign(0.058) | TCGA-E9-A1R6-01 | Breast | breast invasive carcinoma | Female | <65 | I/II | Hormone Therapy | tamoxiphen | SD | |
| AP1G2 | SNV | Missense_Mutation | c.1163N>A | p.Ala388Asp | p.A388D | O75843 | protein_coding | tolerated(0.2) | benign(0.005) | TCGA-EW-A1PH-01 | Breast | breast invasive carcinoma | Female | <65 | I/II | Chemotherapy | cyclophosphamide | SD | |
| AP1G2 | insertion | Frame_Shift_Ins | rs749982998 | c.1345_1346insG | p.Ala449GlyfsTer49 | p.A449Gfs*49 | O75843 | protein_coding | TCGA-A8-A097-01 | Breast | breast invasive carcinoma | Female | >=65 | I/II | Hormone Therapy | tamoxiphen | SD | ||
| AP1G2 | insertion | In_Frame_Ins | novel | c.994_995insGCCCAGCCCTCCCTACCC | p.Ser332delinsCysProAlaLeuProThrPro | p.S332delinsCPALPTP | O75843 | protein_coding | TCGA-A8-A0A4-01 | Breast | breast invasive carcinoma | Female | >=65 | I/II | Hormone Therapy | tamoxiphen | CR | ||
| AP1G2 | deletion | Frame_Shift_Del | novel | c.1241delN | p.Pro414GlnfsTer7 | p.P414Qfs*7 | O75843 | protein_coding | TCGA-D8-A27V-01 | Breast | breast invasive carcinoma | Female | <65 | I/II | Hormone Therapy | tamoxiphen | SD |
| Page: 1 2 3 4 5 6 7 8 |
Top |
Related drugs of malignant transformation related genes |
| Identification of chemicals and drugs interact with genes involved in malignant transfromation |
| (DGIdb 4.0) |
| Entrez ID | Symbol | Category | Interaction Types | Drug Claim Name | Drug Name | PMIDs |
| Page: 1 |

Copyright 2023-Present -The University of Texas Health Science Center at Houston |