
|
|||||
|
 | |
| |
| |
| |
| |
| |
|
Gene: AP1B1 |
Gene summary for AP1B1 |
| Gene information | Species | Human | Gene symbol | AP1B1 | Gene ID | 162 |
| Gene name | adaptor related protein complex 1 subunit beta 1 | |
| Gene Alias | ADTB1 | |
| Cytomap | 22q12.2 | |
| Gene Type | protein-coding | GO ID | GO:0001655 | UniProtAcc | Q10567 |
Top |
Malignant transformation analysis |
| Identification of the aberrant gene expression in precancerous and cancerous lesions by comparing the gene expression of stem-like cells in diseased tissues with normal stem cells |
| Entrez ID | Symbol | Replicates | Species | Organ | Tissue | Adj P-value | Log2FC | Malignancy |
| 162 | AP1B1 | HTA11_2487_2000001011 | Human | Colorectum | SER | 8.95e-05 | 5.38e-01 | -0.1808 |
| 162 | AP1B1 | HTA11_1938_2000001011 | Human | Colorectum | AD | 5.00e-03 | 3.01e-01 | -0.0811 |
| 162 | AP1B1 | HTA11_347_2000001011 | Human | Colorectum | AD | 1.72e-06 | 4.34e-01 | -0.1954 |
| 162 | AP1B1 | HTA11_411_2000001011 | Human | Colorectum | SER | 6.89e-04 | 9.73e-01 | -0.2602 |
| 162 | AP1B1 | HTA11_2112_2000001011 | Human | Colorectum | SER | 1.89e-03 | 7.94e-01 | -0.2196 |
| 162 | AP1B1 | HTA11_3361_2000001011 | Human | Colorectum | AD | 5.82e-03 | 4.25e-01 | -0.1207 |
| 162 | AP1B1 | HTA11_83_2000001011 | Human | Colorectum | SER | 9.98e-04 | 4.53e-01 | -0.1526 |
| 162 | AP1B1 | HTA11_696_2000001011 | Human | Colorectum | AD | 9.01e-15 | 6.79e-01 | -0.1464 |
| 162 | AP1B1 | HTA11_866_2000001011 | Human | Colorectum | AD | 6.36e-03 | 2.59e-01 | -0.1001 |
| 162 | AP1B1 | HTA11_1391_2000001011 | Human | Colorectum | AD | 1.34e-16 | 7.56e-01 | -0.059 |
| 162 | AP1B1 | HTA11_5212_2000001011 | Human | Colorectum | AD | 3.53e-02 | 4.54e-01 | -0.2061 |
| 162 | AP1B1 | HTA11_5216_2000001011 | Human | Colorectum | SER | 7.01e-03 | 6.12e-01 | -0.1462 |
| 162 | AP1B1 | HTA11_7696_3000711011 | Human | Colorectum | AD | 3.00e-04 | 3.55e-01 | 0.0674 |
| 162 | AP1B1 | HTA11_99999970781_79442 | Human | Colorectum | MSS | 3.85e-02 | 2.66e-01 | 0.294 |
| 162 | AP1B1 | HTA11_99999971662_82457 | Human | Colorectum | MSS | 6.09e-12 | 7.11e-01 | 0.3859 |
| 162 | AP1B1 | A002-C-010 | Human | Colorectum | FAP | 1.23e-03 | -1.09e-01 | 0.242 |
| 162 | AP1B1 | A015-C-203 | Human | Colorectum | FAP | 1.17e-03 | -1.09e-01 | -0.1294 |
| 162 | AP1B1 | A002-C-205 | Human | Colorectum | FAP | 1.76e-03 | -1.59e-01 | -0.1236 |
| 162 | AP1B1 | A015-C-006 | Human | Colorectum | FAP | 2.82e-02 | -1.77e-01 | -0.0994 |
| 162 | AP1B1 | A002-C-114 | Human | Colorectum | FAP | 4.13e-03 | -1.58e-01 | -0.1561 |
| Page: 1 2 3 4 5 6 7 8 |
| Tissue | Expression Dynamics | Abbreviation |
| Colorectum (GSE201348) |  | FAP: Familial adenomatous polyposis |
| CRC: Colorectal cancer | ||
| Colorectum (HTA11) |  | AD: Adenomas |
| SER: Sessile serrated lesions | ||
| MSI-H: Microsatellite-high colorectal cancer | ||
| MSS: Microsatellite stable colorectal cancer | ||
| Esophagus | 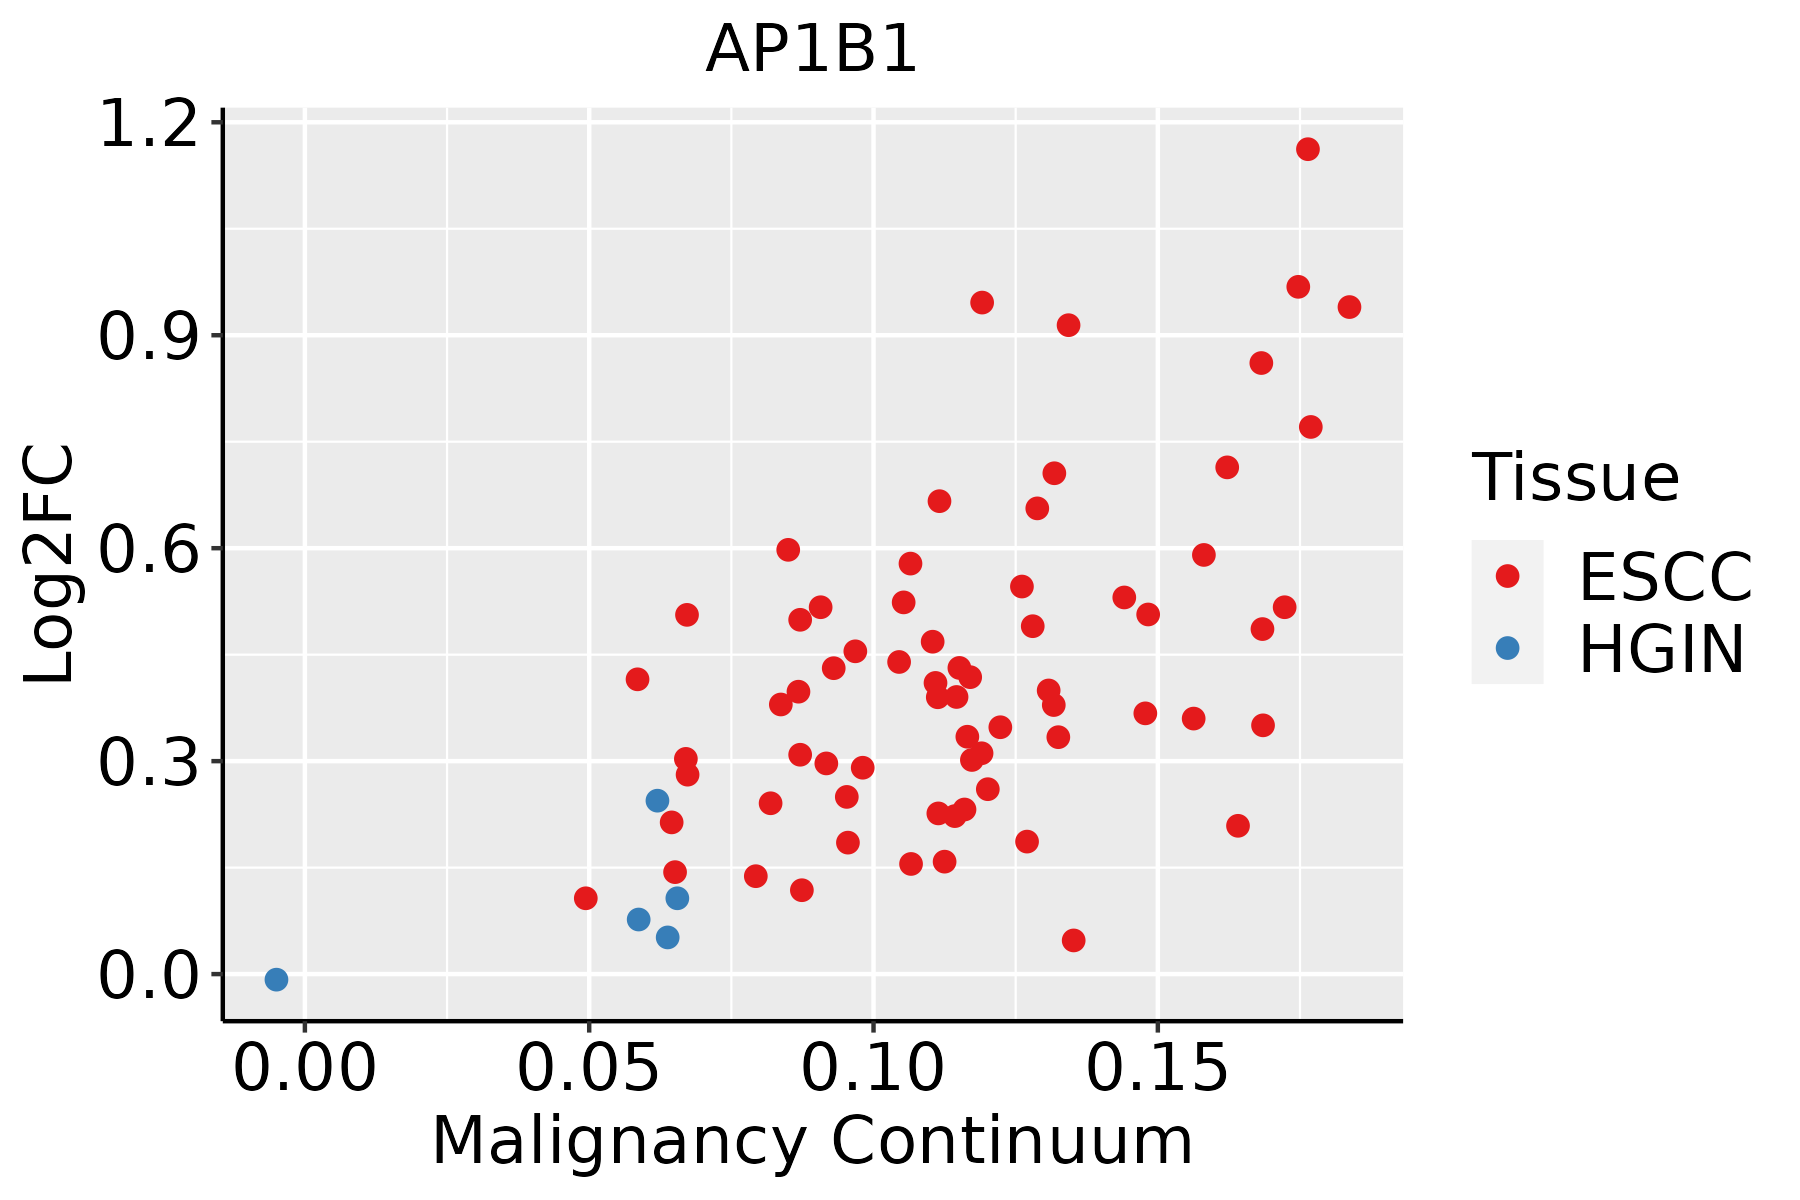 | ESCC: Esophageal squamous cell carcinoma |
| HGIN: High-grade intraepithelial neoplasias | ||
| LGIN: Low-grade intraepithelial neoplasias | ||
| Liver | 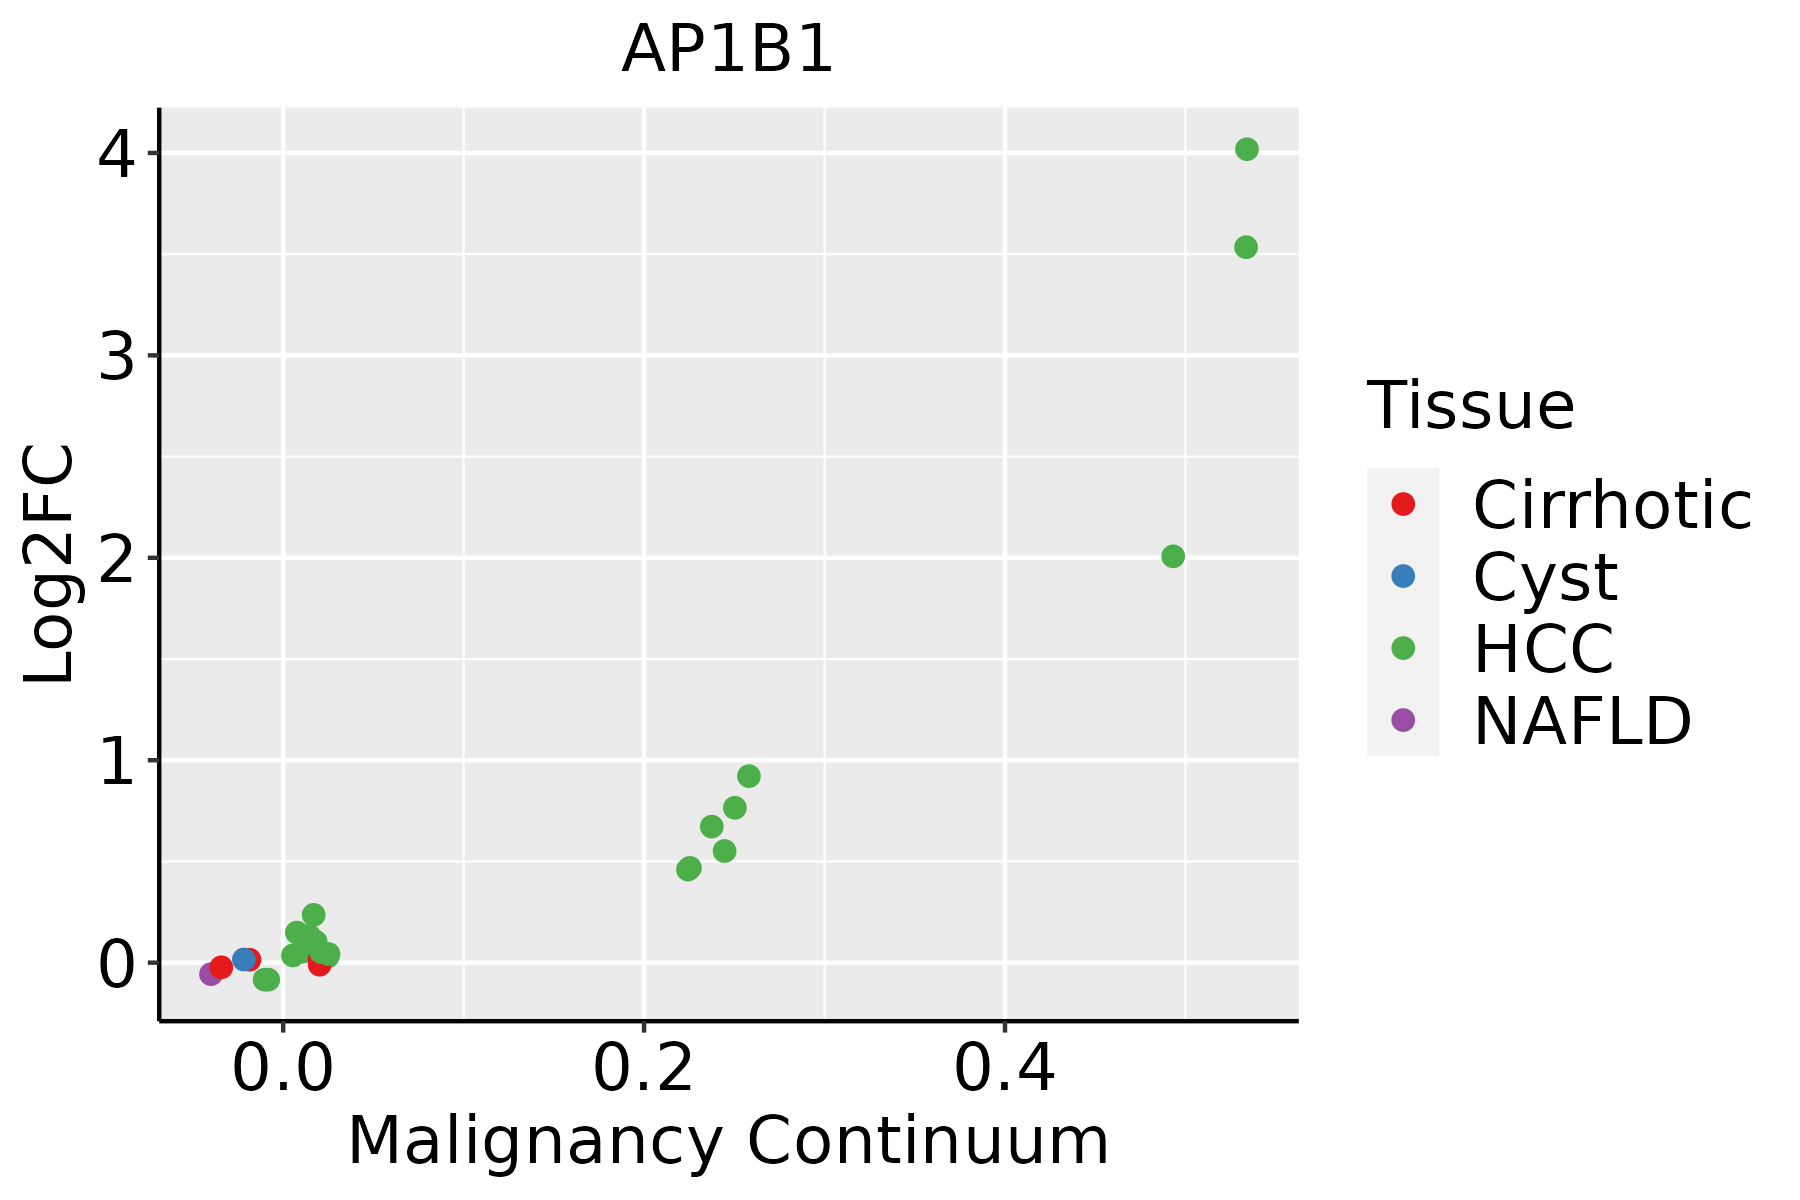 | HCC: Hepatocellular carcinoma |
| NAFLD: Non-alcoholic fatty liver disease | ||
| Oral Cavity |  | EOLP: Erosive Oral lichen planus |
| LP: leukoplakia | ||
| NEOLP: Non-erosive oral lichen planus | ||
| OSCC: Oral squamous cell carcinoma | ||
| Skin | 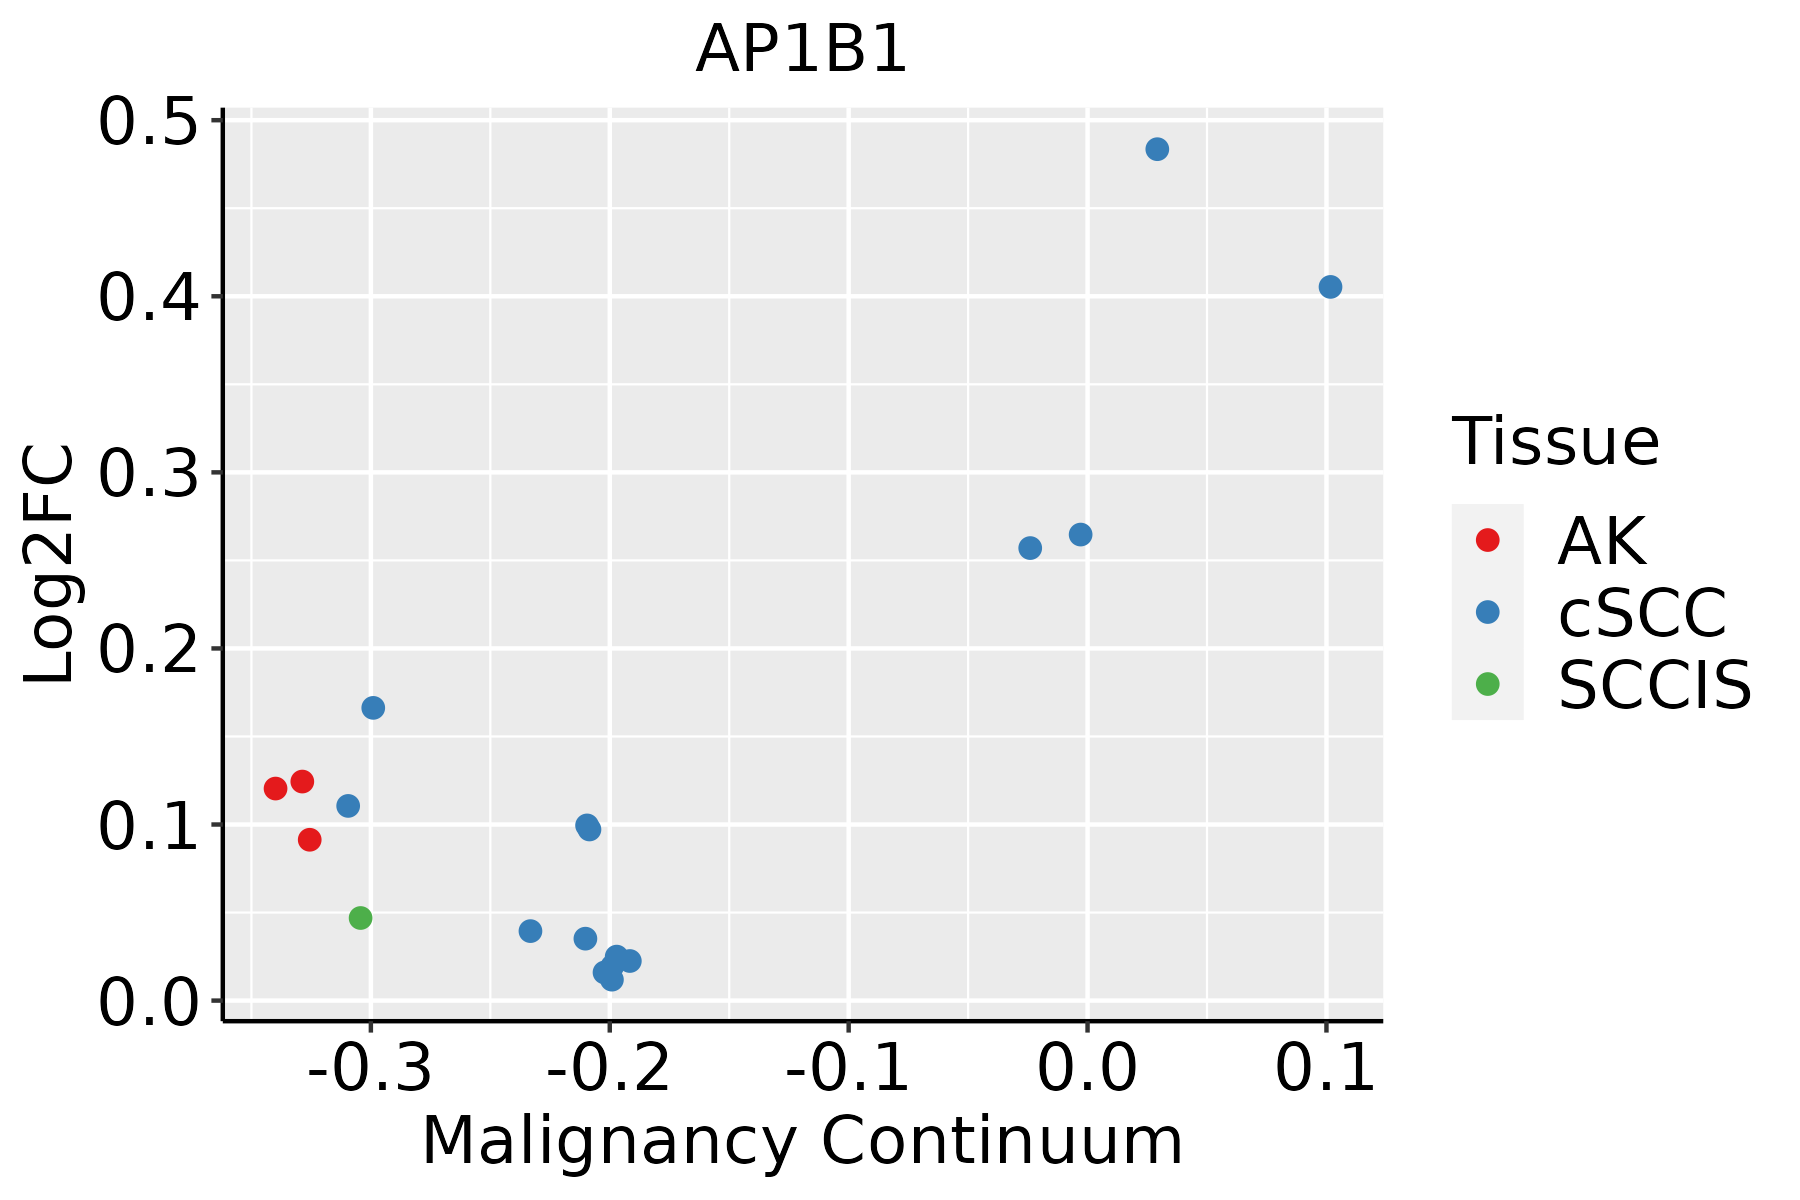 | AK: Actinic keratosis |
| cSCC: Cutaneous squamous cell carcinoma | ||
| SCCIS:squamous cell carcinoma in situ | ||
| Thyroid |  | ATC: Anaplastic thyroid cancer |
| HT: Hashimoto's thyroiditis | ||
| PTC: Papillary thyroid cancer |
| ∗log2FC in expression of this searched gene in stem-like cells from each diseased tissue sample relative to stem-like cells in normal samples in each tissue plotted against the malignancy continuum. Samples are colored based on if they are from different disease stage. |
Top |
Malignant transformation related pathway analysis |
| Find out the enriched GO biological processes and KEGG pathways involved in transition from healthy to precancer to cancer |
| Tissue | Disease Stage | Enriched GO biological Processes |
| Colorectum | AD |  |
| Colorectum | SER |  |
| Colorectum | MSS |  |
| Colorectum | MSI-H |  |
| Colorectum | FAP |  |
| ∗Top 15 enriched GO BP terms are showed in the bar plot of each disease state in each tissue. Each row represents a significant GO biological process which is colored according to the -log10(p.adjust). |
| Page: 1 2 3 4 5 6 7 8 9 |
| GO ID | Tissue | Disease Stage | Description | Gene Ratio | Bg Ratio | pvalue | p.adjust | Count |
| GO:0001655 | Colorectum | MSS | urogenital system development | 81/3467 | 338/18723 | 6.88e-03 | 4.43e-02 | 81 |
| GO:00016551 | Colorectum | FAP | urogenital system development | 70/2622 | 338/18723 | 4.26e-04 | 5.11e-03 | 70 |
| GO:0072001 | Colorectum | FAP | renal system development | 63/2622 | 302/18723 | 6.59e-04 | 7.19e-03 | 63 |
| GO:0001822 | Colorectum | FAP | kidney development | 61/2622 | 293/18723 | 8.38e-04 | 8.72e-03 | 61 |
| GO:00016559 | Esophagus | ESCC | urogenital system development | 177/8552 | 338/18723 | 7.51e-03 | 2.69e-02 | 177 |
| GO:00016553 | Liver | HCC | urogenital system development | 170/7958 | 338/18723 | 2.15e-03 | 1.08e-02 | 170 |
| GO:00018222 | Liver | HCC | kidney development | 148/7958 | 293/18723 | 3.25e-03 | 1.49e-02 | 148 |
| GO:00720012 | Liver | HCC | renal system development | 152/7958 | 302/18723 | 3.45e-03 | 1.56e-02 | 152 |
| GO:00016558 | Oral cavity | OSCC | urogenital system development | 160/7305 | 338/18723 | 1.03e-03 | 5.31e-03 | 160 |
| GO:000165510 | Skin | AK | urogenital system development | 54/1910 | 338/18723 | 5.86e-04 | 5.20e-03 | 54 |
| GO:00018227 | Skin | AK | kidney development | 45/1910 | 293/18723 | 3.50e-03 | 2.12e-02 | 45 |
| GO:00720018 | Skin | AK | renal system development | 45/1910 | 302/18723 | 6.14e-03 | 3.31e-02 | 45 |
| GO:000182215 | Thyroid | PTC | kidney development | 133/5968 | 293/18723 | 7.57e-07 | 1.18e-05 | 133 |
| GO:000165517 | Thyroid | PTC | urogenital system development | 149/5968 | 338/18723 | 1.41e-06 | 2.01e-05 | 149 |
| GO:007200114 | Thyroid | PTC | renal system development | 135/5968 | 302/18723 | 1.76e-06 | 2.43e-05 | 135 |
| GO:000182222 | Thyroid | ATC | kidney development | 146/6293 | 293/18723 | 5.81e-09 | 1.28e-07 | 146 |
| GO:000165522 | Thyroid | ATC | urogenital system development | 164/6293 | 338/18723 | 7.92e-09 | 1.70e-07 | 164 |
| GO:007200122 | Thyroid | ATC | renal system development | 149/6293 | 302/18723 | 9.48e-09 | 1.99e-07 | 149 |
| Page: 1 |
| Pathway ID | Tissue | Disease Stage | Description | Gene Ratio | Bg Ratio | pvalue | p.adjust | qvalue | Count |
| hsa05170 | Colorectum | AD | Human immunodeficiency virus 1 infection | 72/2092 | 212/8465 | 1.40e-03 | 8.46e-03 | 5.39e-03 | 72 |
| hsa051701 | Colorectum | AD | Human immunodeficiency virus 1 infection | 72/2092 | 212/8465 | 1.40e-03 | 8.46e-03 | 5.39e-03 | 72 |
| hsa051702 | Colorectum | SER | Human immunodeficiency virus 1 infection | 58/1580 | 212/8465 | 1.08e-03 | 8.56e-03 | 6.21e-03 | 58 |
| hsa051703 | Colorectum | SER | Human immunodeficiency virus 1 infection | 58/1580 | 212/8465 | 1.08e-03 | 8.56e-03 | 6.21e-03 | 58 |
| hsa051704 | Colorectum | MSS | Human immunodeficiency virus 1 infection | 69/1875 | 212/8465 | 2.66e-04 | 1.98e-03 | 1.21e-03 | 69 |
| hsa051705 | Colorectum | MSS | Human immunodeficiency virus 1 infection | 69/1875 | 212/8465 | 2.66e-04 | 1.98e-03 | 1.21e-03 | 69 |
| hsa051706 | Colorectum | FAP | Human immunodeficiency virus 1 infection | 51/1404 | 212/8465 | 2.98e-03 | 1.29e-02 | 7.87e-03 | 51 |
| hsa051707 | Colorectum | FAP | Human immunodeficiency virus 1 infection | 51/1404 | 212/8465 | 2.98e-03 | 1.29e-02 | 7.87e-03 | 51 |
| hsa0517029 | Esophagus | HGIN | Human immunodeficiency virus 1 infection | 51/1383 | 212/8465 | 2.16e-03 | 1.90e-02 | 1.51e-02 | 51 |
| hsa041426 | Esophagus | HGIN | Lysosome | 33/1383 | 132/8465 | 6.65e-03 | 4.37e-02 | 3.47e-02 | 33 |
| hsa05170112 | Esophagus | HGIN | Human immunodeficiency virus 1 infection | 51/1383 | 212/8465 | 2.16e-03 | 1.90e-02 | 1.51e-02 | 51 |
| hsa0414213 | Esophagus | HGIN | Lysosome | 33/1383 | 132/8465 | 6.65e-03 | 4.37e-02 | 3.47e-02 | 33 |
| hsa05170210 | Esophagus | ESCC | Human immunodeficiency virus 1 infection | 147/4205 | 212/8465 | 3.37e-09 | 3.53e-08 | 1.81e-08 | 147 |
| hsa0517038 | Esophagus | ESCC | Human immunodeficiency virus 1 infection | 147/4205 | 212/8465 | 3.37e-09 | 3.53e-08 | 1.81e-08 | 147 |
| hsa041422 | Liver | HCC | Lysosome | 100/4020 | 132/8465 | 2.32e-11 | 4.31e-10 | 2.40e-10 | 100 |
| hsa051709 | Liver | HCC | Human immunodeficiency virus 1 infection | 125/4020 | 212/8465 | 4.51e-04 | 1.94e-03 | 1.08e-03 | 125 |
| hsa041423 | Liver | HCC | Lysosome | 100/4020 | 132/8465 | 2.32e-11 | 4.31e-10 | 2.40e-10 | 100 |
| hsa0517012 | Liver | HCC | Human immunodeficiency virus 1 infection | 125/4020 | 212/8465 | 4.51e-04 | 1.94e-03 | 1.08e-03 | 125 |
| hsa0517027 | Oral cavity | OSCC | Human immunodeficiency virus 1 infection | 133/3704 | 212/8465 | 1.42e-08 | 1.40e-07 | 7.12e-08 | 133 |
| hsa041425 | Oral cavity | OSCC | Lysosome | 87/3704 | 132/8465 | 1.97e-07 | 1.35e-06 | 6.86e-07 | 87 |
| Page: 1 2 |
Top |
Cell-cell communication analysis |
| Identification of potential cell-cell interactions between two cell types and their ligand-receptor pairs for different disease states |
| Ligand | Receptor | LRpair | Pathway | Tissue | Disease Stage |
| Page: 1 |
Top |
Single-cell gene regulatory network inference analysis |
| Find out the significant the regulons (TFs) and the target genes of each regulon across cell types for different disease states |
| TF | Cell Type | Tissue | Disease Stage | Target Gene | RSS | Regulon Activity |
| ∗The dot plots of a searched regulon are shown for all cell subpopulations in each disease state of each tissue based on the regulon specific score inferred using pySCENIC and by calculating the average expression. |
| Page: 1 |
Top |
Somatic mutation of malignant transformation related genes |
| Annotation of somatic variants for genes involved in malignant transformation |
| Hugo Symbol | Variant Class | Variant Classification | dbSNP RS | HGVSc | HGVSp | HGVSp Short | SWISSPROT | BIOTYPE | SIFT | PolyPhen | Tumor Sample Barcode | Tissue | Histology | Sex | Age | Stage | Therapy Types | Drugs | Outcome |
| AP1B1 | SNV | Missense_Mutation | rs202101776 | c.2125N>A | p.Val709Met | p.V709M | Q10567 | protein_coding | tolerated(0.19) | benign(0.36) | TCGA-A7-A6VV-01 | Breast | breast invasive carcinoma | Female | <65 | I/II | Chemotherapy | cyclophosphamide | CR |
| AP1B1 | SNV | Missense_Mutation | c.2480N>T | p.Thr827Ile | p.T827I | Q10567 | protein_coding | tolerated(0.23) | benign(0.005) | TCGA-A8-A08B-01 | Breast | breast invasive carcinoma | Female | <65 | I/II | Chemotherapy | 5-fluorouracil | CR | |
| AP1B1 | SNV | Missense_Mutation | c.2637C>G | p.Ser879Arg | p.S879R | Q10567 | protein_coding | tolerated(0.53) | benign(0.054) | TCGA-A8-A097-01 | Breast | breast invasive carcinoma | Female | >=65 | I/II | Hormone Therapy | tamoxiphen | SD | |
| AP1B1 | SNV | Missense_Mutation | c.2449N>G | p.Lys817Glu | p.K817E | Q10567 | protein_coding | deleterious(0) | benign(0.003) | TCGA-A8-A09Z-01 | Breast | breast invasive carcinoma | Female | >=65 | I/II | Unknown | Unknown | SD | |
| AP1B1 | SNV | Missense_Mutation | c.2566G>A | p.Glu856Lys | p.E856K | Q10567 | protein_coding | tolerated(0.3) | benign(0.086) | TCGA-D8-A1Y1-01 | Breast | breast invasive carcinoma | Female | >=65 | III/IV | Hormone Therapy | tamoxiphen | PD | |
| AP1B1 | SNV | Missense_Mutation | rs757585860 | c.773N>G | p.Ser258Cys | p.S258C | Q10567 | protein_coding | deleterious(0) | probably_damaging(1) | TCGA-PE-A5DE-01 | Breast | breast invasive carcinoma | Female | <65 | I/II | Chemotherapy | taxotere | CR |
| AP1B1 | insertion | In_Frame_Ins | novel | c.205_206insCCTTTCTGAGAGCCTCAGTTTCATCATCTATAAAATGGG | p.Leu68_Val69insAlaPheLeuArgAlaSerValSerSerSerIleLysTrp | p.L68_V69insAFLRASVSSSIKW | Q10567 | protein_coding | TCGA-A8-A07R-01 | Breast | breast invasive carcinoma | Female | >=65 | III/IV | Ancillary | zoledronic | SD | ||
| AP1B1 | insertion | Frame_Shift_Ins | rs747283521 | c.388_389insATCTCACTGA | p.Leu130HisfsTer40 | p.L130Hfs*40 | Q10567 | protein_coding | TCGA-BH-A0H0-01 | Breast | breast invasive carcinoma | Female | >=65 | I/II | Hormone Therapy | arimidex | SD | ||
| AP1B1 | deletion | Frame_Shift_Del | novel | c.2469delN | p.Tyr824ThrfsTer77 | p.Y824Tfs*77 | Q10567 | protein_coding | TCGA-C8-A8HQ-01 | Breast | breast invasive carcinoma | Female | <65 | I/II | Unknown | Unknown | SD | ||
| AP1B1 | SNV | Missense_Mutation | novel | c.2237N>T | p.Ser746Phe | p.S746F | Q10567 | protein_coding | tolerated(0.74) | benign(0.003) | TCGA-C5-A1BQ-01 | Cervix | cervical & endocervical cancer | Female | >=65 | III/IV | Chemotherapy | cisplatin | CR |
| Page: 1 2 3 4 5 6 7 8 9 |
Top |
Related drugs of malignant transformation related genes |
| Identification of chemicals and drugs interact with genes involved in malignant transfromation |
| (DGIdb 4.0) |
| Entrez ID | Symbol | Category | Interaction Types | Drug Claim Name | Drug Name | PMIDs |
| Page: 1 |

Copyright 2023-Present -The University of Texas Health Science Center at Houston |