
|
|||||
|
 | |
| |
| |
| |
| |
| |
|
Gene: AOAH |
Gene summary for AOAH |
| Gene information | Species | Human | Gene symbol | AOAH | Gene ID | 313 |
| Gene name | acyloxyacyl hydrolase | |
| Gene Alias | AOAH | |
| Cytomap | 7p14.2 | |
| Gene Type | protein-coding | GO ID | GO:0000272 | UniProtAcc | A0A087WVT3 |
Top |
Malignant transformation analysis |
| Identification of the aberrant gene expression in precancerous and cancerous lesions by comparing the gene expression of stem-like cells in diseased tissues with normal stem cells |
| Entrez ID | Symbol | Replicates | Species | Organ | Tissue | Adj P-value | Log2FC | Malignancy |
| 313 | AOAH | HTA11_83_2000001011 | Human | Colorectum | SER | 1.24e-05 | 7.87e-01 | -0.1526 |
| 313 | AOAH | HTA11_1391_2000001011 | Human | Colorectum | AD | 1.87e-06 | 6.06e-01 | -0.059 |
| 313 | AOAH | HTA11_99999965104_69814 | Human | Colorectum | MSS | 1.98e-15 | 1.02e+00 | 0.281 |
| 313 | AOAH | HTA11_99999971662_82457 | Human | Colorectum | MSS | 6.29e-25 | 8.99e-01 | 0.3859 |
| 313 | AOAH | HTA11_99999973899_84307 | Human | Colorectum | MSS | 5.47e-29 | 1.60e+00 | 0.2585 |
| 313 | AOAH | HTA11_99999974143_84620 | Human | Colorectum | MSS | 6.52e-18 | 6.26e-01 | 0.3005 |
| 313 | AOAH | CRC-1-8810 | Human | Colorectum | CRC | 5.52e-14 | 5.78e-01 | 0.6257 |
| 313 | AOAH | CRC-3-11773 | Human | Colorectum | CRC | 1.13e-25 | 9.06e-01 | 0.2564 |
| Page: 1 |
| Tissue | Expression Dynamics | Abbreviation |
| Colorectum (GSE201348) | 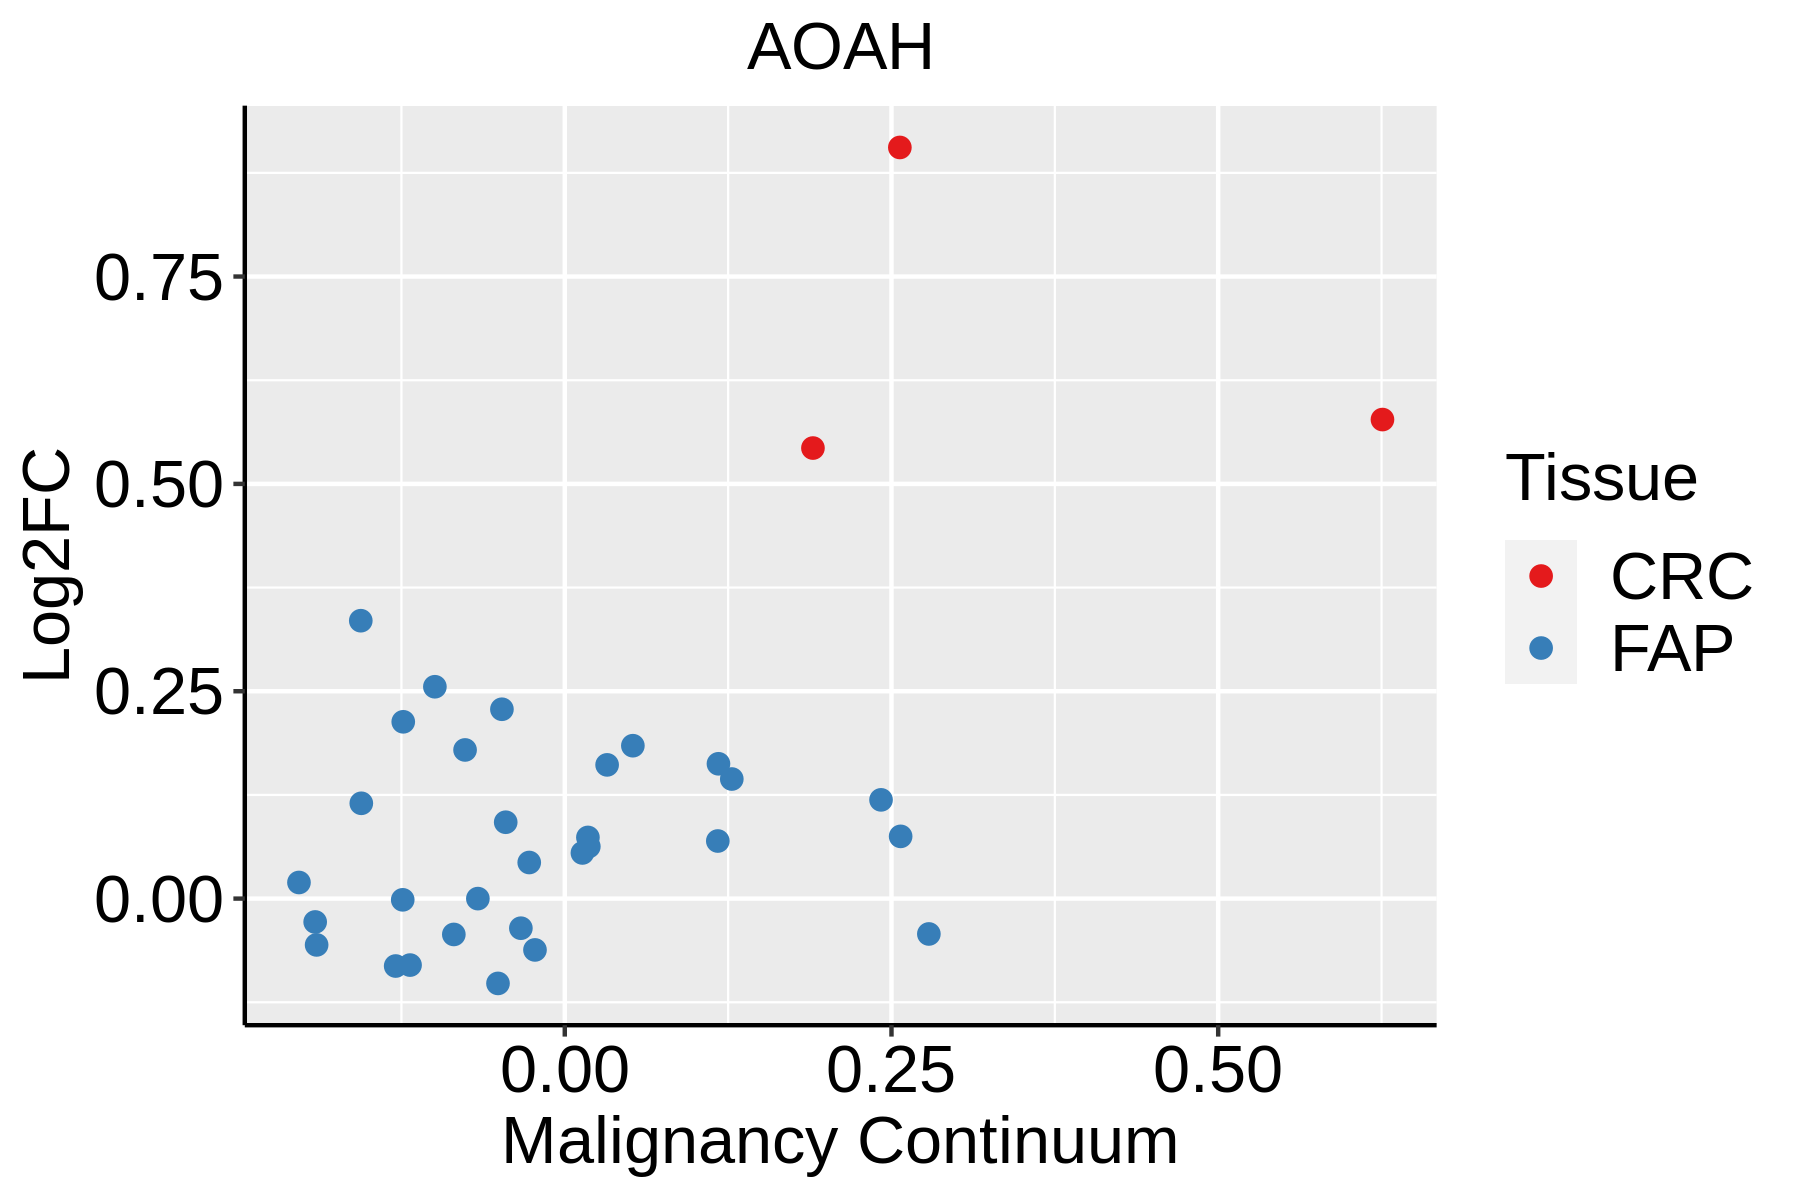 | FAP: Familial adenomatous polyposis |
| CRC: Colorectal cancer | ||
| Colorectum (HTA11) |  | AD: Adenomas |
| SER: Sessile serrated lesions | ||
| MSI-H: Microsatellite-high colorectal cancer | ||
| MSS: Microsatellite stable colorectal cancer |
| ∗log2FC in expression of this searched gene in stem-like cells from each diseased tissue sample relative to stem-like cells in normal samples in each tissue plotted against the malignancy continuum. Samples are colored based on if they are from different disease stage. |
Top |
Malignant transformation related pathway analysis |
| Find out the enriched GO biological processes and KEGG pathways involved in transition from healthy to precancer to cancer |
| Tissue | Disease Stage | Enriched GO biological Processes |
| Colorectum | AD |  |
| Colorectum | SER |  |
| Colorectum | MSS |  |
| Colorectum | MSI-H |  |
| Colorectum | FAP |  |
| ∗Top 15 enriched GO BP terms are showed in the bar plot of each disease state in each tissue. Each row represents a significant GO biological process which is colored according to the -log10(p.adjust). |
| Page: 1 2 3 4 5 6 7 8 9 |
| GO ID | Tissue | Disease Stage | Description | Gene Ratio | Bg Ratio | pvalue | p.adjust | Count |
| GO:0016052 | Colorectum | AD | carbohydrate catabolic process | 56/3918 | 154/18723 | 7.01e-06 | 1.73e-04 | 56 |
| GO:0016042 | Colorectum | AD | lipid catabolic process | 97/3918 | 320/18723 | 4.31e-05 | 7.56e-04 | 97 |
| GO:0006631 | Colorectum | AD | fatty acid metabolic process | 114/3918 | 390/18723 | 5.58e-05 | 9.44e-04 | 114 |
| GO:0044262 | Colorectum | AD | cellular carbohydrate metabolic process | 87/3918 | 283/18723 | 6.00e-05 | 1.01e-03 | 87 |
| GO:0044242 | Colorectum | AD | cellular lipid catabolic process | 66/3918 | 214/18723 | 3.96e-04 | 4.50e-03 | 66 |
| GO:00160421 | Colorectum | SER | lipid catabolic process | 77/2897 | 320/18723 | 3.52e-05 | 9.18e-04 | 77 |
| GO:00442421 | Colorectum | SER | cellular lipid catabolic process | 51/2897 | 214/18723 | 8.60e-04 | 1.05e-02 | 51 |
| GO:00160521 | Colorectum | SER | carbohydrate catabolic process | 38/2897 | 154/18723 | 1.92e-03 | 1.93e-02 | 38 |
| GO:00066311 | Colorectum | SER | fatty acid metabolic process | 79/2897 | 390/18723 | 6.34e-03 | 4.56e-02 | 79 |
| GO:00160522 | Colorectum | MSS | carbohydrate catabolic process | 45/3467 | 154/18723 | 7.93e-04 | 8.36e-03 | 45 |
| GO:00066312 | Colorectum | MSS | fatty acid metabolic process | 95/3467 | 390/18723 | 2.20e-03 | 1.84e-02 | 95 |
| GO:00160422 | Colorectum | MSS | lipid catabolic process | 77/3467 | 320/18723 | 7.43e-03 | 4.71e-02 | 77 |
| GO:00160524 | Colorectum | CRC | carbohydrate catabolic process | 34/2078 | 154/18723 | 6.37e-05 | 1.39e-03 | 34 |
| GO:00066314 | Colorectum | CRC | fatty acid metabolic process | 65/2078 | 390/18723 | 5.30e-04 | 7.42e-03 | 65 |
| GO:00442622 | Colorectum | CRC | cellular carbohydrate metabolic process | 49/2078 | 283/18723 | 1.06e-03 | 1.24e-02 | 49 |
| GO:00160424 | Colorectum | CRC | lipid catabolic process | 53/2078 | 320/18723 | 1.89e-03 | 1.93e-02 | 53 |
| GO:00442423 | Colorectum | CRC | cellular lipid catabolic process | 37/2078 | 214/18723 | 4.16e-03 | 3.40e-02 | 37 |
| Page: 1 |
| Pathway ID | Tissue | Disease Stage | Description | Gene Ratio | Bg Ratio | pvalue | p.adjust | qvalue | Count |
| Page: 1 |
Top |
Cell-cell communication analysis |
| Identification of potential cell-cell interactions between two cell types and their ligand-receptor pairs for different disease states |
| Ligand | Receptor | LRpair | Pathway | Tissue | Disease Stage |
| Page: 1 |
Top |
Single-cell gene regulatory network inference analysis |
| Find out the significant the regulons (TFs) and the target genes of each regulon across cell types for different disease states |
| TF | Cell Type | Tissue | Disease Stage | Target Gene | RSS | Regulon Activity |
| ∗The dot plots of a searched regulon are shown for all cell subpopulations in each disease state of each tissue based on the regulon specific score inferred using pySCENIC and by calculating the average expression. |
| Page: 1 |
Top |
Somatic mutation of malignant transformation related genes |
| Annotation of somatic variants for genes involved in malignant transformation |
| Hugo Symbol | Variant Class | Variant Classification | dbSNP RS | HGVSc | HGVSp | HGVSp Short | SWISSPROT | BIOTYPE | SIFT | PolyPhen | Tumor Sample Barcode | Tissue | Histology | Sex | Age | Stage | Therapy Types | Drugs | Outcome |
| AOAH | SNV | Missense_Mutation | novel | c.485N>C | p.Leu162Pro | p.L162P | protein_coding | deleterious(0.01) | probably_damaging(0.988) | TCGA-AR-A0TY-01 | Breast | breast invasive carcinoma | Female | <65 | I/II | Unspecific | Paclitaxel | PD | |
| AOAH | SNV | Missense_Mutation | c.885N>C | p.Glu295Asp | p.E295D | protein_coding | deleterious(0.03) | probably_damaging(0.978) | TCGA-BH-A0BL-01 | Breast | breast invasive carcinoma | Female | <65 | I/II | Chemotherapy | adriamycin | CR | ||
| AOAH | SNV | Missense_Mutation | novel | c.1910C>G | p.Pro637Arg | p.P637R | protein_coding | possibly_damaging(0.908) | TCGA-E2-A9RU-01 | Breast | breast invasive carcinoma | Female | >=65 | III/IV | Hormone Therapy | arimidex | SD | ||
| AOAH | SNV | Missense_Mutation | novel | c.128N>A | p.Gly43Glu | p.G43E | protein_coding | tolerated(0.09) | probably_damaging(0.984) | TCGA-LD-A9QF-01 | Breast | breast invasive carcinoma | Female | >=65 | I/II | Chemotherapy | taxol | SD | |
| AOAH | SNV | Missense_Mutation | novel | c.1144C>T | p.Pro382Ser | p.P382S | protein_coding | tolerated(0.23) | benign(0.272) | TCGA-PL-A8LV-01 | Breast | breast invasive carcinoma | Female | <65 | III/IV | Unknown | Unknown | SD | |
| AOAH | deletion | Nonsense_Mutation | novel | c.1701_1702delCG | p.Cys567Ter | p.C567* | protein_coding | TCGA-A2-A3XV-01 | Breast | breast invasive carcinoma | Female | <65 | I/II | Chemotherapy | carboplatin | CR | |||
| AOAH | SNV | Missense_Mutation | novel | c.501G>T | p.Lys167Asn | p.K167N | protein_coding | tolerated(0.21) | probably_damaging(0.948) | TCGA-2W-A8YY-01 | Cervix | cervical & endocervical cancer | Female | <65 | I/II | Chemotherapy | cisplatin | CR | |
| AOAH | SNV | Missense_Mutation | c.977N>C | p.Arg326Thr | p.R326T | protein_coding | deleterious(0) | possibly_damaging(0.811) | TCGA-DS-A0VM-01 | Cervix | cervical & endocervical cancer | Female | <65 | I/II | Chemotherapy | cisplatin | PD | ||
| AOAH | SNV | Missense_Mutation | c.977G>C | p.Arg326Thr | p.R326T | protein_coding | deleterious(0) | possibly_damaging(0.811) | TCGA-IR-A3LA-01 | Cervix | cervical & endocervical cancer | Female | <65 | I/II | Chemotherapy | cisplatin | CR | ||
| AOAH | SNV | Missense_Mutation | c.1258N>C | p.Asp420His | p.D420H | protein_coding | deleterious(0.01) | benign(0.132) | TCGA-IR-A3LK-01 | Cervix | cervical & endocervical cancer | Female | >=65 | I/II | Chemotherapy | cisplatin | PD |
| Page: 1 2 3 4 5 6 7 8 |
Top |
Related drugs of malignant transformation related genes |
| Identification of chemicals and drugs interact with genes involved in malignant transfromation |
| (DGIdb 4.0) |
| Entrez ID | Symbol | Category | Interaction Types | Drug Claim Name | Drug Name | PMIDs |
| 313 | AOAH | ENZYME, DRUGGABLE GENOME | inhibitor | 252166807 |
| Page: 1 |

Copyright 2023-Present -The University of Texas Health Science Center at Houston |