
|
|||||
|
 | |
| |
| |
| |
| |
| |
|
Gene: ANXA8 |
Gene summary for ANXA8 |
| Gene information | Species | Human | Gene symbol | ANXA8 | Gene ID | 653145 |
| Gene name | annexin A8 | |
| Gene Alias | ANX8 | |
| Cytomap | 10q11.22 | |
| Gene Type | protein-coding | GO ID | GO:0006508 | UniProtAcc | P13928 |
Top |
Malignant transformation analysis |
| Identification of the aberrant gene expression in precancerous and cancerous lesions by comparing the gene expression of stem-like cells in diseased tissues with normal stem cells |
| Entrez ID | Symbol | Replicates | Species | Organ | Tissue | Adj P-value | Log2FC | Malignancy |
| 653145 | ANXA8 | LZE4T | Human | Esophagus | ESCC | 1.55e-10 | 3.18e-01 | 0.0811 |
| 653145 | ANXA8 | LZE8T | Human | Esophagus | ESCC | 2.99e-27 | 8.93e-01 | 0.067 |
| 653145 | ANXA8 | LZE20T | Human | Esophagus | ESCC | 4.98e-02 | 9.90e-02 | 0.0662 |
| 653145 | ANXA8 | LZE22D1 | Human | Esophagus | HGIN | 1.24e-04 | 2.29e-01 | 0.0595 |
| 653145 | ANXA8 | LZE22T | Human | Esophagus | ESCC | 1.54e-04 | 3.27e-01 | 0.068 |
| 653145 | ANXA8 | LZE24T | Human | Esophagus | ESCC | 1.46e-02 | 1.12e-01 | 0.0596 |
| 653145 | ANXA8 | LZE21T | Human | Esophagus | ESCC | 1.16e-05 | 4.81e-01 | 0.0655 |
| 653145 | ANXA8 | LZE6T | Human | Esophagus | ESCC | 1.55e-08 | 3.88e-01 | 0.0845 |
| 653145 | ANXA8 | P1T-E | Human | Esophagus | ESCC | 4.62e-03 | 3.39e-01 | 0.0875 |
| 653145 | ANXA8 | P4T-E | Human | Esophagus | ESCC | 1.49e-09 | 2.58e-01 | 0.1323 |
| 653145 | ANXA8 | P5T-E | Human | Esophagus | ESCC | 4.05e-25 | 5.07e-01 | 0.1327 |
| 653145 | ANXA8 | P8T-E | Human | Esophagus | ESCC | 1.50e-19 | 4.43e-01 | 0.0889 |
| 653145 | ANXA8 | P9T-E | Human | Esophagus | ESCC | 4.01e-04 | 1.47e-01 | 0.1131 |
| 653145 | ANXA8 | P11T-E | Human | Esophagus | ESCC | 2.64e-31 | 1.70e+00 | 0.1426 |
| 653145 | ANXA8 | P15T-E | Human | Esophagus | ESCC | 4.72e-09 | 3.12e-01 | 0.1149 |
| 653145 | ANXA8 | P17T-E | Human | Esophagus | ESCC | 3.47e-14 | 7.06e-01 | 0.1278 |
| 653145 | ANXA8 | P19T-E | Human | Esophagus | ESCC | 2.95e-08 | 8.48e-01 | 0.1662 |
| 653145 | ANXA8 | P20T-E | Human | Esophagus | ESCC | 2.17e-39 | 7.80e-01 | 0.1124 |
| 653145 | ANXA8 | P21T-E | Human | Esophagus | ESCC | 1.44e-78 | 1.87e+00 | 0.1617 |
| 653145 | ANXA8 | P22T-E | Human | Esophagus | ESCC | 1.32e-06 | 2.05e-01 | 0.1236 |
| Page: 1 2 3 4 |
| Tissue | Expression Dynamics | Abbreviation |
| Esophagus | 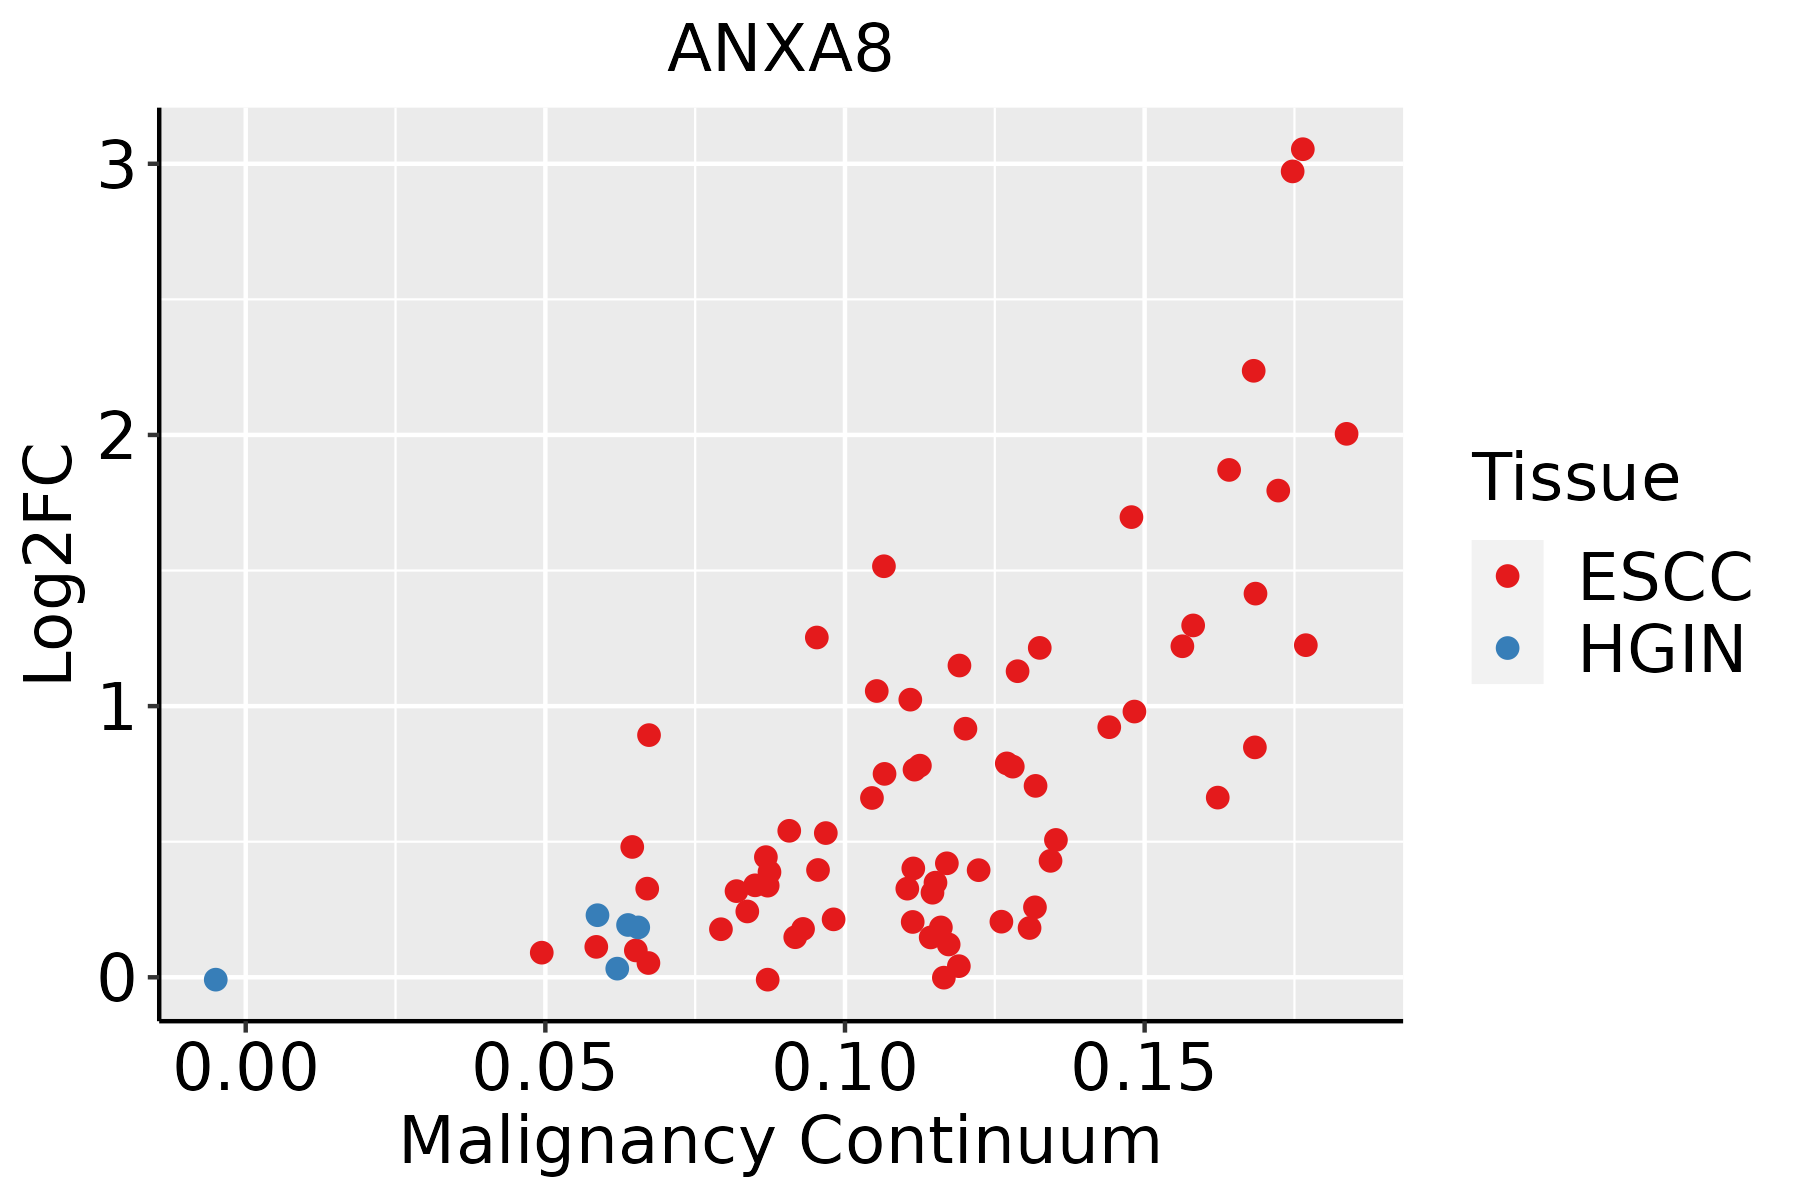 | ESCC: Esophageal squamous cell carcinoma |
| HGIN: High-grade intraepithelial neoplasias | ||
| LGIN: Low-grade intraepithelial neoplasias | ||
| Oral Cavity | 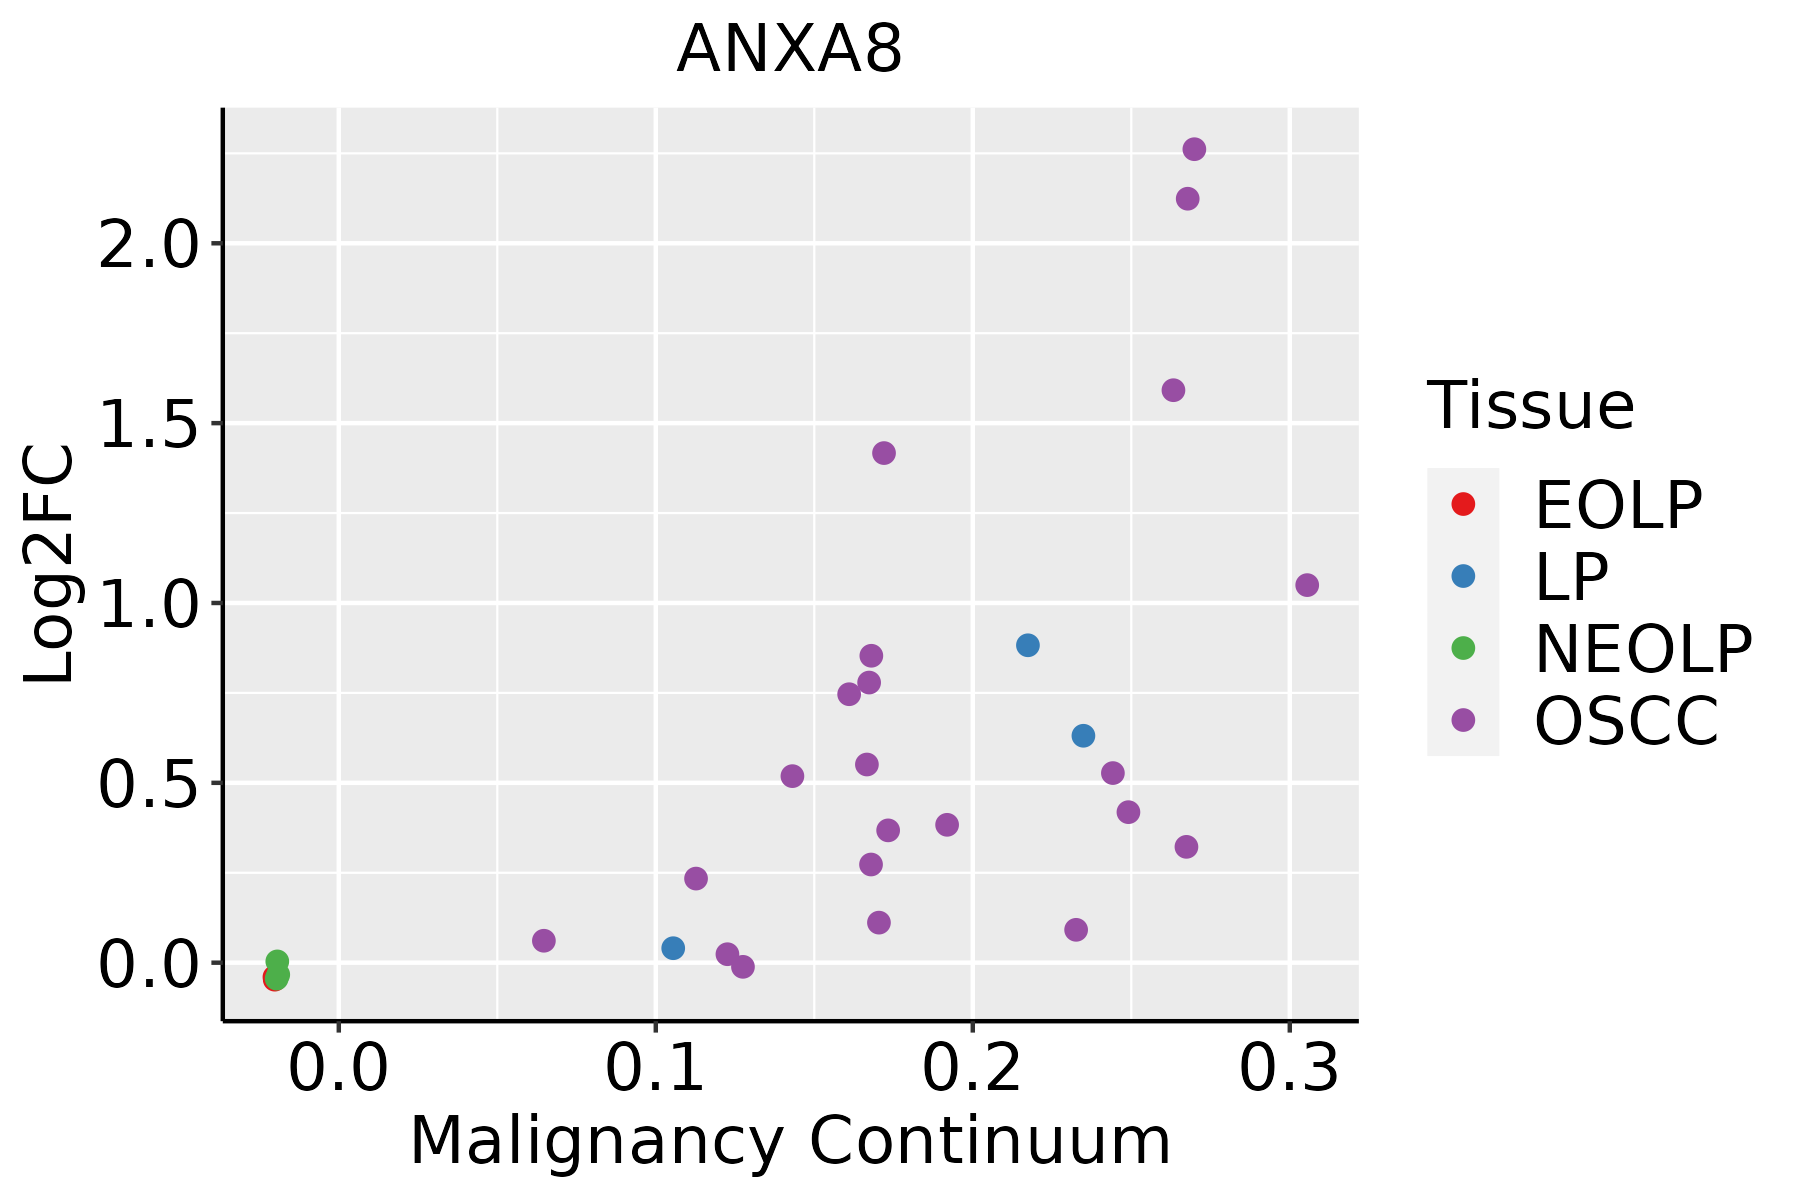 | EOLP: Erosive Oral lichen planus |
| LP: leukoplakia | ||
| NEOLP: Non-erosive oral lichen planus | ||
| OSCC: Oral squamous cell carcinoma |
| ∗log2FC in expression of this searched gene in stem-like cells from each diseased tissue sample relative to stem-like cells in normal samples in each tissue plotted against the malignancy continuum. Samples are colored based on if they are from different disease stage. |
Top |
Malignant transformation related pathway analysis |
| Find out the enriched GO biological processes and KEGG pathways involved in transition from healthy to precancer to cancer |
| Tissue | Disease Stage | Enriched GO biological Processes |
| Colorectum | AD |  |
| Colorectum | SER |  |
| Colorectum | MSS |  |
| Colorectum | MSI-H |  |
| Colorectum | FAP |  |
| ∗Top 15 enriched GO BP terms are showed in the bar plot of each disease state in each tissue. Each row represents a significant GO biological process which is colored according to the -log10(p.adjust). |
| Page: 1 2 3 4 5 6 7 8 9 |
| GO ID | Tissue | Disease Stage | Description | Gene Ratio | Bg Ratio | pvalue | p.adjust | Count |
| GO:005254726 | Esophagus | HGIN | regulation of peptidase activity | 102/2587 | 461/18723 | 6.29e-07 | 2.72e-05 | 102 |
| GO:005254826 | Esophagus | HGIN | regulation of endopeptidase activity | 96/2587 | 432/18723 | 1.09e-06 | 4.30e-05 | 96 |
| GO:001619710 | Esophagus | HGIN | endosomal transport | 57/2587 | 230/18723 | 5.74e-06 | 1.81e-04 | 57 |
| GO:00070328 | Esophagus | HGIN | endosome organization | 25/2587 | 82/18723 | 7.45e-05 | 1.69e-03 | 25 |
| GO:00160509 | Esophagus | HGIN | vesicle organization | 65/2587 | 300/18723 | 1.24e-04 | 2.54e-03 | 65 |
| GO:004586126 | Esophagus | HGIN | negative regulation of proteolysis | 68/2587 | 351/18723 | 2.21e-03 | 2.28e-02 | 68 |
| GO:005134620 | Esophagus | HGIN | negative regulation of hydrolase activity | 72/2587 | 379/18723 | 2.81e-03 | 2.75e-02 | 72 |
| GO:001605014 | Esophagus | ESCC | vesicle organization | 211/8552 | 300/18723 | 2.85e-18 | 2.87e-16 | 211 |
| GO:001619715 | Esophagus | ESCC | endosomal transport | 168/8552 | 230/18723 | 2.28e-17 | 1.93e-15 | 168 |
| GO:0052547111 | Esophagus | ESCC | regulation of peptidase activity | 275/8552 | 461/18723 | 7.54e-10 | 1.88e-08 | 275 |
| GO:0052548111 | Esophagus | ESCC | regulation of endopeptidase activity | 253/8552 | 432/18723 | 3.68e-08 | 6.78e-07 | 253 |
| GO:000703214 | Esophagus | ESCC | endosome organization | 61/8552 | 82/18723 | 1.13e-07 | 1.85e-06 | 61 |
| GO:004206027 | Esophagus | ESCC | wound healing | 243/8552 | 422/18723 | 4.62e-07 | 6.25e-06 | 243 |
| GO:0045861111 | Esophagus | ESCC | negative regulation of proteolysis | 195/8552 | 351/18723 | 1.13e-04 | 7.85e-04 | 195 |
| GO:0051346110 | Esophagus | ESCC | negative regulation of hydrolase activity | 208/8552 | 379/18723 | 1.76e-04 | 1.14e-03 | 208 |
| GO:001046620 | Esophagus | ESCC | negative regulation of peptidase activity | 140/8552 | 262/18723 | 6.73e-03 | 2.46e-02 | 140 |
| GO:001095119 | Esophagus | ESCC | negative regulation of endopeptidase activity | 135/8552 | 252/18723 | 6.86e-03 | 2.51e-02 | 135 |
| GO:00160508 | Oral cavity | OSCC | vesicle organization | 189/7305 | 300/18723 | 2.40e-17 | 2.14e-15 | 189 |
| GO:004206020 | Oral cavity | OSCC | wound healing | 237/7305 | 422/18723 | 4.51e-13 | 2.18e-11 | 237 |
| GO:005254720 | Oral cavity | OSCC | regulation of peptidase activity | 255/7305 | 461/18723 | 5.78e-13 | 2.75e-11 | 255 |
| Page: 1 2 |
| Pathway ID | Tissue | Disease Stage | Description | Gene Ratio | Bg Ratio | pvalue | p.adjust | qvalue | Count |
| Page: 1 |
Top |
Cell-cell communication analysis |
| Identification of potential cell-cell interactions between two cell types and their ligand-receptor pairs for different disease states |
| Ligand | Receptor | LRpair | Pathway | Tissue | Disease Stage |
| Page: 1 |
Top |
Single-cell gene regulatory network inference analysis |
| Find out the significant the regulons (TFs) and the target genes of each regulon across cell types for different disease states |
| TF | Cell Type | Tissue | Disease Stage | Target Gene | RSS | Regulon Activity |
| ∗The dot plots of a searched regulon are shown for all cell subpopulations in each disease state of each tissue based on the regulon specific score inferred using pySCENIC and by calculating the average expression. |
| Page: 1 |
Top |
Somatic mutation of malignant transformation related genes |
| Annotation of somatic variants for genes involved in malignant transformation |
| Hugo Symbol | Variant Class | Variant Classification | dbSNP RS | HGVSc | HGVSp | HGVSp Short | SWISSPROT | BIOTYPE | SIFT | PolyPhen | Tumor Sample Barcode | Tissue | Histology | Sex | Age | Stage | Therapy Types | Drugs | Outcome |
| ANXA8 | SNV | Missense_Mutation | novel | c.333N>T | p.Glu111Asp | p.E111D | protein_coding | tolerated(1) | benign(0.015) | TCGA-AN-A046-01 | Breast | breast invasive carcinoma | Female | >=65 | I/II | Unknown | Unknown | SD | |
| ANXA8 | SNV | Missense_Mutation | novel | c.548N>G | p.Glu183Gly | p.E183G | protein_coding | deleterious(0.02) | benign(0.073) | TCGA-C5-A8ZZ-01 | Cervix | cervical & endocervical cancer | Female | <65 | I/II | Unspecific | Cisplatin | SD | |
| ANXA8 | SNV | Missense_Mutation | novel | c.706G>A | p.Glu236Lys | p.E236K | protein_coding | deleterious(0) | benign(0.31) | TCGA-JW-A5VL-01 | Cervix | cervical & endocervical cancer | Female | <65 | I/II | Unknown | Unknown | SD | |
| ANXA8 | SNV | Missense_Mutation | novel | c.795N>A | p.Ser265Arg | p.S265R | protein_coding | deleterious(0) | probably_damaging(0.915) | TCGA-A6-2686-01 | Colorectum | colon adenocarcinoma | Female | >=65 | I/II | Unknown | Unknown | SD | |
| ANXA8 | SNV | Missense_Mutation | novel | c.736N>T | p.Arg246Cys | p.R246C | protein_coding | deleterious(0) | benign(0.171) | TCGA-A6-A565-01 | Colorectum | colon adenocarcinoma | Female | <65 | III/IV | Unspecific | 5FU | PD | |
| ANXA8 | SNV | Missense_Mutation | novel | c.694N>T | p.Arg232Cys | p.R232C | protein_coding | tolerated(0.13) | benign(0.003) | TCGA-AA-A010-01 | Colorectum | colon adenocarcinoma | Female | <65 | I/II | Chemotherapy | folinic | CR | |
| ANXA8 | SNV | Missense_Mutation | novel | c.736N>T | p.Arg246Cys | p.R246C | protein_coding | deleterious(0) | benign(0.171) | TCGA-AZ-6601-01 | Colorectum | colon adenocarcinoma | Male | >=65 | I/II | Unknown | Unknown | PD | |
| ANXA8 | SNV | Missense_Mutation | novel | c.547G>A | p.Glu183Lys | p.E183K | protein_coding | tolerated(0.51) | possibly_damaging(0.615) | TCGA-CK-4947-01 | Colorectum | colon adenocarcinoma | Female | <65 | III/IV | Other, specify in notes | folinic | SD | |
| ANXA8 | SNV | Missense_Mutation | novel | c.281G>A | p.Arg94Gln | p.R94Q | protein_coding | deleterious(0) | possibly_damaging(0.726) | TCGA-D5-6930-01 | Colorectum | colon adenocarcinoma | Male | >=65 | I/II | Unknown | Unknown | SD | |
| ANXA8 | SNV | Missense_Mutation | novel | c.1090N>A | p.Asp364Asn | p.D364N | protein_coding | tolerated(0.36) | benign(0.043) | TCGA-EI-6917-01 | Colorectum | rectum adenocarcinoma | Male | <65 | III/IV | Chemotherapy | 5fluorouracil+oxaciplatina+l-folinian | SD |
| Page: 1 2 3 4 |
Top |
Related drugs of malignant transformation related genes |
| Identification of chemicals and drugs interact with genes involved in malignant transfromation |
| (DGIdb 4.0) |
| Entrez ID | Symbol | Category | Interaction Types | Drug Claim Name | Drug Name | PMIDs |
| Page: 1 |

Copyright 2023-Present -The University of Texas Health Science Center at Houston |