
|
|||||
|
 | |
| |
| |
| |
| |
| |
|
Gene: ANXA7 |
Gene summary for ANXA7 |
| Gene information | Species | Human | Gene symbol | ANXA7 | Gene ID | 310 |
| Gene name | annexin A7 | |
| Gene Alias | ANX7 | |
| Cytomap | 10q22.2 | |
| Gene Type | protein-coding | GO ID | GO:0006914 | UniProtAcc | P20073 |
Top |
Malignant transformation analysis |
| Identification of the aberrant gene expression in precancerous and cancerous lesions by comparing the gene expression of stem-like cells in diseased tissues with normal stem cells |
| Entrez ID | Symbol | Replicates | Species | Organ | Tissue | Adj P-value | Log2FC | Malignancy |
| 310 | ANXA7 | LZE4T | Human | Esophagus | ESCC | 5.23e-16 | 7.87e-01 | 0.0811 |
| 310 | ANXA7 | LZE8T | Human | Esophagus | ESCC | 8.76e-14 | 5.33e-01 | 0.067 |
| 310 | ANXA7 | LZE20T | Human | Esophagus | ESCC | 8.30e-04 | 3.03e-01 | 0.0662 |
| 310 | ANXA7 | LZE22T | Human | Esophagus | ESCC | 4.92e-03 | 6.23e-01 | 0.068 |
| 310 | ANXA7 | LZE24T | Human | Esophagus | ESCC | 5.08e-28 | 1.18e+00 | 0.0596 |
| 310 | ANXA7 | LZE6T | Human | Esophagus | ESCC | 5.39e-05 | 6.56e-01 | 0.0845 |
| 310 | ANXA7 | P1T-E | Human | Esophagus | ESCC | 3.84e-03 | 6.71e-01 | 0.0875 |
| 310 | ANXA7 | P2T-E | Human | Esophagus | ESCC | 1.06e-57 | 1.07e+00 | 0.1177 |
| 310 | ANXA7 | P4T-E | Human | Esophagus | ESCC | 2.17e-44 | 1.31e+00 | 0.1323 |
| 310 | ANXA7 | P5T-E | Human | Esophagus | ESCC | 1.31e-31 | 9.20e-01 | 0.1327 |
| 310 | ANXA7 | P8T-E | Human | Esophagus | ESCC | 5.33e-36 | 8.35e-01 | 0.0889 |
| 310 | ANXA7 | P9T-E | Human | Esophagus | ESCC | 5.98e-17 | 5.64e-01 | 0.1131 |
| 310 | ANXA7 | P10T-E | Human | Esophagus | ESCC | 2.27e-23 | 3.11e-01 | 0.116 |
| 310 | ANXA7 | P11T-E | Human | Esophagus | ESCC | 5.57e-18 | 1.10e+00 | 0.1426 |
| 310 | ANXA7 | P12T-E | Human | Esophagus | ESCC | 2.05e-45 | 1.10e+00 | 0.1122 |
| 310 | ANXA7 | P15T-E | Human | Esophagus | ESCC | 5.45e-47 | 1.16e+00 | 0.1149 |
| 310 | ANXA7 | P16T-E | Human | Esophagus | ESCC | 1.69e-45 | 7.40e-01 | 0.1153 |
| 310 | ANXA7 | P17T-E | Human | Esophagus | ESCC | 1.05e-10 | 7.30e-01 | 0.1278 |
| 310 | ANXA7 | P19T-E | Human | Esophagus | ESCC | 3.77e-15 | 1.84e+00 | 0.1662 |
| 310 | ANXA7 | P20T-E | Human | Esophagus | ESCC | 6.18e-34 | 9.84e-01 | 0.1124 |
| Page: 1 2 3 4 5 6 7 |
| Tissue | Expression Dynamics | Abbreviation |
| Esophagus |  | ESCC: Esophageal squamous cell carcinoma |
| HGIN: High-grade intraepithelial neoplasias | ||
| LGIN: Low-grade intraepithelial neoplasias | ||
| Liver | 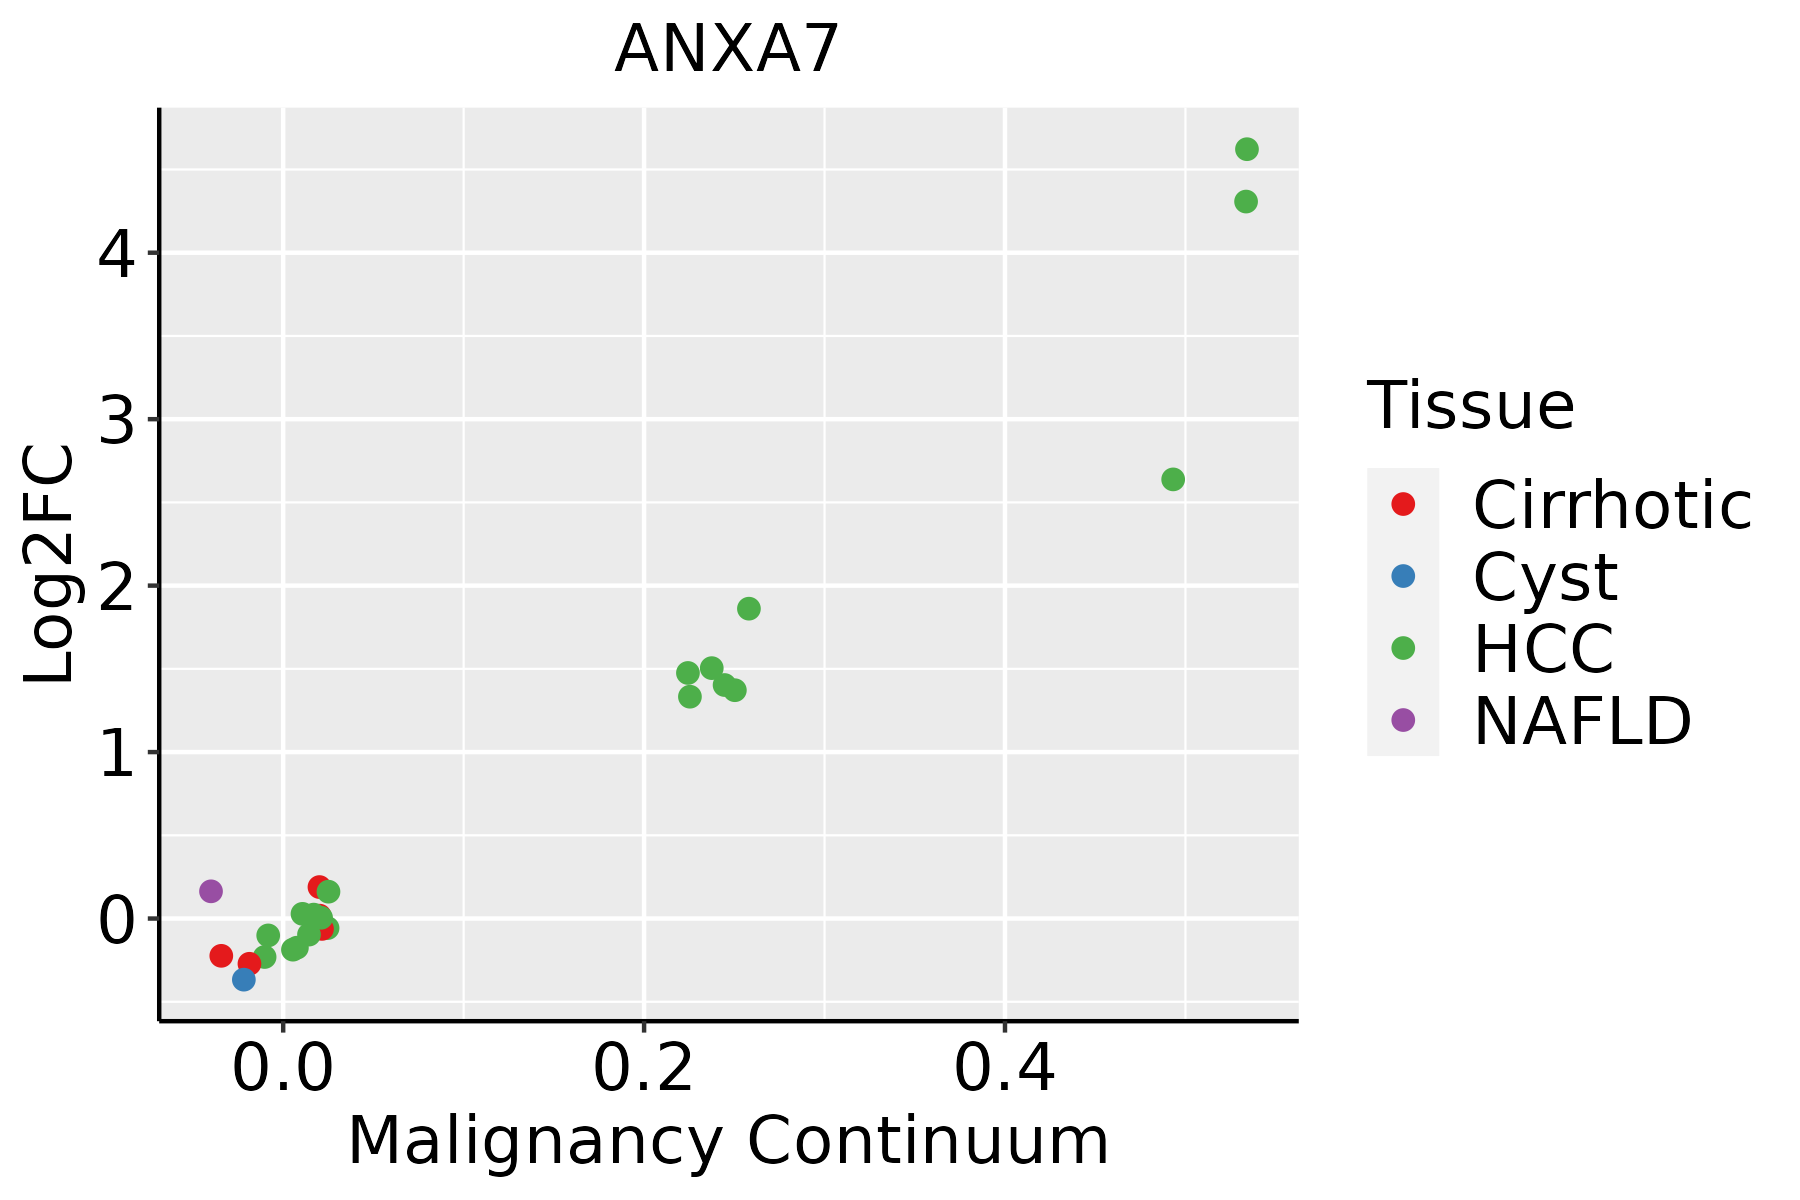 | HCC: Hepatocellular carcinoma |
| NAFLD: Non-alcoholic fatty liver disease | ||
| Oral Cavity | 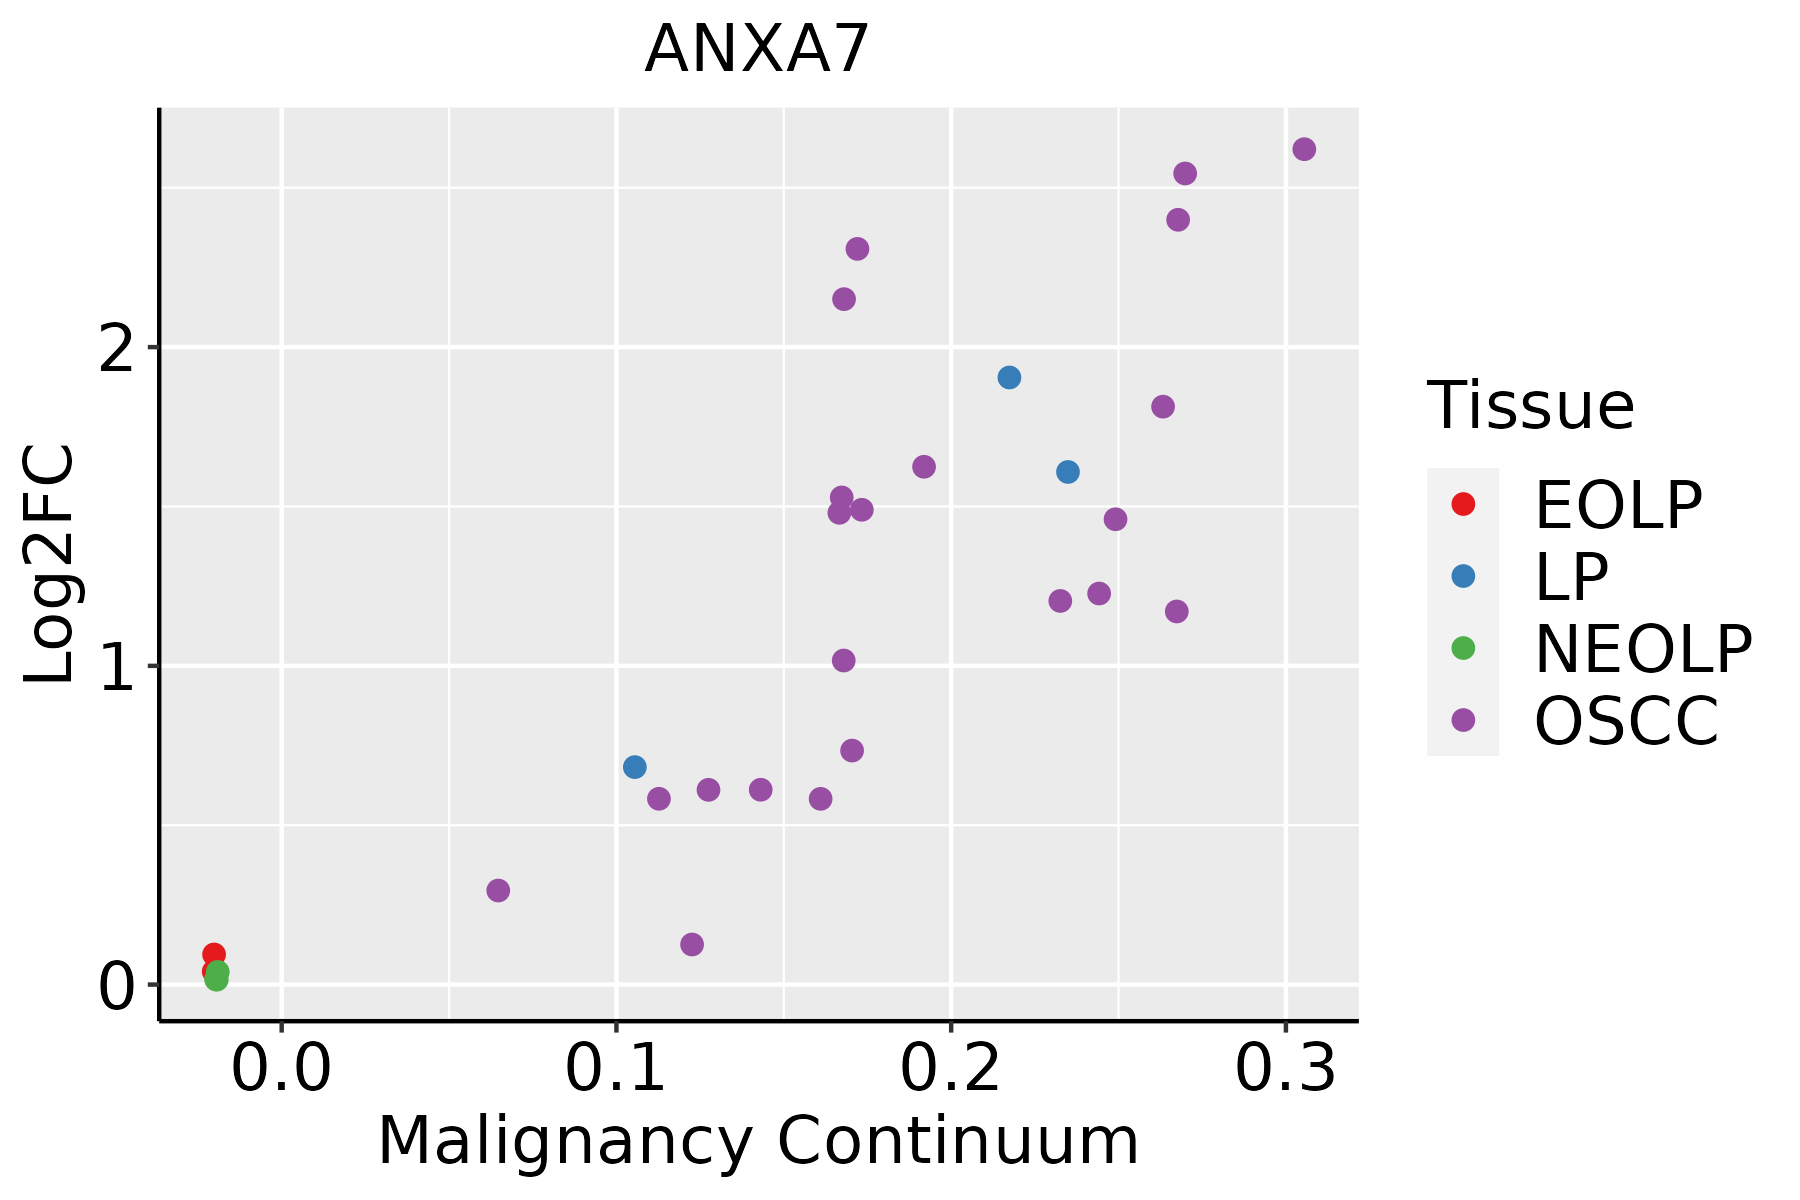 | EOLP: Erosive Oral lichen planus |
| LP: leukoplakia | ||
| NEOLP: Non-erosive oral lichen planus | ||
| OSCC: Oral squamous cell carcinoma | ||
| Skin | 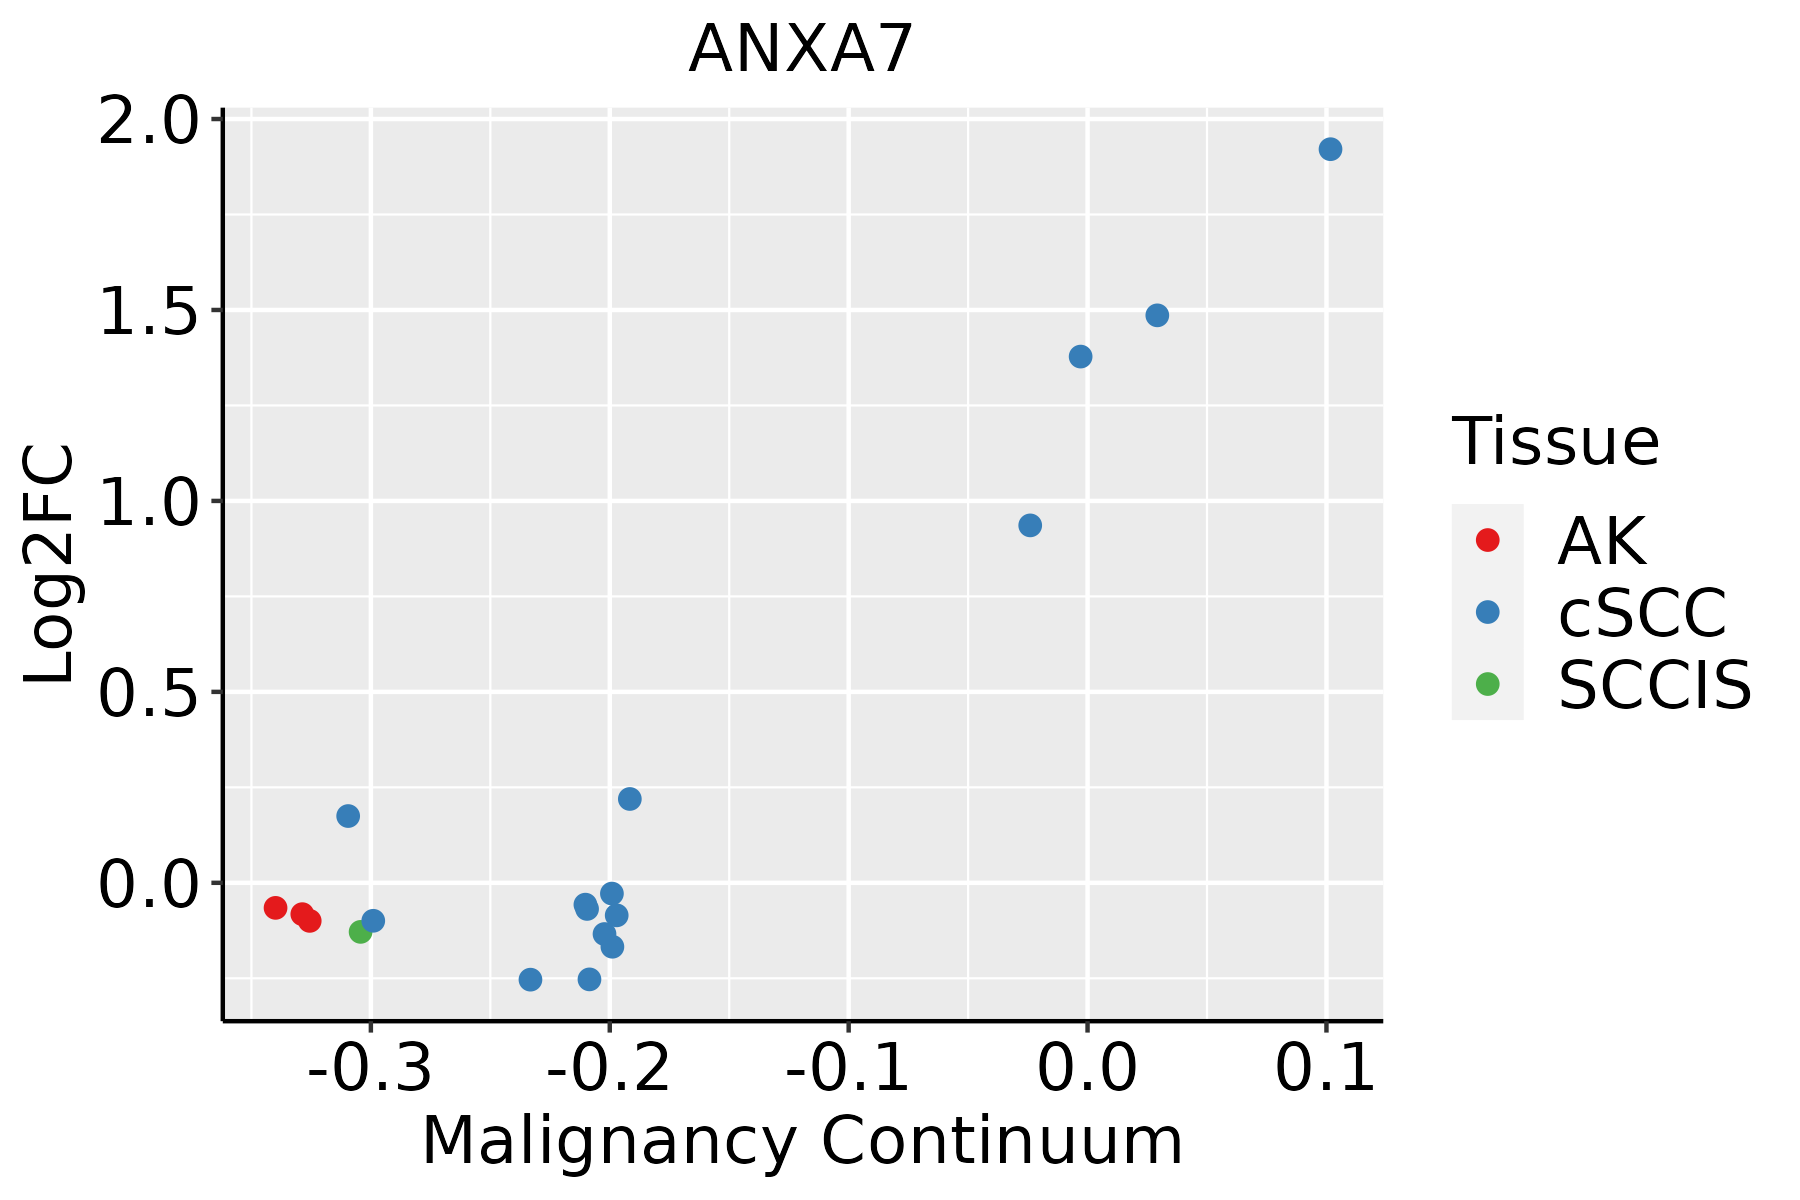 | AK: Actinic keratosis |
| cSCC: Cutaneous squamous cell carcinoma | ||
| SCCIS:squamous cell carcinoma in situ | ||
| Thyroid | 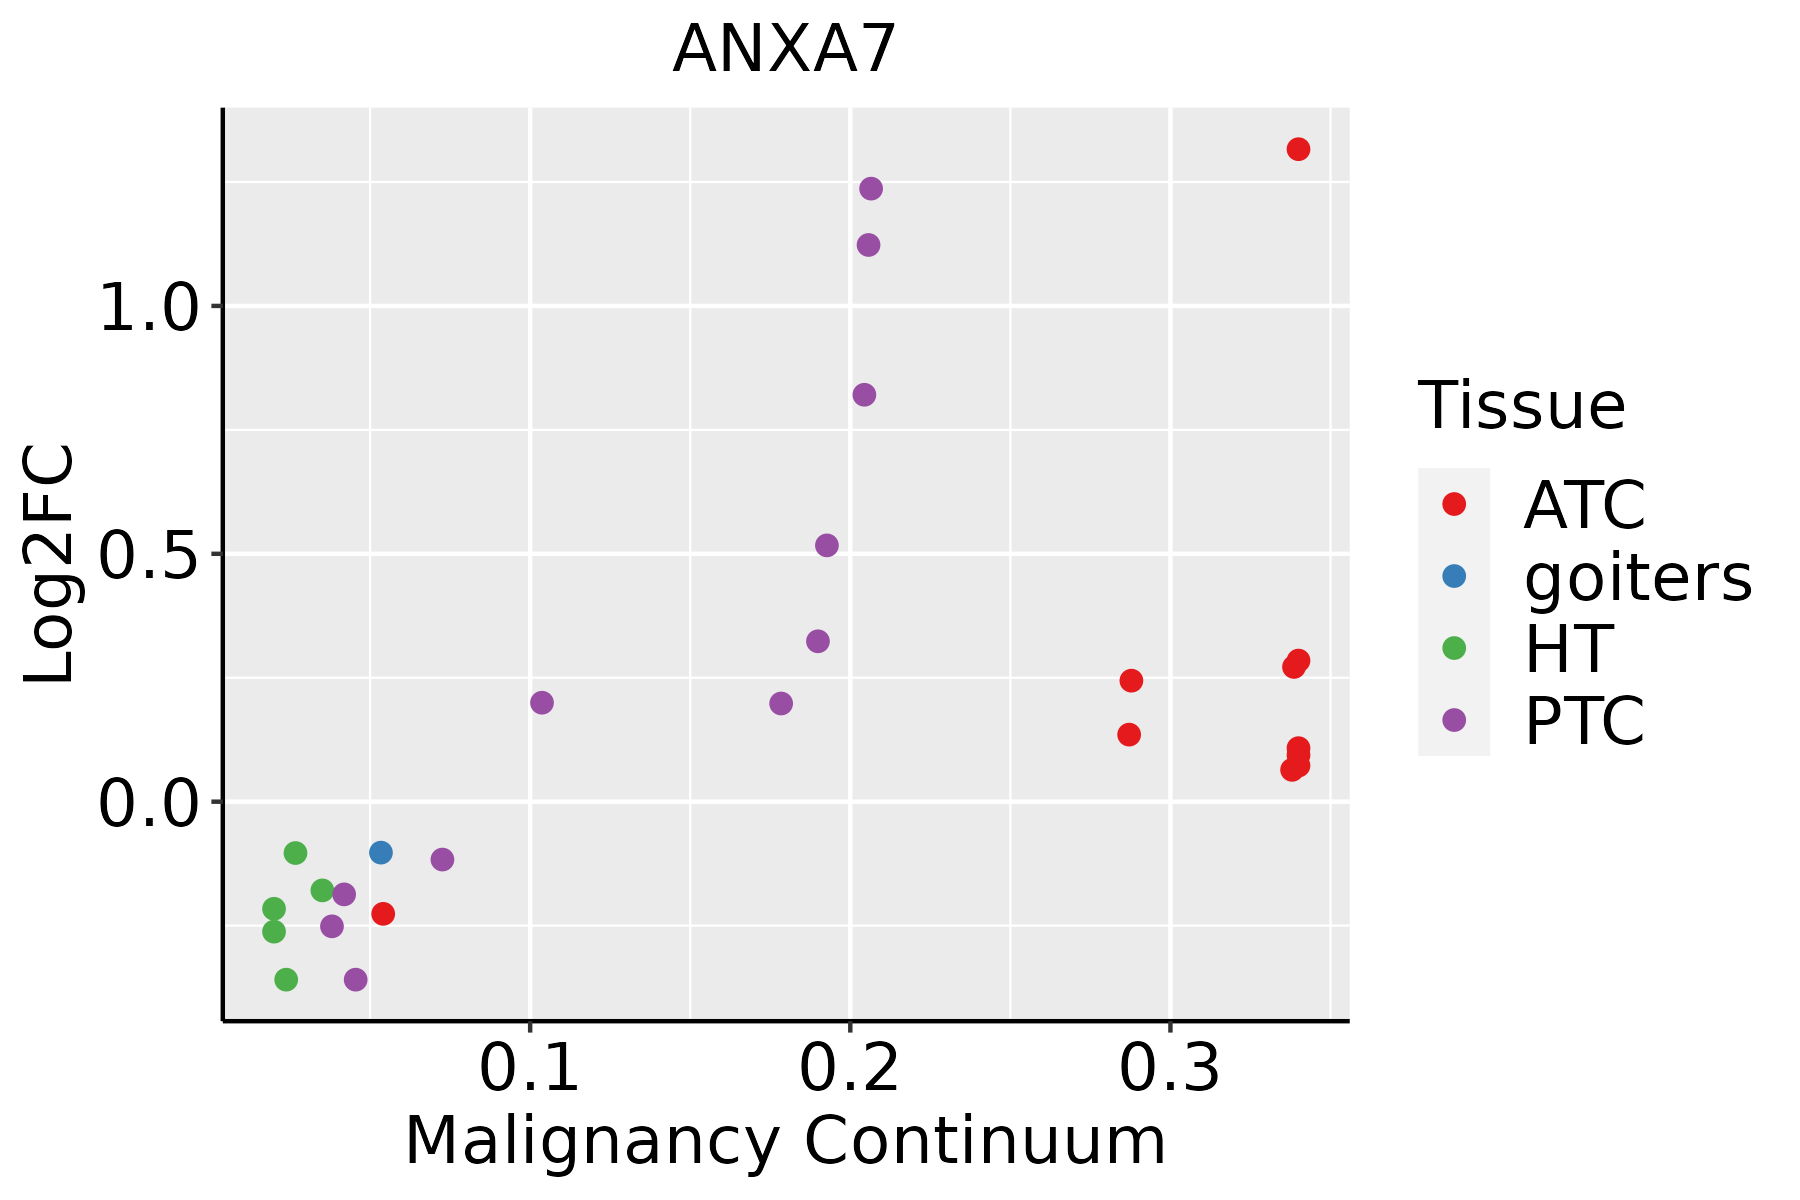 | ATC: Anaplastic thyroid cancer |
| HT: Hashimoto's thyroiditis | ||
| PTC: Papillary thyroid cancer |
| ∗log2FC in expression of this searched gene in stem-like cells from each diseased tissue sample relative to stem-like cells in normal samples in each tissue plotted against the malignancy continuum. Samples are colored based on if they are from different disease stage. |
Top |
Malignant transformation related pathway analysis |
| Find out the enriched GO biological processes and KEGG pathways involved in transition from healthy to precancer to cancer |
| Tissue | Disease Stage | Enriched GO biological Processes |
| Colorectum | AD |  |
| Colorectum | SER |  |
| Colorectum | MSS |  |
| Colorectum | MSI-H |  |
| Colorectum | FAP |  |
| ∗Top 15 enriched GO BP terms are showed in the bar plot of each disease state in each tissue. Each row represents a significant GO biological process which is colored according to the -log10(p.adjust). |
| Page: 1 2 3 4 5 6 7 8 9 |
| GO ID | Tissue | Disease Stage | Description | Gene Ratio | Bg Ratio | pvalue | p.adjust | Count |
| GO:001003827 | Esophagus | ESCC | response to metal ion | 208/8552 | 373/18723 | 5.02e-05 | 3.90e-04 | 208 |
| GO:00610254 | Esophagus | ESCC | membrane fusion | 98/8552 | 163/18723 | 1.39e-04 | 9.41e-04 | 98 |
| GO:001003812 | Liver | Cirrhotic | response to metal ion | 150/4634 | 373/18723 | 2.27e-11 | 1.37e-09 | 150 |
| GO:005159211 | Liver | Cirrhotic | response to calcium ion | 61/4634 | 149/18723 | 9.47e-06 | 1.38e-04 | 61 |
| GO:001003822 | Liver | HCC | response to metal ion | 208/7958 | 373/18723 | 1.35e-07 | 2.56e-06 | 208 |
| GO:0061025 | Liver | HCC | membrane fusion | 88/7958 | 163/18723 | 1.98e-03 | 1.00e-02 | 88 |
| GO:005159221 | Liver | HCC | response to calcium ion | 81/7958 | 149/18723 | 2.26e-03 | 1.13e-02 | 81 |
| GO:001003820 | Oral cavity | OSCC | response to metal ion | 188/7305 | 373/18723 | 4.34e-06 | 5.00e-05 | 188 |
| GO:00610253 | Oral cavity | OSCC | membrane fusion | 84/7305 | 163/18723 | 7.56e-04 | 4.12e-03 | 84 |
| GO:0010038110 | Oral cavity | LP | response to metal ion | 124/4623 | 373/18723 | 1.09e-04 | 1.31e-03 | 124 |
| GO:00610251 | Oral cavity | LP | membrane fusion | 58/4623 | 163/18723 | 1.19e-03 | 9.62e-03 | 58 |
| GO:001003826 | Oral cavity | EOLP | response to metal ion | 71/2218 | 373/18723 | 3.32e-05 | 4.65e-04 | 71 |
| GO:00515929 | Oral cavity | EOLP | response to calcium ion | 33/2218 | 149/18723 | 2.62e-04 | 2.54e-03 | 33 |
| GO:00610252 | Oral cavity | EOLP | membrane fusion | 31/2218 | 163/18723 | 5.09e-03 | 2.67e-02 | 31 |
| GO:001003829 | Skin | cSCC | response to metal ion | 132/4864 | 373/18723 | 3.11e-05 | 3.42e-04 | 132 |
| GO:00610255 | Skin | cSCC | membrane fusion | 63/4864 | 163/18723 | 2.49e-04 | 2.03e-03 | 63 |
| GO:005159217 | Skin | cSCC | response to calcium ion | 52/4864 | 149/18723 | 9.63e-03 | 4.31e-02 | 52 |
| GO:0010038112 | Thyroid | PTC | response to metal ion | 157/5968 | 373/18723 | 1.80e-05 | 1.86e-04 | 157 |
| GO:00610256 | Thyroid | PTC | membrane fusion | 77/5968 | 163/18723 | 2.86e-05 | 2.78e-04 | 77 |
| GO:005159219 | Thyroid | PTC | response to calcium ion | 65/5968 | 149/18723 | 1.67e-03 | 9.16e-03 | 65 |
| Page: 1 2 |
| Pathway ID | Tissue | Disease Stage | Description | Gene Ratio | Bg Ratio | pvalue | p.adjust | qvalue | Count |
| hsa05014210 | Esophagus | ESCC | Amyotrophic lateral sclerosis | 266/4205 | 364/8465 | 1.31e-20 | 2.20e-18 | 1.13e-18 | 266 |
| hsa0501438 | Esophagus | ESCC | Amyotrophic lateral sclerosis | 266/4205 | 364/8465 | 1.31e-20 | 2.20e-18 | 1.13e-18 | 266 |
| hsa0501414 | Liver | Cirrhotic | Amyotrophic lateral sclerosis | 187/2530 | 364/8465 | 1.56e-18 | 6.50e-17 | 4.01e-17 | 187 |
| hsa0501415 | Liver | Cirrhotic | Amyotrophic lateral sclerosis | 187/2530 | 364/8465 | 1.56e-18 | 6.50e-17 | 4.01e-17 | 187 |
| hsa0501422 | Liver | HCC | Amyotrophic lateral sclerosis | 252/4020 | 364/8465 | 8.85e-18 | 7.41e-16 | 4.12e-16 | 252 |
| hsa0501432 | Liver | HCC | Amyotrophic lateral sclerosis | 252/4020 | 364/8465 | 8.85e-18 | 7.41e-16 | 4.12e-16 | 252 |
| hsa0501428 | Oral cavity | OSCC | Amyotrophic lateral sclerosis | 246/3704 | 364/8465 | 6.65e-21 | 1.11e-18 | 5.67e-19 | 246 |
| hsa05014112 | Oral cavity | OSCC | Amyotrophic lateral sclerosis | 246/3704 | 364/8465 | 6.65e-21 | 1.11e-18 | 5.67e-19 | 246 |
| hsa0501429 | Oral cavity | LP | Amyotrophic lateral sclerosis | 197/2418 | 364/8465 | 1.25e-25 | 1.39e-23 | 8.93e-24 | 197 |
| hsa0501437 | Oral cavity | LP | Amyotrophic lateral sclerosis | 197/2418 | 364/8465 | 1.25e-25 | 1.39e-23 | 8.93e-24 | 197 |
| hsa0501445 | Oral cavity | EOLP | Amyotrophic lateral sclerosis | 93/1218 | 364/8465 | 7.07e-09 | 1.14e-07 | 6.74e-08 | 93 |
| hsa0501455 | Oral cavity | EOLP | Amyotrophic lateral sclerosis | 93/1218 | 364/8465 | 7.07e-09 | 1.14e-07 | 6.74e-08 | 93 |
| Page: 1 |
Top |
Cell-cell communication analysis |
| Identification of potential cell-cell interactions between two cell types and their ligand-receptor pairs for different disease states |
| Ligand | Receptor | LRpair | Pathway | Tissue | Disease Stage |
| Page: 1 |
Top |
Single-cell gene regulatory network inference analysis |
| Find out the significant the regulons (TFs) and the target genes of each regulon across cell types for different disease states |
| TF | Cell Type | Tissue | Disease Stage | Target Gene | RSS | Regulon Activity |
| ∗The dot plots of a searched regulon are shown for all cell subpopulations in each disease state of each tissue based on the regulon specific score inferred using pySCENIC and by calculating the average expression. |
| Page: 1 |
Top |
Somatic mutation of malignant transformation related genes |
| Annotation of somatic variants for genes involved in malignant transformation |
| Hugo Symbol | Variant Class | Variant Classification | dbSNP RS | HGVSc | HGVSp | HGVSp Short | SWISSPROT | BIOTYPE | SIFT | PolyPhen | Tumor Sample Barcode | Tissue | Histology | Sex | Age | Stage | Therapy Types | Drugs | Outcome |
| ANXA7 | SNV | Missense_Mutation | rs182716602 | c.1405N>G | p.Met469Val | p.M469V | P20073 | protein_coding | tolerated(0.5) | benign(0.033) | TCGA-GM-A3XL-01 | Breast | breast invasive carcinoma | Female | <65 | I/II | Chemotherapy | fluorouracil | CR |
| ANXA7 | SNV | Missense_Mutation | rs865807607 | c.1199N>T | p.Ser400Phe | p.S400F | P20073 | protein_coding | deleterious(0) | probably_damaging(0.999) | TCGA-LL-A441-01 | Breast | breast invasive carcinoma | Female | <65 | I/II | Chemotherapy | taxotere | CR |
| ANXA7 | SNV | Missense_Mutation | rs142735473 | c.556G>A | p.Asp186Asn | p.D186N | P20073 | protein_coding | tolerated(0.33) | benign(0.089) | TCGA-2W-A8YY-01 | Cervix | cervical & endocervical cancer | Female | <65 | I/II | Chemotherapy | cisplatin | CR |
| ANXA7 | SNV | Missense_Mutation | rs769213073 | c.784N>A | p.Asp262Asn | p.D262N | P20073 | protein_coding | deleterious(0.01) | probably_damaging(0.999) | TCGA-VS-A8EL-01 | Cervix | cervical & endocervical cancer | Female | <65 | I/II | Chemotherapy | cisplatin | CR |
| ANXA7 | SNV | Missense_Mutation | c.1337N>A | p.Arg446Gln | p.R446Q | P20073 | protein_coding | deleterious(0) | probably_damaging(0.999) | TCGA-A6-6141-01 | Colorectum | colon adenocarcinoma | Male | <65 | I/II | Chemotherapy | 5-fu | SD | |
| ANXA7 | SNV | Missense_Mutation | rs770697765 | c.991N>T | p.Arg331Cys | p.R331C | P20073 | protein_coding | deleterious(0) | probably_damaging(0.999) | TCGA-AA-A010-01 | Colorectum | colon adenocarcinoma | Female | <65 | I/II | Chemotherapy | folinic | CR |
| ANXA7 | SNV | Missense_Mutation | rs146521289 | c.1375N>A | p.Ala459Thr | p.A459T | P20073 | protein_coding | tolerated(0.57) | benign(0.022) | TCGA-G4-6309-01 | Colorectum | colon adenocarcinoma | Female | <65 | III/IV | Chemotherapy | xeloda | PD |
| ANXA7 | SNV | Missense_Mutation | rs10159690 | c.992N>A | p.Arg331His | p.R331H | P20073 | protein_coding | deleterious(0.01) | probably_damaging(0.996) | TCGA-AF-3911-01 | Colorectum | rectum adenocarcinoma | Male | <65 | III/IV | Chemotherapy | 5-fu | PD |
| ANXA7 | SNV | Missense_Mutation | rs769213073 | c.784N>A | p.Asp262Asn | p.D262N | P20073 | protein_coding | deleterious(0.01) | probably_damaging(0.999) | TCGA-EI-6917-01 | Colorectum | rectum adenocarcinoma | Male | <65 | III/IV | Chemotherapy | 5fluorouracil+oxaciplatina+l-folinian | SD |
| ANXA7 | SNV | Missense_Mutation | rs770294831 | c.644N>A | p.Arg215His | p.R215H | P20073 | protein_coding | deleterious(0) | benign(0.322) | TCGA-A5-A0G2-01 | Endometrium | uterine corpus endometrioid carcinoma | Female | <65 | III/IV | Unknown | Unknown | SD |
| Page: 1 2 3 4 |
Top |
Related drugs of malignant transformation related genes |
| Identification of chemicals and drugs interact with genes involved in malignant transfromation |
| (DGIdb 4.0) |
| Entrez ID | Symbol | Category | Interaction Types | Drug Claim Name | Drug Name | PMIDs |
| Page: 1 |

Copyright 2023-Present -The University of Texas Health Science Center at Houston |