
|
|||||
|
 | |
| |
| |
| |
| |
| |
|
Gene: ANXA6 |
Gene summary for ANXA6 |
| Gene information | Species | Human | Gene symbol | ANXA6 | Gene ID | 309 |
| Gene name | annexin A6 | |
| Gene Alias | ANX6 | |
| Cytomap | 5q33.1 | |
| Gene Type | protein-coding | GO ID | GO:0001501 | UniProtAcc | A0A0S2Z2Z6 |
Top |
Malignant transformation analysis |
| Identification of the aberrant gene expression in precancerous and cancerous lesions by comparing the gene expression of stem-like cells in diseased tissues with normal stem cells |
| Entrez ID | Symbol | Replicates | Species | Organ | Tissue | Adj P-value | Log2FC | Malignancy |
| 309 | ANXA6 | HTA11_866_3004761011 | Human | Colorectum | AD | 1.86e-04 | 1.84e-01 | 0.096 |
| 309 | ANXA6 | HTA11_99999970781_79442 | Human | Colorectum | MSS | 3.00e-03 | 7.72e-02 | 0.294 |
| 309 | ANXA6 | HTA11_99999965062_69753 | Human | Colorectum | MSI-H | 7.81e-08 | 7.07e-01 | 0.3487 |
| 309 | ANXA6 | HTA11_99999965104_69814 | Human | Colorectum | MSS | 3.75e-02 | 1.64e-01 | 0.281 |
| 309 | ANXA6 | HTA11_99999971662_82457 | Human | Colorectum | MSS | 8.03e-22 | 5.89e-01 | 0.3859 |
| 309 | ANXA6 | HTA11_99999973899_84307 | Human | Colorectum | MSS | 1.12e-06 | 2.66e-01 | 0.2585 |
| 309 | ANXA6 | HTA11_99999974143_84620 | Human | Colorectum | MSS | 1.69e-07 | 2.05e-01 | 0.3005 |
| 309 | ANXA6 | CRC-1-8810 | Human | Colorectum | CRC | 2.17e-04 | 2.39e-01 | 0.6257 |
| 309 | ANXA6 | LZE7T | Human | Esophagus | ESCC | 2.35e-02 | 1.27e-01 | 0.0667 |
| 309 | ANXA6 | LZE24T | Human | Esophagus | ESCC | 9.94e-04 | 8.59e-02 | 0.0596 |
| 309 | ANXA6 | LZE6T | Human | Esophagus | ESCC | 2.84e-10 | 7.24e-01 | 0.0845 |
| 309 | ANXA6 | P2T-E | Human | Esophagus | ESCC | 1.21e-45 | 7.54e-01 | 0.1177 |
| 309 | ANXA6 | P4T-E | Human | Esophagus | ESCC | 1.66e-05 | 3.43e-01 | 0.1323 |
| 309 | ANXA6 | P9T-E | Human | Esophagus | ESCC | 3.19e-05 | 2.47e-01 | 0.1131 |
| 309 | ANXA6 | P10T-E | Human | Esophagus | ESCC | 6.85e-11 | 2.95e-01 | 0.116 |
| 309 | ANXA6 | P11T-E | Human | Esophagus | ESCC | 5.27e-09 | 6.24e-01 | 0.1426 |
| 309 | ANXA6 | P16T-E | Human | Esophagus | ESCC | 6.44e-25 | 4.73e-01 | 0.1153 |
| 309 | ANXA6 | P19T-E | Human | Esophagus | ESCC | 3.16e-10 | 1.22e+00 | 0.1662 |
| 309 | ANXA6 | P24T-E | Human | Esophagus | ESCC | 6.32e-08 | 4.16e-01 | 0.1287 |
| 309 | ANXA6 | P32T-E | Human | Esophagus | ESCC | 2.58e-40 | 1.02e+00 | 0.1666 |
| Page: 1 2 3 4 |
| Tissue | Expression Dynamics | Abbreviation |
| Colorectum (GSE201348) |  | FAP: Familial adenomatous polyposis |
| CRC: Colorectal cancer | ||
| Colorectum (HTA11) |  | AD: Adenomas |
| SER: Sessile serrated lesions | ||
| MSI-H: Microsatellite-high colorectal cancer | ||
| MSS: Microsatellite stable colorectal cancer | ||
| Esophagus | 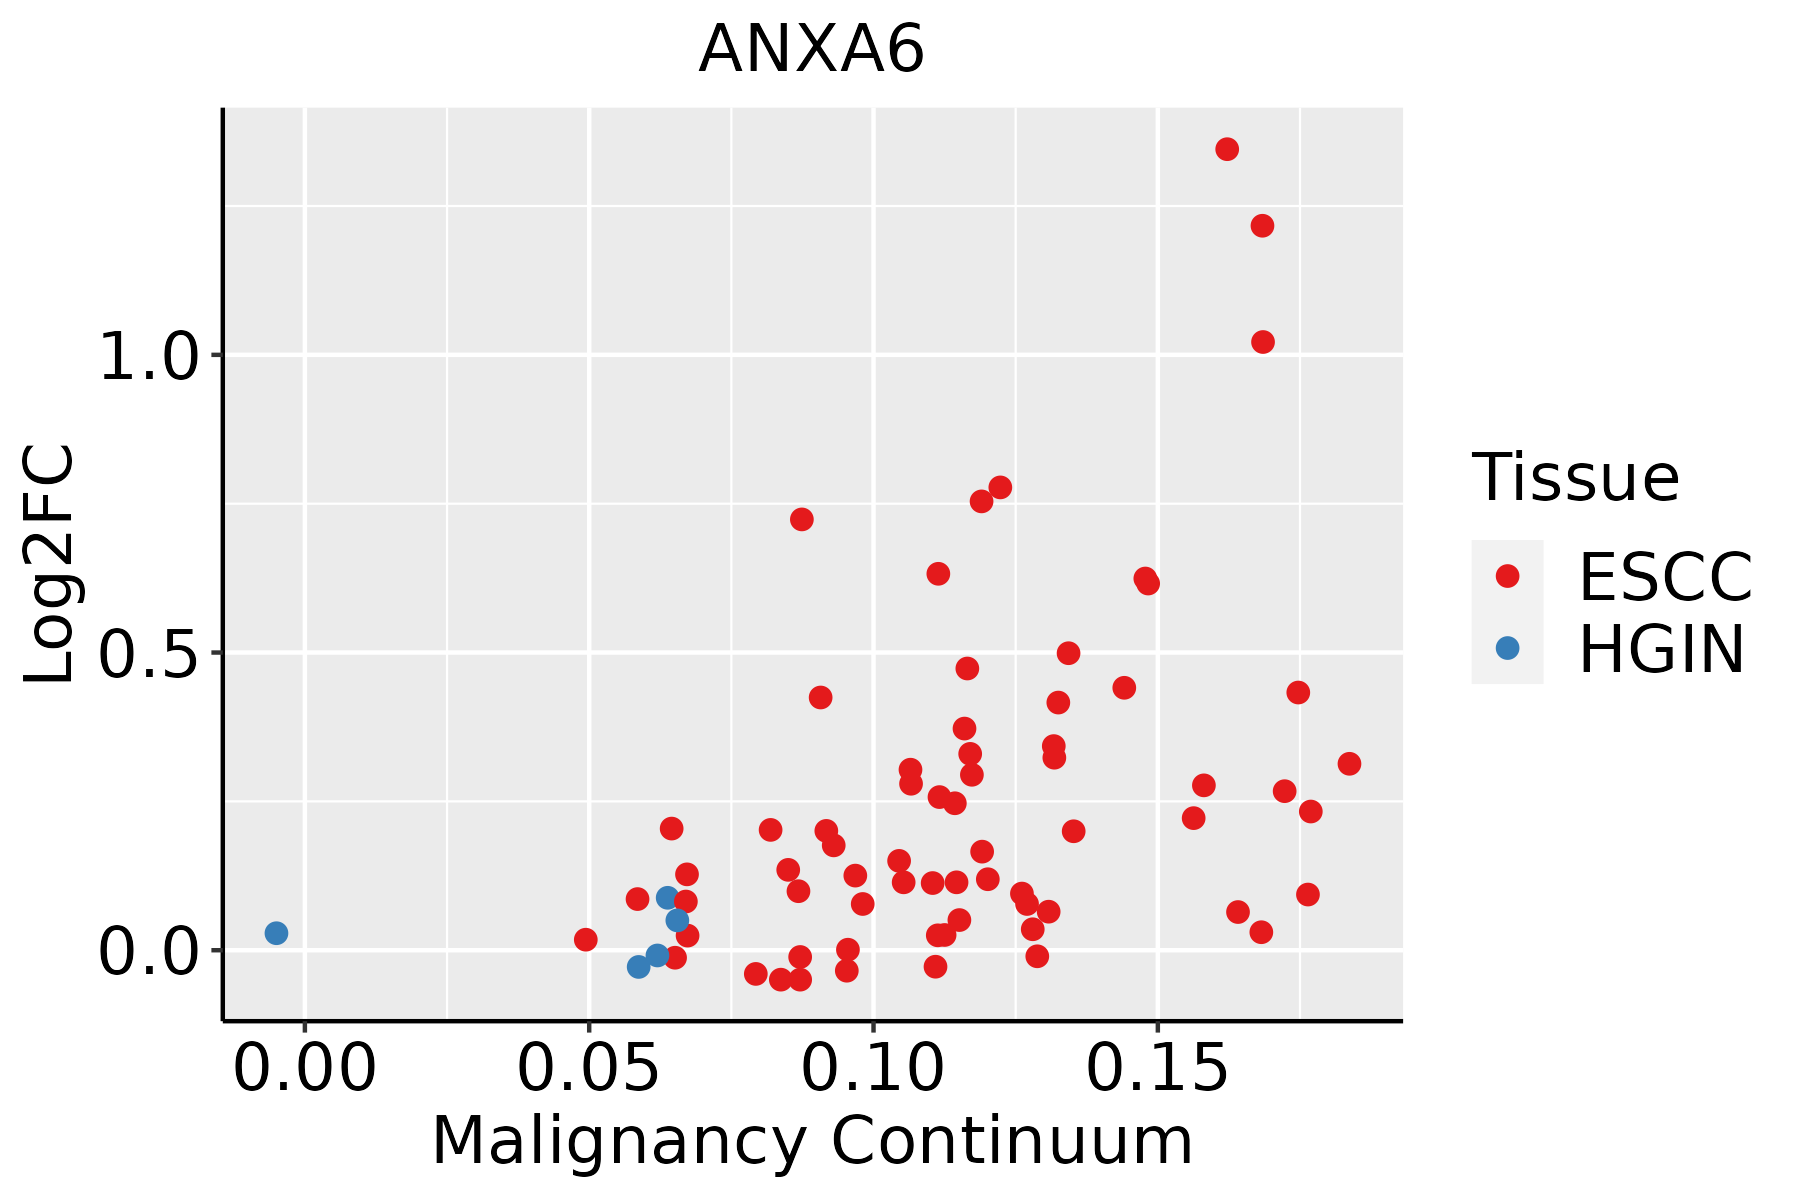 | ESCC: Esophageal squamous cell carcinoma |
| HGIN: High-grade intraepithelial neoplasias | ||
| LGIN: Low-grade intraepithelial neoplasias | ||
| Liver | 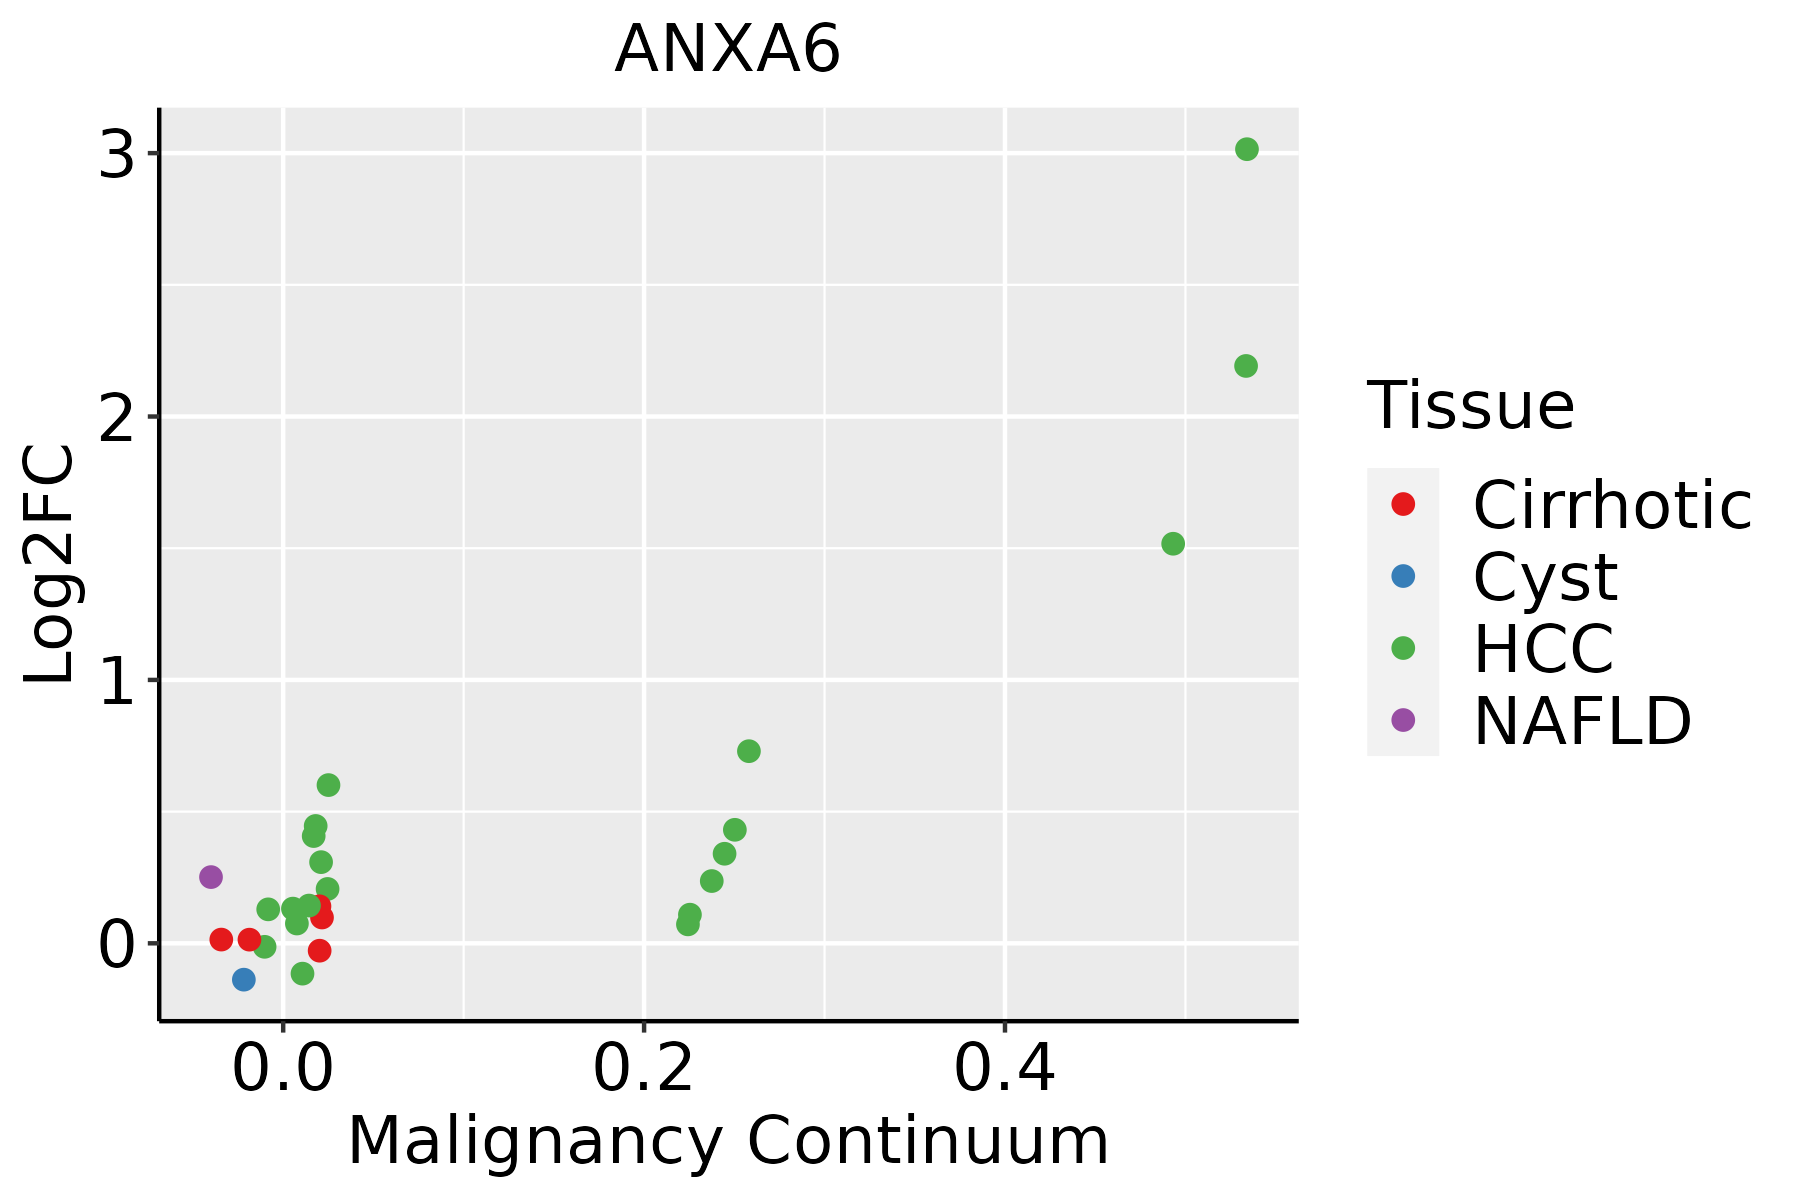 | HCC: Hepatocellular carcinoma |
| NAFLD: Non-alcoholic fatty liver disease | ||
| Oral Cavity |  | EOLP: Erosive Oral lichen planus |
| LP: leukoplakia | ||
| NEOLP: Non-erosive oral lichen planus | ||
| OSCC: Oral squamous cell carcinoma | ||
| Thyroid | 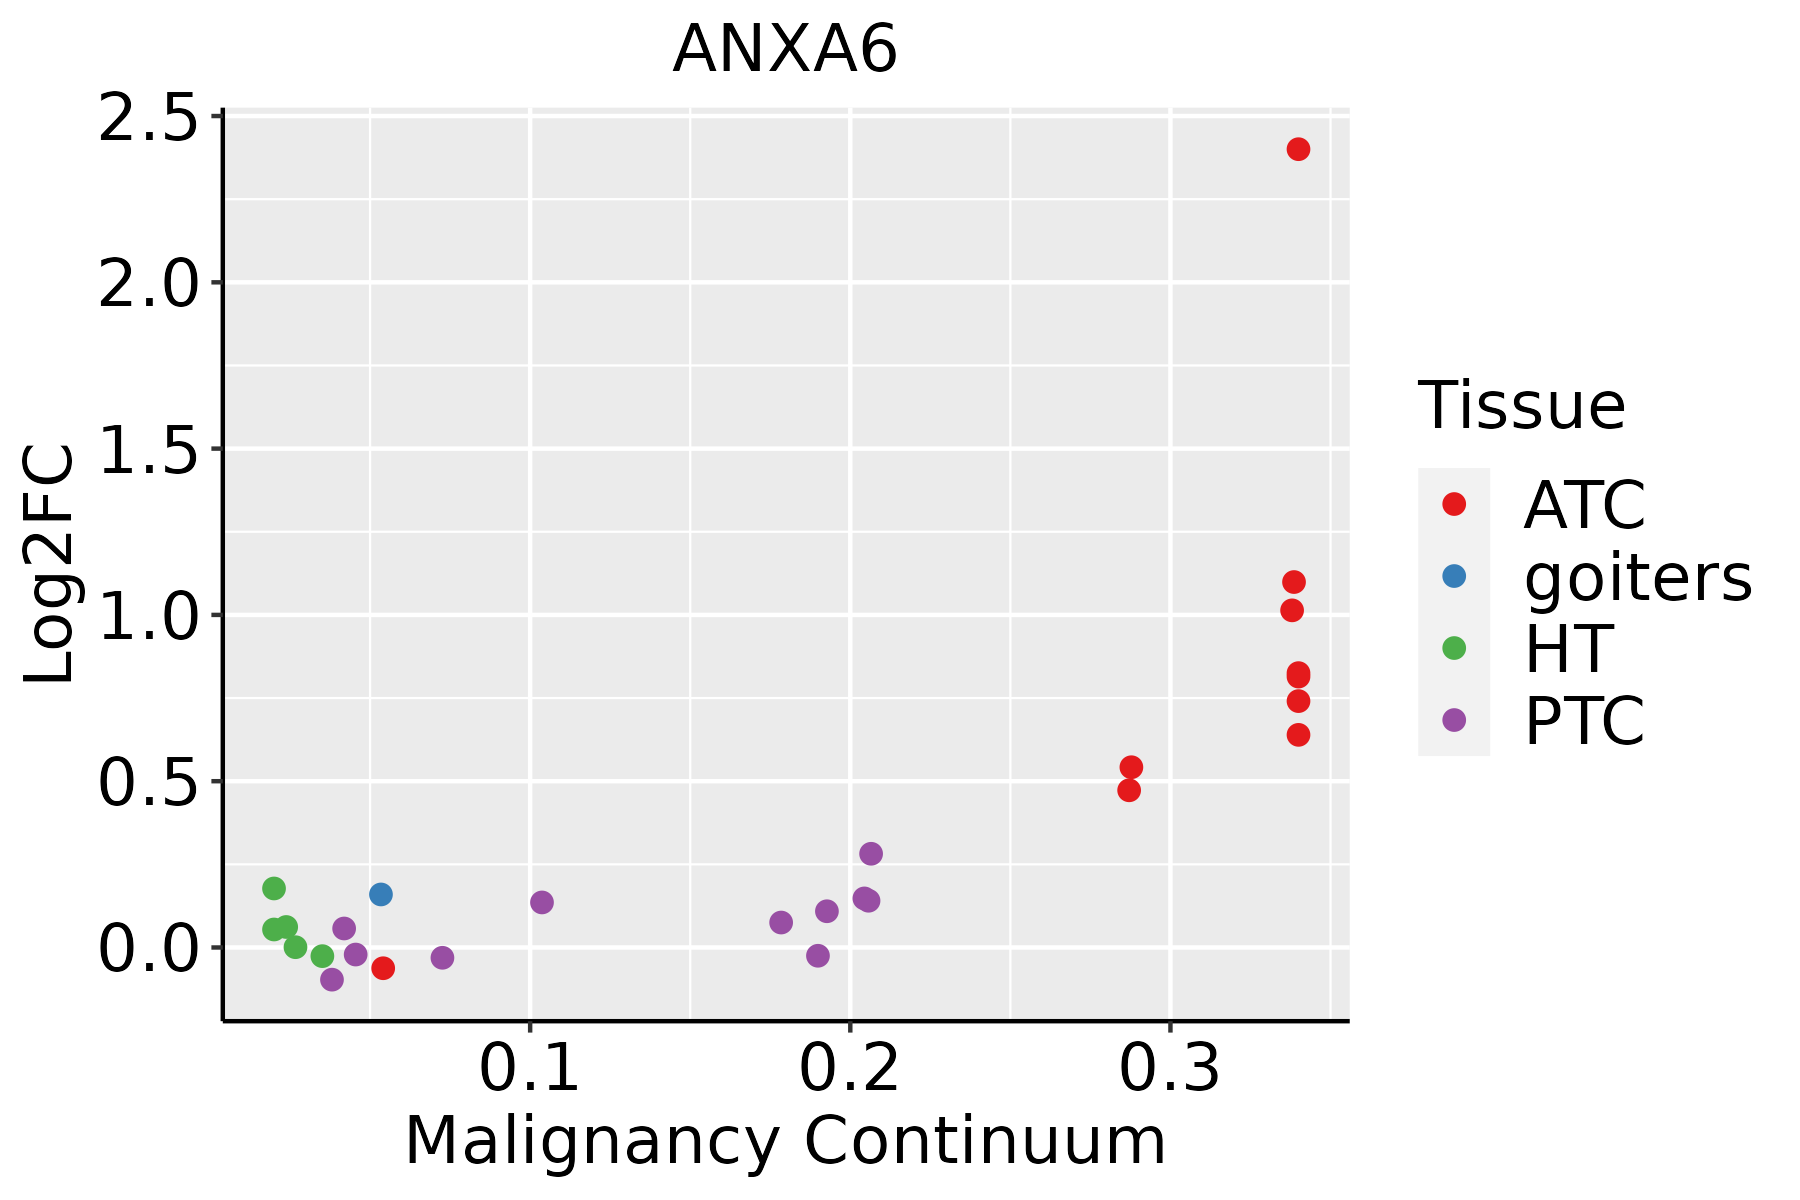 | ATC: Anaplastic thyroid cancer |
| HT: Hashimoto's thyroiditis | ||
| PTC: Papillary thyroid cancer |
| ∗log2FC in expression of this searched gene in stem-like cells from each diseased tissue sample relative to stem-like cells in normal samples in each tissue plotted against the malignancy continuum. Samples are colored based on if they are from different disease stage. |
Top |
Malignant transformation related pathway analysis |
| Find out the enriched GO biological processes and KEGG pathways involved in transition from healthy to precancer to cancer |
| Tissue | Disease Stage | Enriched GO biological Processes |
| Colorectum | AD |  |
| Colorectum | SER |  |
| Colorectum | MSS |  |
| Colorectum | MSI-H |  |
| Colorectum | FAP |  |
| ∗Top 15 enriched GO BP terms are showed in the bar plot of each disease state in each tissue. Each row represents a significant GO biological process which is colored according to the -log10(p.adjust). |
| Page: 1 2 3 4 5 6 7 8 9 |
| GO ID | Tissue | Disease Stage | Description | Gene Ratio | Bg Ratio | pvalue | p.adjust | Count |
| GO:0042060 | Colorectum | AD | wound healing | 128/3918 | 422/18723 | 2.73e-06 | 7.89e-05 | 128 |
| GO:0001667 | Colorectum | AD | ameboidal-type cell migration | 137/3918 | 475/18723 | 2.17e-05 | 4.33e-04 | 137 |
| GO:0051560 | Colorectum | AD | mitochondrial calcium ion homeostasis | 13/3918 | 26/18723 | 9.41e-04 | 8.92e-03 | 13 |
| GO:0090257 | Colorectum | AD | regulation of muscle system process | 73/3918 | 252/18723 | 1.46e-03 | 1.24e-02 | 73 |
| GO:0051651 | Colorectum | AD | maintenance of location in cell | 61/3918 | 214/18723 | 5.02e-03 | 3.37e-02 | 61 |
| GO:00420602 | Colorectum | MSS | wound healing | 119/3467 | 422/18723 | 5.93e-07 | 2.24e-05 | 119 |
| GO:00016672 | Colorectum | MSS | ameboidal-type cell migration | 120/3467 | 475/18723 | 1.37e-04 | 2.05e-03 | 120 |
| GO:00515602 | Colorectum | MSS | mitochondrial calcium ion homeostasis | 12/3467 | 26/18723 | 1.16e-03 | 1.12e-02 | 12 |
| GO:0003413 | Colorectum | MSS | chondrocyte differentiation involved in endochondral bone morphogenesis | 8/3467 | 14/18723 | 1.42e-03 | 1.32e-02 | 8 |
| GO:00902572 | Colorectum | MSS | regulation of muscle system process | 66/3467 | 252/18723 | 1.55e-03 | 1.41e-02 | 66 |
| GO:00516512 | Colorectum | MSS | maintenance of location in cell | 57/3467 | 214/18723 | 2.07e-03 | 1.76e-02 | 57 |
| GO:00030121 | Colorectum | MSS | muscle system process | 105/3467 | 452/18723 | 6.39e-03 | 4.26e-02 | 105 |
| GO:0048762 | Colorectum | MSS | mesenchymal cell differentiation | 59/3467 | 236/18723 | 7.79e-03 | 4.84e-02 | 59 |
| GO:0006937 | Colorectum | MSI-H | regulation of muscle contraction | 24/1319 | 169/18723 | 7.87e-04 | 1.46e-02 | 24 |
| GO:00420603 | Colorectum | MSI-H | wound healing | 47/1319 | 422/18723 | 1.23e-03 | 2.00e-02 | 47 |
| GO:00902573 | Colorectum | MSI-H | regulation of muscle system process | 31/1319 | 252/18723 | 1.74e-03 | 2.52e-02 | 31 |
| GO:00420605 | Colorectum | CRC | wound healing | 80/2078 | 422/18723 | 1.06e-06 | 6.54e-05 | 80 |
| GO:00902575 | Colorectum | CRC | regulation of muscle system process | 51/2078 | 252/18723 | 1.49e-05 | 4.63e-04 | 51 |
| GO:00016674 | Colorectum | CRC | ameboidal-type cell migration | 82/2078 | 475/18723 | 3.09e-05 | 8.01e-04 | 82 |
| GO:00030123 | Colorectum | CRC | muscle system process | 74/2078 | 452/18723 | 3.92e-04 | 5.80e-03 | 74 |
| Page: 1 2 3 4 5 6 |
| Pathway ID | Tissue | Disease Stage | Description | Gene Ratio | Bg Ratio | pvalue | p.adjust | qvalue | Count |
| Page: 1 |
Top |
Cell-cell communication analysis |
| Identification of potential cell-cell interactions between two cell types and their ligand-receptor pairs for different disease states |
| Ligand | Receptor | LRpair | Pathway | Tissue | Disease Stage |
| Page: 1 |
Top |
Single-cell gene regulatory network inference analysis |
| Find out the significant the regulons (TFs) and the target genes of each regulon across cell types for different disease states |
| TF | Cell Type | Tissue | Disease Stage | Target Gene | RSS | Regulon Activity |
| ∗The dot plots of a searched regulon are shown for all cell subpopulations in each disease state of each tissue based on the regulon specific score inferred using pySCENIC and by calculating the average expression. |
| Page: 1 |
Top |
Somatic mutation of malignant transformation related genes |
| Annotation of somatic variants for genes involved in malignant transformation |
| Hugo Symbol | Variant Class | Variant Classification | dbSNP RS | HGVSc | HGVSp | HGVSp Short | SWISSPROT | BIOTYPE | SIFT | PolyPhen | Tumor Sample Barcode | Tissue | Histology | Sex | Age | Stage | Therapy Types | Drugs | Outcome |
| ANXA6 | SNV | Missense_Mutation | rs748009214 | c.1147N>A | p.Glu383Lys | p.E383K | P08133 | protein_coding | deleterious(0.03) | possibly_damaging(0.833) | TCGA-AN-A046-01 | Breast | breast invasive carcinoma | Female | >=65 | I/II | Unknown | Unknown | SD |
| ANXA6 | SNV | Missense_Mutation | rs772576227 | c.1886G>A | p.Arg629His | p.R629H | P08133 | protein_coding | deleterious(0) | probably_damaging(1) | TCGA-BH-A0DI-01 | Breast | breast invasive carcinoma | Female | <65 | I/II | Chemotherapy | adriamycin | CR |
| ANXA6 | SNV | Missense_Mutation | c.905A>G | p.Tyr302Cys | p.Y302C | P08133 | protein_coding | deleterious(0.02) | possibly_damaging(0.761) | TCGA-D8-A1X9-01 | Breast | breast invasive carcinoma | Female | >=65 | I/II | Chemotherapy | adriamycin+cyclophosphamide | SD | |
| ANXA6 | SNV | Missense_Mutation | c.1878N>C | p.Met626Ile | p.M626I | P08133 | protein_coding | tolerated(0.27) | benign(0.018) | TCGA-E2-A14W-01 | Breast | breast invasive carcinoma | Male | >=65 | I/II | Chemotherapy | cytoxan | SD | |
| ANXA6 | SNV | Missense_Mutation | rs763713710 | c.842G>A | p.Arg281His | p.R281H | P08133 | protein_coding | deleterious(0) | probably_damaging(1) | TCGA-E9-A228-01 | Breast | breast invasive carcinoma | Female | <65 | I/II | Chemotherapy | doxorubicin | SD |
| ANXA6 | SNV | Missense_Mutation | novel | c.1192C>T | p.Arg398Trp | p.R398W | P08133 | protein_coding | deleterious(0) | probably_damaging(1) | TCGA-EA-A410-01 | Cervix | cervical & endocervical cancer | Female | <65 | I/II | Unknown | Unknown | SD |
| ANXA6 | SNV | Missense_Mutation | novel | c.133N>A | p.Asp45Asn | p.D45N | P08133 | protein_coding | tolerated(0.16) | benign(0.185) | TCGA-VS-A8EL-01 | Cervix | cervical & endocervical cancer | Female | <65 | I/II | Chemotherapy | cisplatin | CR |
| ANXA6 | SNV | Missense_Mutation | rs758088547 | c.148C>T | p.Arg50Trp | p.R50W | P08133 | protein_coding | deleterious(0) | probably_damaging(0.996) | TCGA-5M-AATE-01 | Colorectum | colon adenocarcinoma | Male | >=65 | I/II | Unknown | Unknown | PD |
| ANXA6 | SNV | Missense_Mutation | c.1458N>T | p.Glu486Asp | p.E486D | P08133 | protein_coding | deleterious(0) | benign(0.258) | TCGA-A6-3809-01 | Colorectum | colon adenocarcinoma | Female | >=65 | I/II | Unknown | Unknown | SD | |
| ANXA6 | SNV | Missense_Mutation | c.1391C>T | p.Thr464Ile | p.T464I | P08133 | protein_coding | deleterious(0) | probably_damaging(1) | TCGA-A6-6781-01 | Colorectum | colon adenocarcinoma | Male | <65 | III/IV | Chemotherapy | oxaliplatin | SD |
| Page: 1 2 3 4 5 6 7 8 |
Top |
Related drugs of malignant transformation related genes |
| Identification of chemicals and drugs interact with genes involved in malignant transfromation |
| (DGIdb 4.0) |
| Entrez ID | Symbol | Category | Interaction Types | Drug Claim Name | Drug Name | PMIDs |
| Page: 1 |

Copyright 2023-Present -The University of Texas Health Science Center at Houston |