
|
|||||
|
 | |
| |
| |
| |
| |
| |
|
Gene: ANXA4 |
Gene summary for ANXA4 |
| Gene information | Species | Human | Gene symbol | ANXA4 | Gene ID | 307 |
| Gene name | annexin A4 | |
| Gene Alias | ANX4 | |
| Cytomap | 2p13.3 | |
| Gene Type | protein-coding | GO ID | GO:0001816 | UniProtAcc | P09525 |
Top |
Malignant transformation analysis |
| Identification of the aberrant gene expression in precancerous and cancerous lesions by comparing the gene expression of stem-like cells in diseased tissues with normal stem cells |
| Entrez ID | Symbol | Replicates | Species | Organ | Tissue | Adj P-value | Log2FC | Malignancy |
| 307 | ANXA4 | HTA11_2487_2000001011 | Human | Colorectum | SER | 6.10e-10 | 9.08e-01 | -0.1808 |
| 307 | ANXA4 | HTA11_1938_2000001011 | Human | Colorectum | AD | 4.33e-15 | 1.13e+00 | -0.0811 |
| 307 | ANXA4 | HTA11_78_2000001011 | Human | Colorectum | AD | 2.28e-13 | 7.52e-01 | -0.1088 |
| 307 | ANXA4 | HTA11_347_2000001011 | Human | Colorectum | AD | 7.08e-23 | 8.41e-01 | -0.1954 |
| 307 | ANXA4 | HTA11_411_2000001011 | Human | Colorectum | SER | 4.27e-02 | 7.42e-01 | -0.2602 |
| 307 | ANXA4 | HTA11_83_2000001011 | Human | Colorectum | SER | 1.99e-07 | 7.41e-01 | -0.1526 |
| 307 | ANXA4 | HTA11_696_2000001011 | Human | Colorectum | AD | 2.10e-06 | 5.46e-01 | -0.1464 |
| 307 | ANXA4 | HTA11_866_2000001011 | Human | Colorectum | AD | 4.21e-05 | 4.98e-01 | -0.1001 |
| 307 | ANXA4 | HTA11_1391_2000001011 | Human | Colorectum | AD | 3.05e-13 | 1.08e+00 | -0.059 |
| 307 | ANXA4 | HTA11_99999965104_69814 | Human | Colorectum | MSS | 1.09e-07 | 6.74e-01 | 0.281 |
| 307 | ANXA4 | HTA11_99999971662_82457 | Human | Colorectum | MSS | 2.60e-05 | 5.93e-01 | 0.3859 |
| 307 | ANXA4 | HTA11_99999974143_84620 | Human | Colorectum | MSS | 1.56e-06 | 5.01e-01 | 0.3005 |
| 307 | ANXA4 | A015-C-203 | Human | Colorectum | FAP | 1.56e-24 | -3.62e-01 | -0.1294 |
| 307 | ANXA4 | A015-C-204 | Human | Colorectum | FAP | 2.09e-04 | -1.76e-01 | -0.0228 |
| 307 | ANXA4 | A014-C-040 | Human | Colorectum | FAP | 6.69e-06 | -5.17e-01 | -0.1184 |
| 307 | ANXA4 | A002-C-201 | Human | Colorectum | FAP | 7.82e-11 | -3.35e-01 | 0.0324 |
| 307 | ANXA4 | A001-C-119 | Human | Colorectum | FAP | 4.45e-04 | -4.16e-02 | -0.1557 |
| 307 | ANXA4 | A001-C-108 | Human | Colorectum | FAP | 1.09e-11 | -1.98e-01 | -0.0272 |
| 307 | ANXA4 | A002-C-205 | Human | Colorectum | FAP | 3.25e-20 | -4.25e-01 | -0.1236 |
| 307 | ANXA4 | A015-C-005 | Human | Colorectum | FAP | 4.62e-02 | -1.92e-01 | -0.0336 |
| Page: 1 2 3 4 5 6 7 8 9 10 11 |
| Tissue | Expression Dynamics | Abbreviation |
| Colorectum (GSE201348) |  | FAP: Familial adenomatous polyposis |
| CRC: Colorectal cancer | ||
| Colorectum (HTA11) |  | AD: Adenomas |
| SER: Sessile serrated lesions | ||
| MSI-H: Microsatellite-high colorectal cancer | ||
| MSS: Microsatellite stable colorectal cancer | ||
| Esophagus | 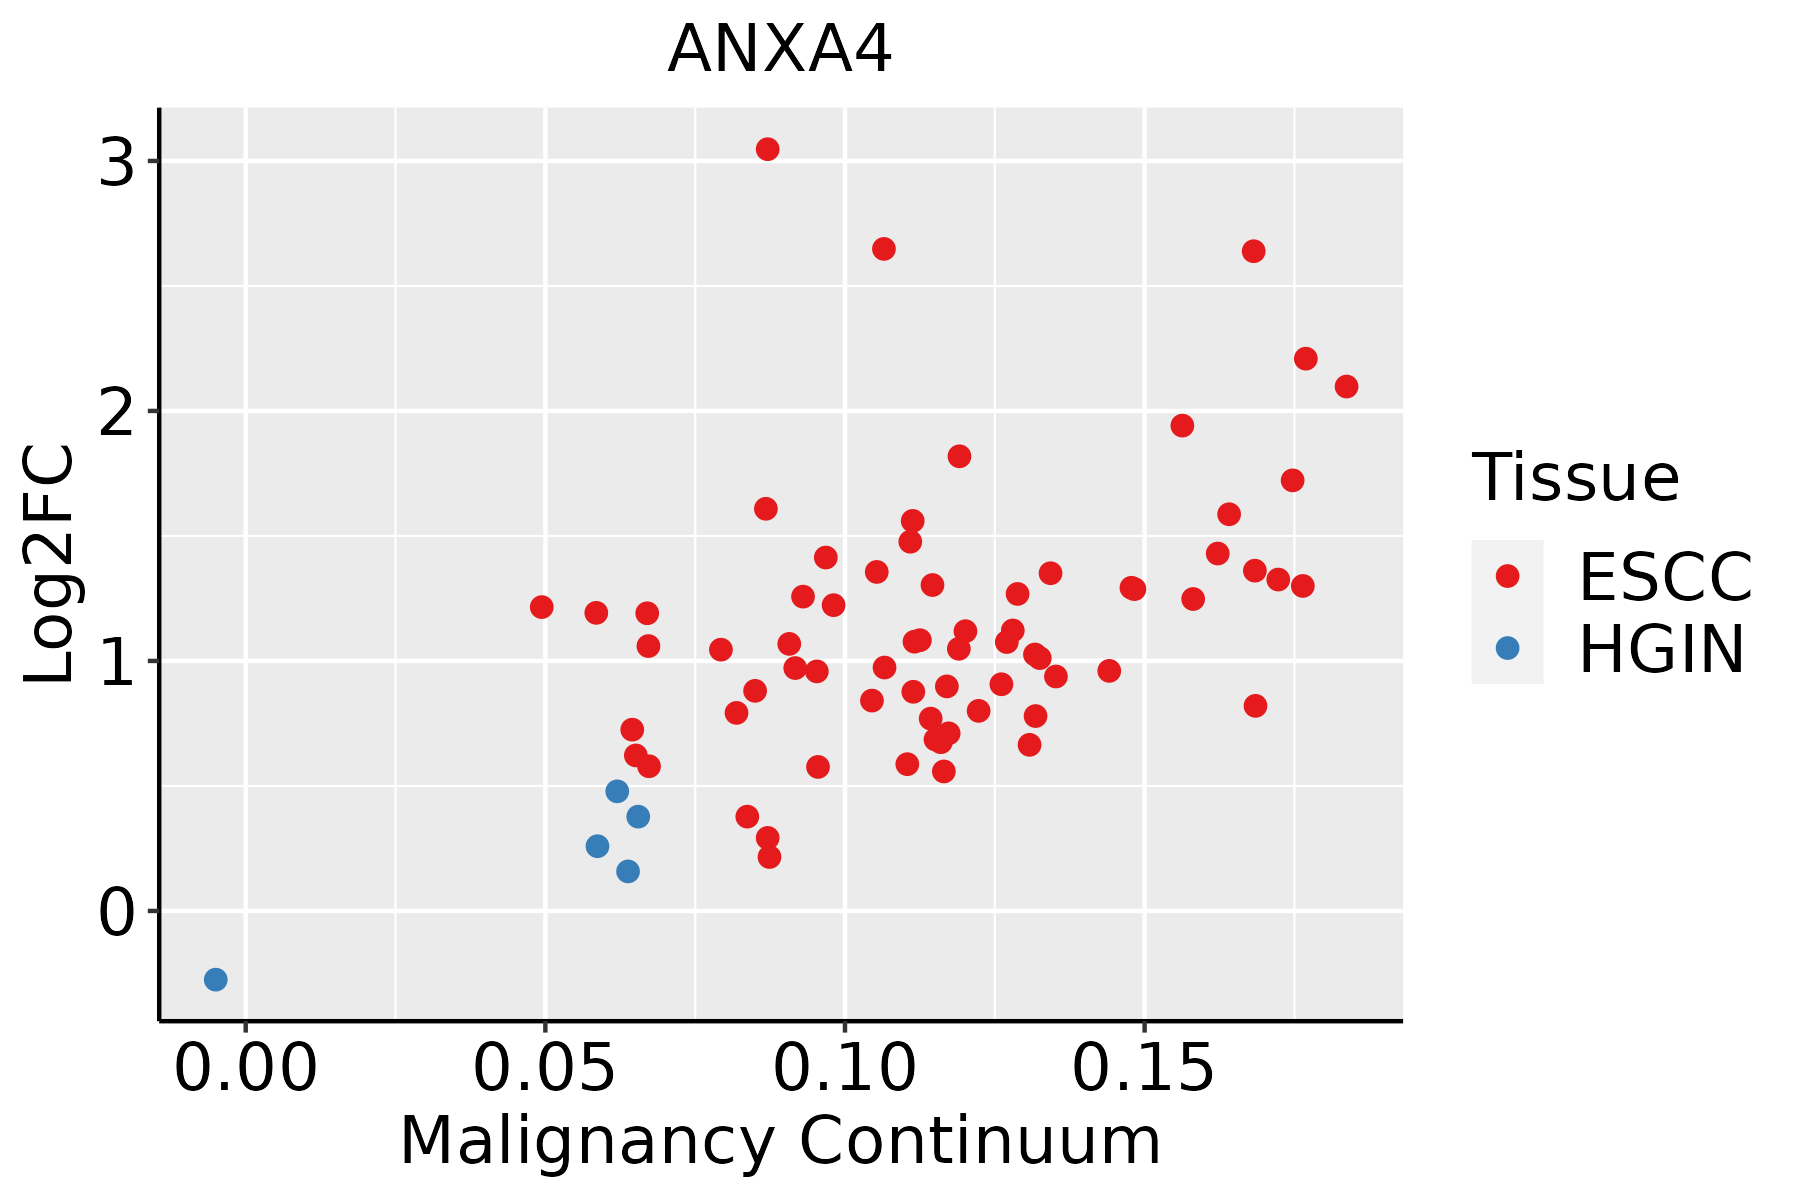 | ESCC: Esophageal squamous cell carcinoma |
| HGIN: High-grade intraepithelial neoplasias | ||
| LGIN: Low-grade intraepithelial neoplasias | ||
| GC | 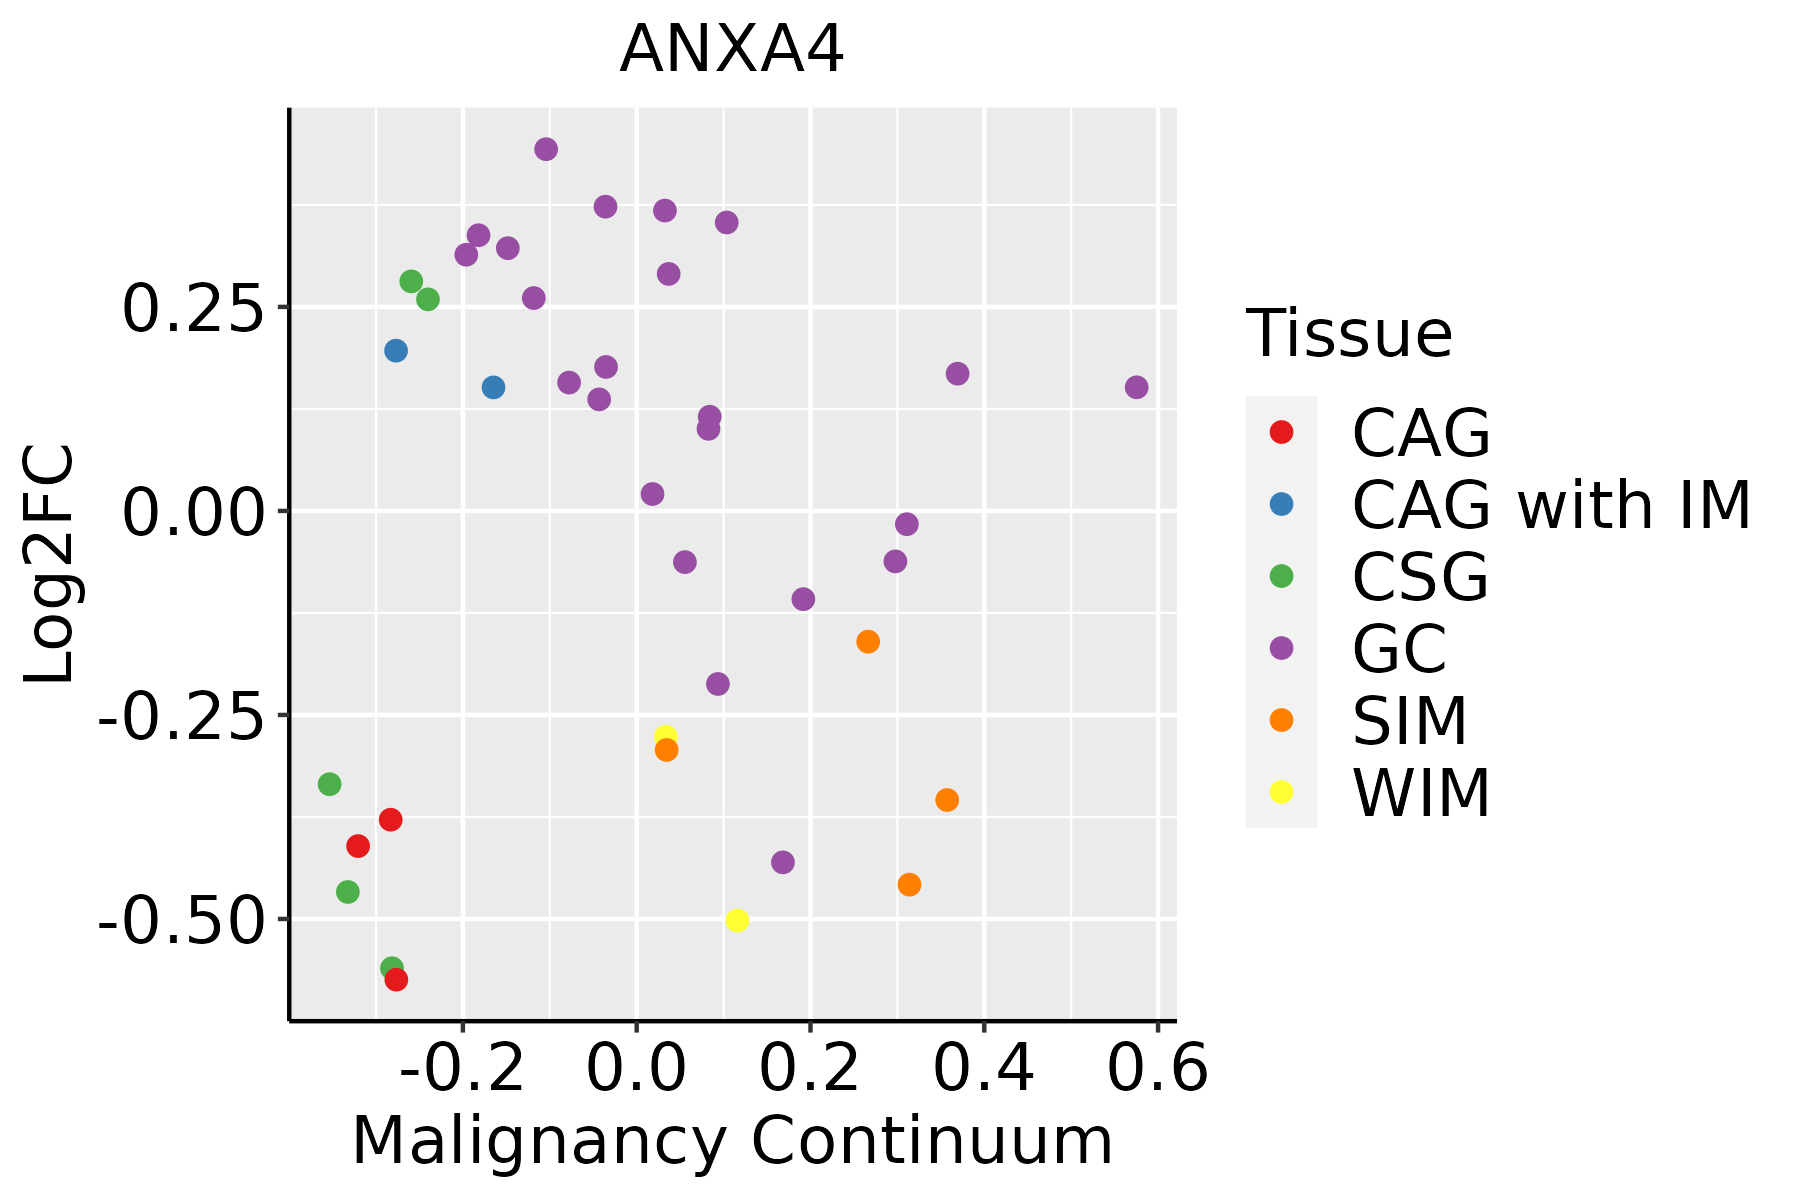 | CAG: Chronic atrophic gastritis |
| CAG with IM: Chronic atrophic gastritis with intestinal metaplasia | ||
| CSG: Chronic superficial gastritis | ||
| GC: Gastric cancer | ||
| SIM: Severe intestinal metaplasia | ||
| WIM: Wild intestinal metaplasia | ||
| Liver | 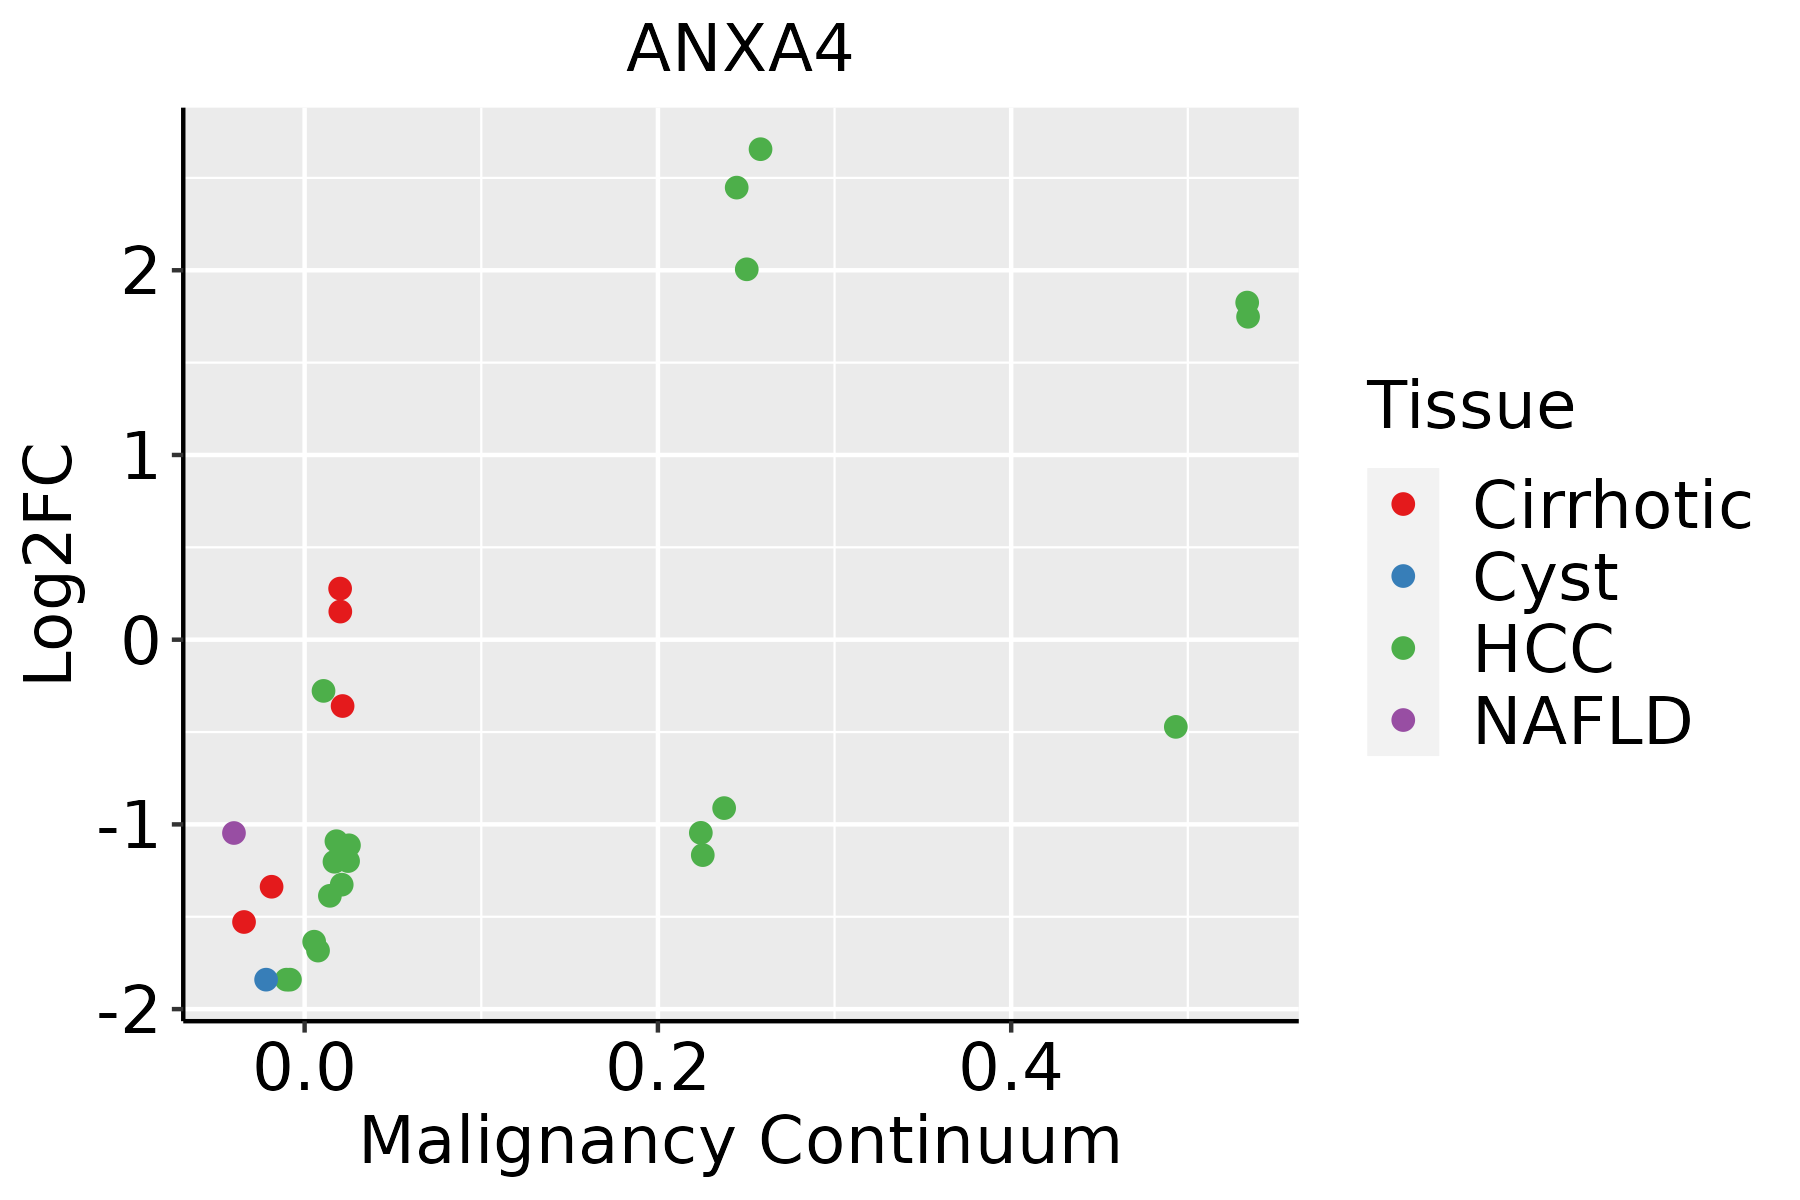 | HCC: Hepatocellular carcinoma |
| NAFLD: Non-alcoholic fatty liver disease | ||
| Oral Cavity | 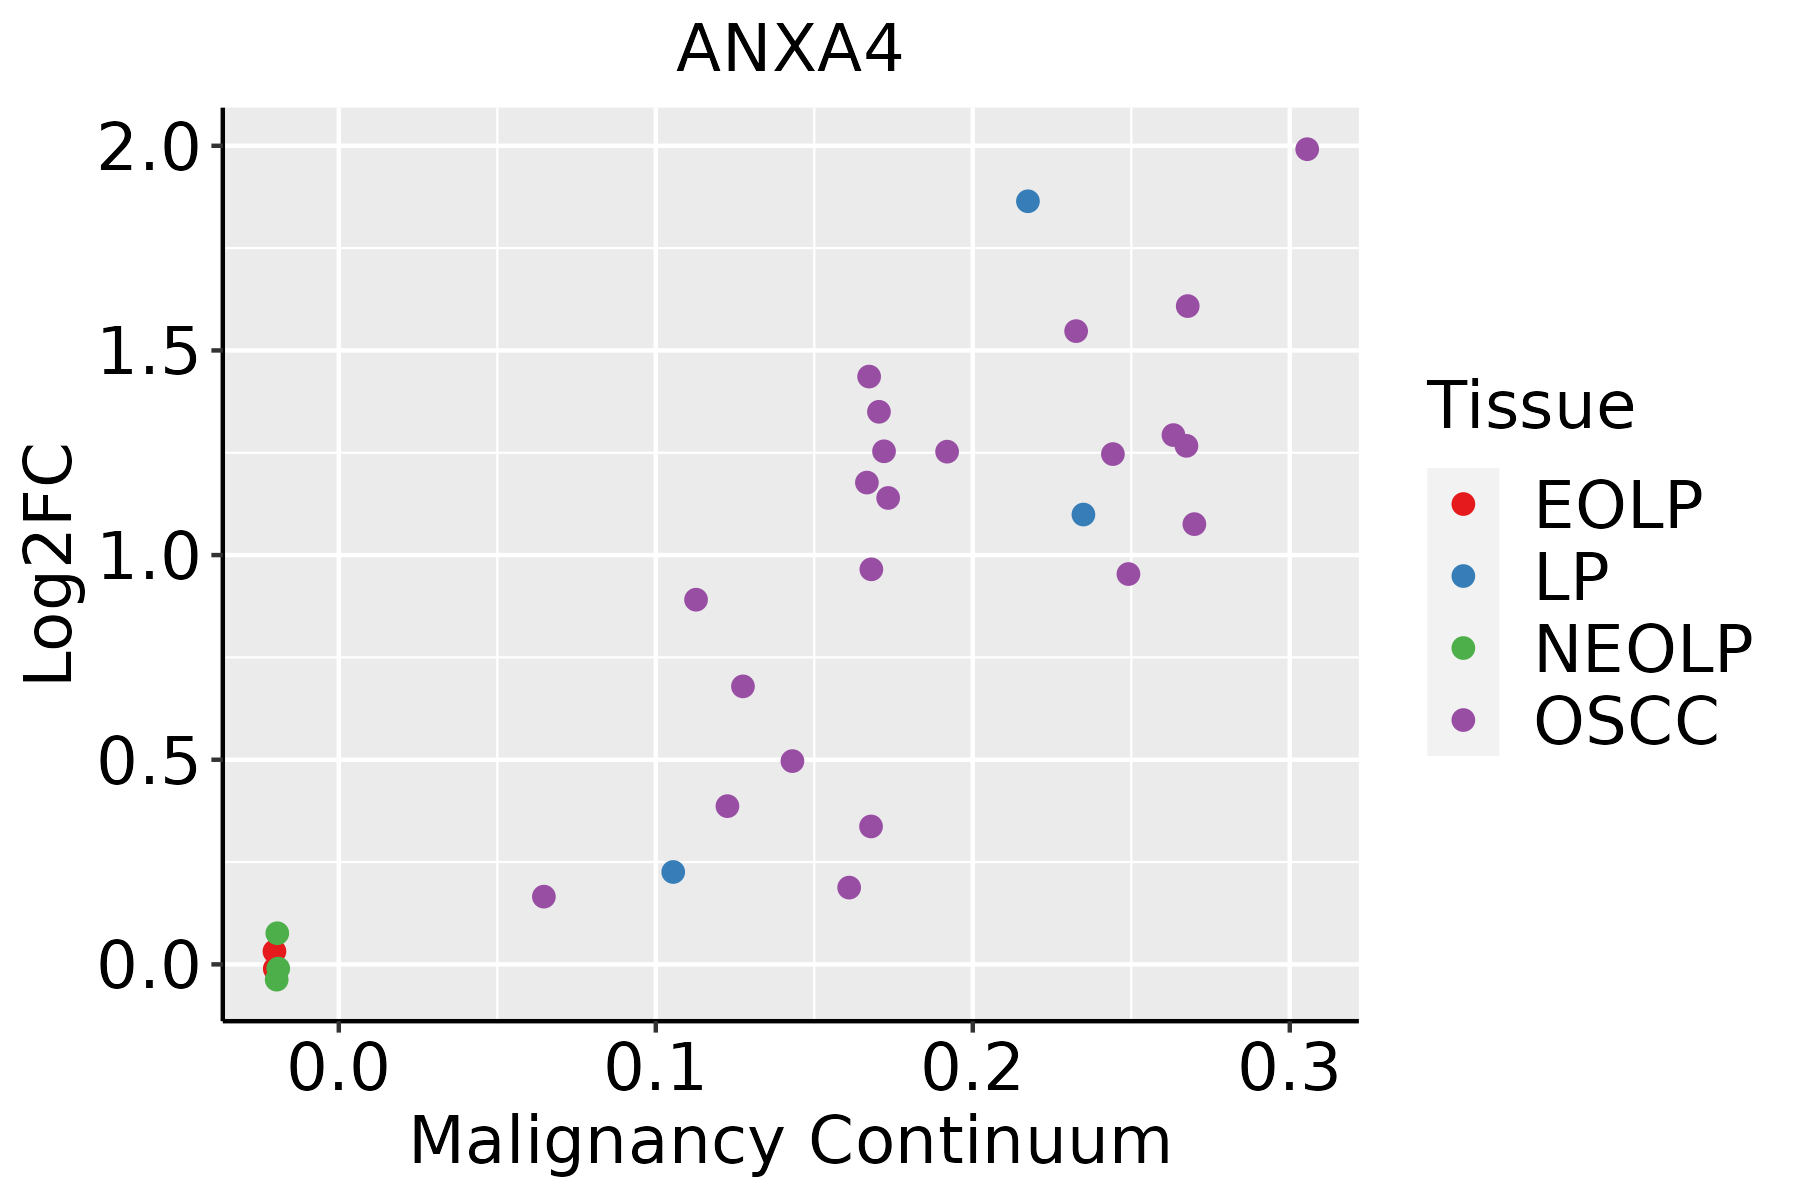 | EOLP: Erosive Oral lichen planus |
| LP: leukoplakia | ||
| NEOLP: Non-erosive oral lichen planus | ||
| OSCC: Oral squamous cell carcinoma | ||
| Skin | 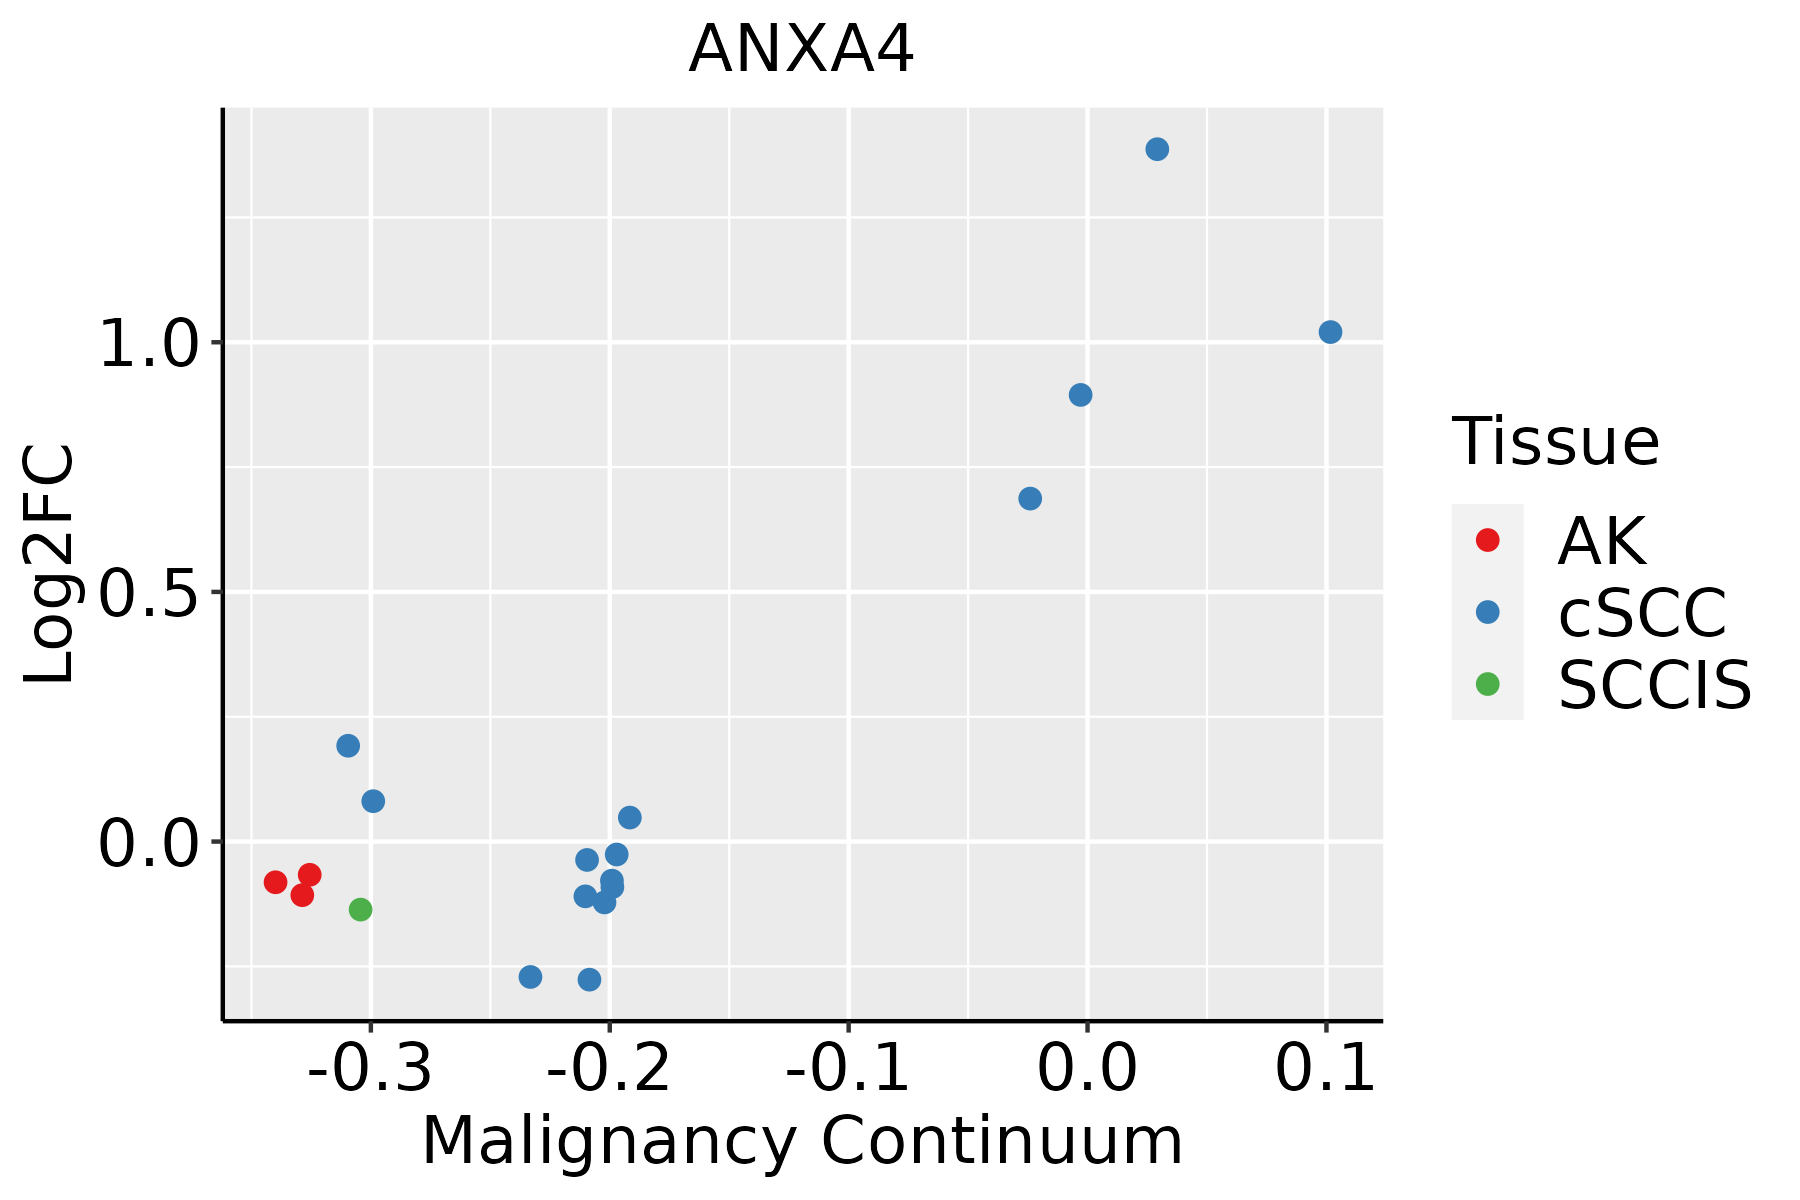 | AK: Actinic keratosis |
| cSCC: Cutaneous squamous cell carcinoma | ||
| SCCIS:squamous cell carcinoma in situ | ||
| Thyroid | 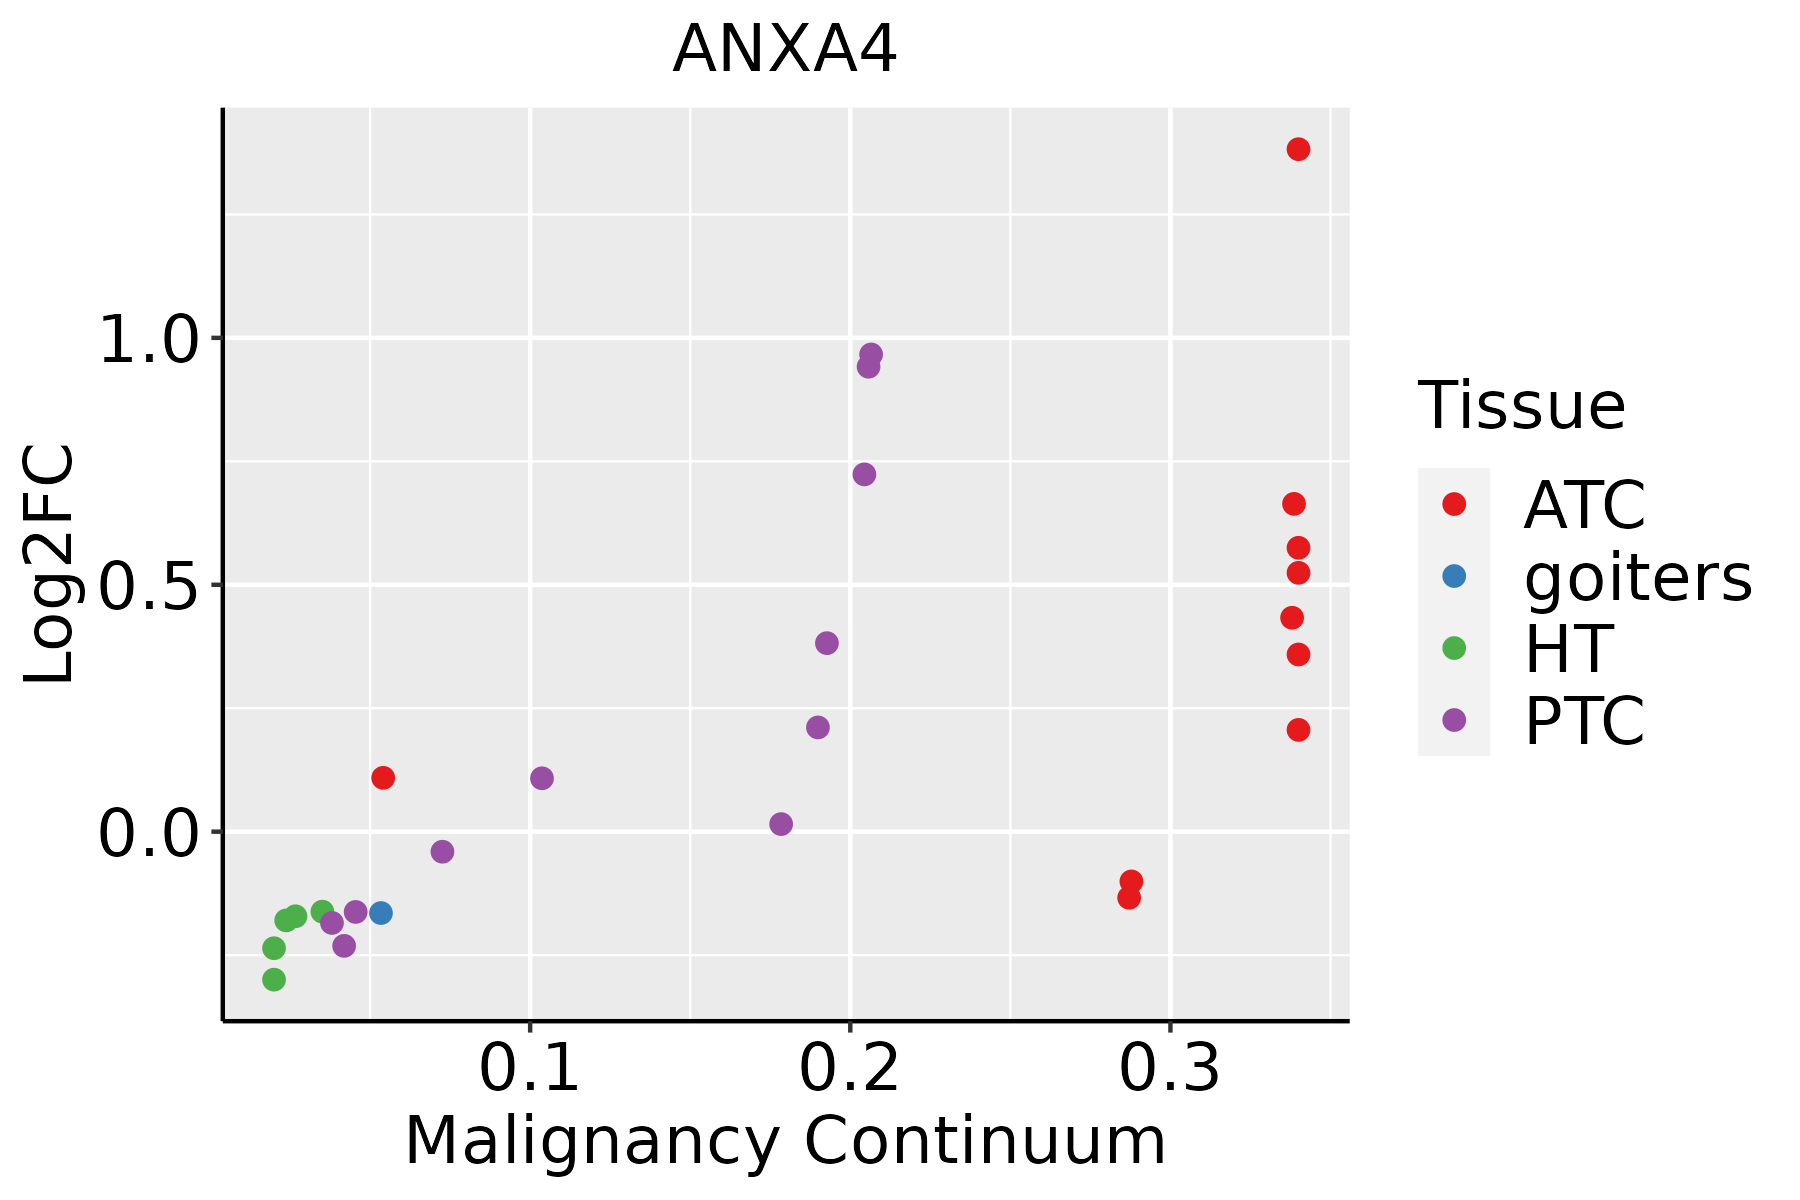 | ATC: Anaplastic thyroid cancer |
| HT: Hashimoto's thyroiditis | ||
| PTC: Papillary thyroid cancer |
| ∗log2FC in expression of this searched gene in stem-like cells from each diseased tissue sample relative to stem-like cells in normal samples in each tissue plotted against the malignancy continuum. Samples are colored based on if they are from different disease stage. |
Top |
Malignant transformation related pathway analysis |
| Find out the enriched GO biological processes and KEGG pathways involved in transition from healthy to precancer to cancer |
| Tissue | Disease Stage | Enriched GO biological Processes |
| Colorectum | AD |  |
| Colorectum | SER |  |
| Colorectum | MSS |  |
| Colorectum | MSI-H |  |
| Colorectum | FAP |  |
| ∗Top 15 enriched GO BP terms are showed in the bar plot of each disease state in each tissue. Each row represents a significant GO biological process which is colored according to the -log10(p.adjust). |
| Page: 1 2 3 4 5 6 7 8 9 |
| GO ID | Tissue | Disease Stage | Description | Gene Ratio | Bg Ratio | pvalue | p.adjust | Count |
| GO:0007219 | Colorectum | AD | Notch signaling pathway | 50/3918 | 172/18723 | 6.92e-03 | 4.26e-02 | 50 |
| GO:0051090 | Colorectum | MSS | regulation of DNA-binding transcription factor activity | 106/3467 | 440/18723 | 1.88e-03 | 1.65e-02 | 106 |
| GO:00072191 | Colorectum | FAP | Notch signaling pathway | 38/2622 | 172/18723 | 2.56e-03 | 2.01e-02 | 38 |
| GO:00510901 | Colorectum | FAP | regulation of DNA-binding transcription factor activity | 80/2622 | 440/18723 | 7.90e-03 | 4.67e-02 | 80 |
| GO:00072192 | Colorectum | CRC | Notch signaling pathway | 36/2078 | 172/18723 | 1.26e-04 | 2.42e-03 | 36 |
| GO:00510908 | Esophagus | ESCC | regulation of DNA-binding transcription factor activity | 252/8552 | 440/18723 | 5.22e-07 | 6.97e-06 | 252 |
| GO:00072197 | Esophagus | ESCC | Notch signaling pathway | 106/8552 | 172/18723 | 1.74e-05 | 1.55e-04 | 106 |
| GO:00434332 | Esophagus | ESCC | negative regulation of DNA-binding transcription factor activity | 103/8552 | 185/18723 | 3.86e-03 | 1.57e-02 | 103 |
| GO:00320882 | Esophagus | ESCC | negative regulation of NF-kappaB transcription factor activity | 54/8552 | 93/18723 | 1.08e-02 | 3.67e-02 | 54 |
| GO:00510902 | Liver | HCC | regulation of DNA-binding transcription factor activity | 220/7958 | 440/18723 | 8.04e-04 | 4.82e-03 | 220 |
| GO:00510907 | Oral cavity | OSCC | regulation of DNA-binding transcription factor activity | 221/7305 | 440/18723 | 9.06e-07 | 1.23e-05 | 221 |
| GO:00072196 | Oral cavity | OSCC | Notch signaling pathway | 92/7305 | 172/18723 | 7.84e-05 | 6.08e-04 | 92 |
| GO:0032088 | Oral cavity | OSCC | negative regulation of NF-kappaB transcription factor activity | 47/7305 | 93/18723 | 1.55e-02 | 4.99e-02 | 47 |
| GO:005109015 | Oral cavity | LP | regulation of DNA-binding transcription factor activity | 147/4623 | 440/18723 | 2.00e-05 | 3.35e-04 | 147 |
| GO:0043433 | Oral cavity | LP | negative regulation of DNA-binding transcription factor activity | 61/4623 | 185/18723 | 6.68e-03 | 3.89e-02 | 61 |
| GO:000721913 | Oral cavity | LP | Notch signaling pathway | 57/4623 | 172/18723 | 7.60e-03 | 4.18e-02 | 57 |
| GO:000721922 | Skin | cSCC | Notch signaling pathway | 60/4864 | 172/18723 | 5.82e-03 | 2.87e-02 | 60 |
| GO:0032677 | Stomach | CAG | regulation of interleukin-8 production | 10/552 | 102/18723 | 8.58e-04 | 1.28e-02 | 10 |
| GO:0032637 | Stomach | CAG | interleukin-8 production | 10/552 | 103/18723 | 9.26e-04 | 1.37e-02 | 10 |
| GO:00326771 | Stomach | WIM | regulation of interleukin-8 production | 9/426 | 102/18723 | 5.32e-04 | 9.21e-03 | 9 |
| Page: 1 2 |
| Pathway ID | Tissue | Disease Stage | Description | Gene Ratio | Bg Ratio | pvalue | p.adjust | qvalue | Count |
| Page: 1 |
Top |
Cell-cell communication analysis |
| Identification of potential cell-cell interactions between two cell types and their ligand-receptor pairs for different disease states |
| Ligand | Receptor | LRpair | Pathway | Tissue | Disease Stage |
| Page: 1 |
Top |
Single-cell gene regulatory network inference analysis |
| Find out the significant the regulons (TFs) and the target genes of each regulon across cell types for different disease states |
| TF | Cell Type | Tissue | Disease Stage | Target Gene | RSS | Regulon Activity |
| ∗The dot plots of a searched regulon are shown for all cell subpopulations in each disease state of each tissue based on the regulon specific score inferred using pySCENIC and by calculating the average expression. |
| Page: 1 |
Top |
Somatic mutation of malignant transformation related genes |
| Annotation of somatic variants for genes involved in malignant transformation |
| Hugo Symbol | Variant Class | Variant Classification | dbSNP RS | HGVSc | HGVSp | HGVSp Short | SWISSPROT | BIOTYPE | SIFT | PolyPhen | Tumor Sample Barcode | Tissue | Histology | Sex | Age | Stage | Therapy Types | Drugs | Outcome |
| ANXA4 | SNV | Missense_Mutation | novel | c.205N>A | p.Asp69Asn | p.D69N | P09525 | protein_coding | deleterious(0.01) | probably_damaging(0.988) | TCGA-AN-A046-01 | Breast | breast invasive carcinoma | Female | >=65 | I/II | Unknown | Unknown | SD |
| ANXA4 | SNV | Missense_Mutation | c.303G>A | p.Met101Ile | p.M101I | P09525 | protein_coding | tolerated(0.76) | benign(0.007) | TCGA-BH-A18P-01 | Breast | breast invasive carcinoma | Female | <65 | I/II | Unknown | Unknown | PD | |
| ANXA4 | SNV | Missense_Mutation | c.850N>A | p.Asp284Asn | p.D284N | P09525 | protein_coding | tolerated(0.15) | probably_damaging(0.924) | TCGA-D8-A1JA-01 | Breast | breast invasive carcinoma | Female | <65 | III/IV | Chemotherapy | adriamycin | PD | |
| ANXA4 | SNV | Missense_Mutation | rs770362785 | c.374G>A | p.Arg125His | p.R125H | P09525 | protein_coding | deleterious(0.05) | benign(0.001) | TCGA-2W-A8YY-01 | Cervix | cervical & endocervical cancer | Female | <65 | I/II | Chemotherapy | cisplatin | CR |
| ANXA4 | SNV | Missense_Mutation | novel | c.380G>A | p.Ser127Asn | p.S127N | P09525 | protein_coding | tolerated(0.71) | benign(0) | TCGA-VS-A8QA-01 | Cervix | cervical & endocervical cancer | Female | <65 | I/II | Unknown | Unknown | SD |
| ANXA4 | SNV | Missense_Mutation | rs376382183 | c.112G>A | p.Ala38Thr | p.A38T | P09525 | protein_coding | tolerated(0.23) | benign(0.04) | TCGA-AA-3663-01 | Colorectum | colon adenocarcinoma | Male | <65 | I/II | Unknown | Unknown | SD |
| ANXA4 | SNV | Missense_Mutation | c.680A>C | p.Lys227Thr | p.K227T | P09525 | protein_coding | tolerated(0.07) | possibly_damaging(0.782) | TCGA-AA-3977-01 | Colorectum | colon adenocarcinoma | Male | >=65 | I/II | Unknown | Unknown | SD | |
| ANXA4 | SNV | Missense_Mutation | c.655N>G | p.Gln219Glu | p.Q219E | P09525 | protein_coding | tolerated(0.06) | benign(0.007) | TCGA-AA-A010-01 | Colorectum | colon adenocarcinoma | Female | <65 | I/II | Chemotherapy | folinic | CR | |
| ANXA4 | SNV | Missense_Mutation | c.827N>T | p.Ser276Phe | p.S276F | P09525 | protein_coding | deleterious(0) | probably_damaging(0.994) | TCGA-CM-5864-01 | Colorectum | colon adenocarcinoma | Male | <65 | I/II | Unknown | Unknown | SD | |
| ANXA4 | SNV | Missense_Mutation | rs778785400 | c.314N>A | p.Gly105Asp | p.G105D | P09525 | protein_coding | deleterious(0) | probably_damaging(0.975) | TCGA-A5-A0G2-01 | Endometrium | uterine corpus endometrioid carcinoma | Female | <65 | III/IV | Unknown | Unknown | SD |
| Page: 1 2 3 4 |
Top |
Related drugs of malignant transformation related genes |
| Identification of chemicals and drugs interact with genes involved in malignant transfromation |
| (DGIdb 4.0) |
| Entrez ID | Symbol | Category | Interaction Types | Drug Claim Name | Drug Name | PMIDs |
| Page: 1 |

Copyright 2023-Present -The University of Texas Health Science Center at Houston |