
|
|||||
|
 | |
| |
| |
| |
| |
| |
|
Gene: ANXA2 |
Gene summary for ANXA2 |
| Gene information | Species | Human | Gene symbol | ANXA2 | Gene ID | 302 |
| Gene name | annexin A2 | |
| Gene Alias | ANX2 | |
| Cytomap | 15q22.2 | |
| Gene Type | protein-coding | GO ID | GO:0001501 | UniProtAcc | A0A024R5Z7 |
Top |
Malignant transformation analysis |
| Identification of the aberrant gene expression in precancerous and cancerous lesions by comparing the gene expression of stem-like cells in diseased tissues with normal stem cells |
| Entrez ID | Symbol | Replicates | Species | Organ | Tissue | Adj P-value | Log2FC | Malignancy |
| 302 | ANXA2 | GSM4909282 | Human | Breast | IDC | 7.09e-78 | 6.87e-01 | -0.0288 |
| 302 | ANXA2 | GSM4909285 | Human | Breast | IDC | 8.77e-04 | 5.95e-02 | 0.21 |
| 302 | ANXA2 | GSM4909286 | Human | Breast | IDC | 3.15e-39 | -6.38e-01 | 0.1081 |
| 302 | ANXA2 | GSM4909291 | Human | Breast | IDC | 1.43e-08 | -5.83e-01 | 0.1753 |
| 302 | ANXA2 | GSM4909292 | Human | Breast | IDC | 5.01e-05 | -8.90e-01 | 0.1236 |
| 302 | ANXA2 | GSM4909293 | Human | Breast | IDC | 2.30e-30 | -6.50e-01 | 0.1581 |
| 302 | ANXA2 | GSM4909294 | Human | Breast | IDC | 1.95e-07 | -4.66e-01 | 0.2022 |
| 302 | ANXA2 | GSM4909295 | Human | Breast | IDC | 5.58e-05 | 3.11e-01 | 0.0898 |
| 302 | ANXA2 | GSM4909297 | Human | Breast | IDC | 2.61e-14 | -4.27e-01 | 0.1517 |
| 302 | ANXA2 | GSM4909298 | Human | Breast | IDC | 9.46e-37 | -8.36e-01 | 0.1551 |
| 302 | ANXA2 | GSM4909301 | Human | Breast | IDC | 3.06e-16 | -6.16e-01 | 0.1577 |
| 302 | ANXA2 | GSM4909304 | Human | Breast | IDC | 1.43e-02 | 5.49e-02 | 0.1636 |
| 302 | ANXA2 | GSM4909306 | Human | Breast | IDC | 1.43e-02 | -2.01e-01 | 0.1564 |
| 302 | ANXA2 | GSM4909308 | Human | Breast | IDC | 3.73e-02 | -1.92e-01 | 0.158 |
| 302 | ANXA2 | GSM4909311 | Human | Breast | IDC | 1.09e-28 | -3.31e-01 | 0.1534 |
| 302 | ANXA2 | GSM4909312 | Human | Breast | IDC | 3.99e-02 | -1.92e-01 | 0.1552 |
| 302 | ANXA2 | GSM4909317 | Human | Breast | IDC | 2.05e-03 | -3.10e-01 | 0.1355 |
| 302 | ANXA2 | GSM4909318 | Human | Breast | IDC | 4.11e-10 | -1.04e+00 | 0.2031 |
| 302 | ANXA2 | GSM4909319 | Human | Breast | IDC | 6.28e-44 | -5.31e-01 | 0.1563 |
| 302 | ANXA2 | GSM4909320 | Human | Breast | IDC | 7.42e-14 | -7.92e-01 | 0.1575 |
| Page: 1 2 3 4 5 6 7 8 9 10 11 12 13 14 15 16 17 18 19 20 |
| Tissue | Expression Dynamics | Abbreviation |
| Breast | 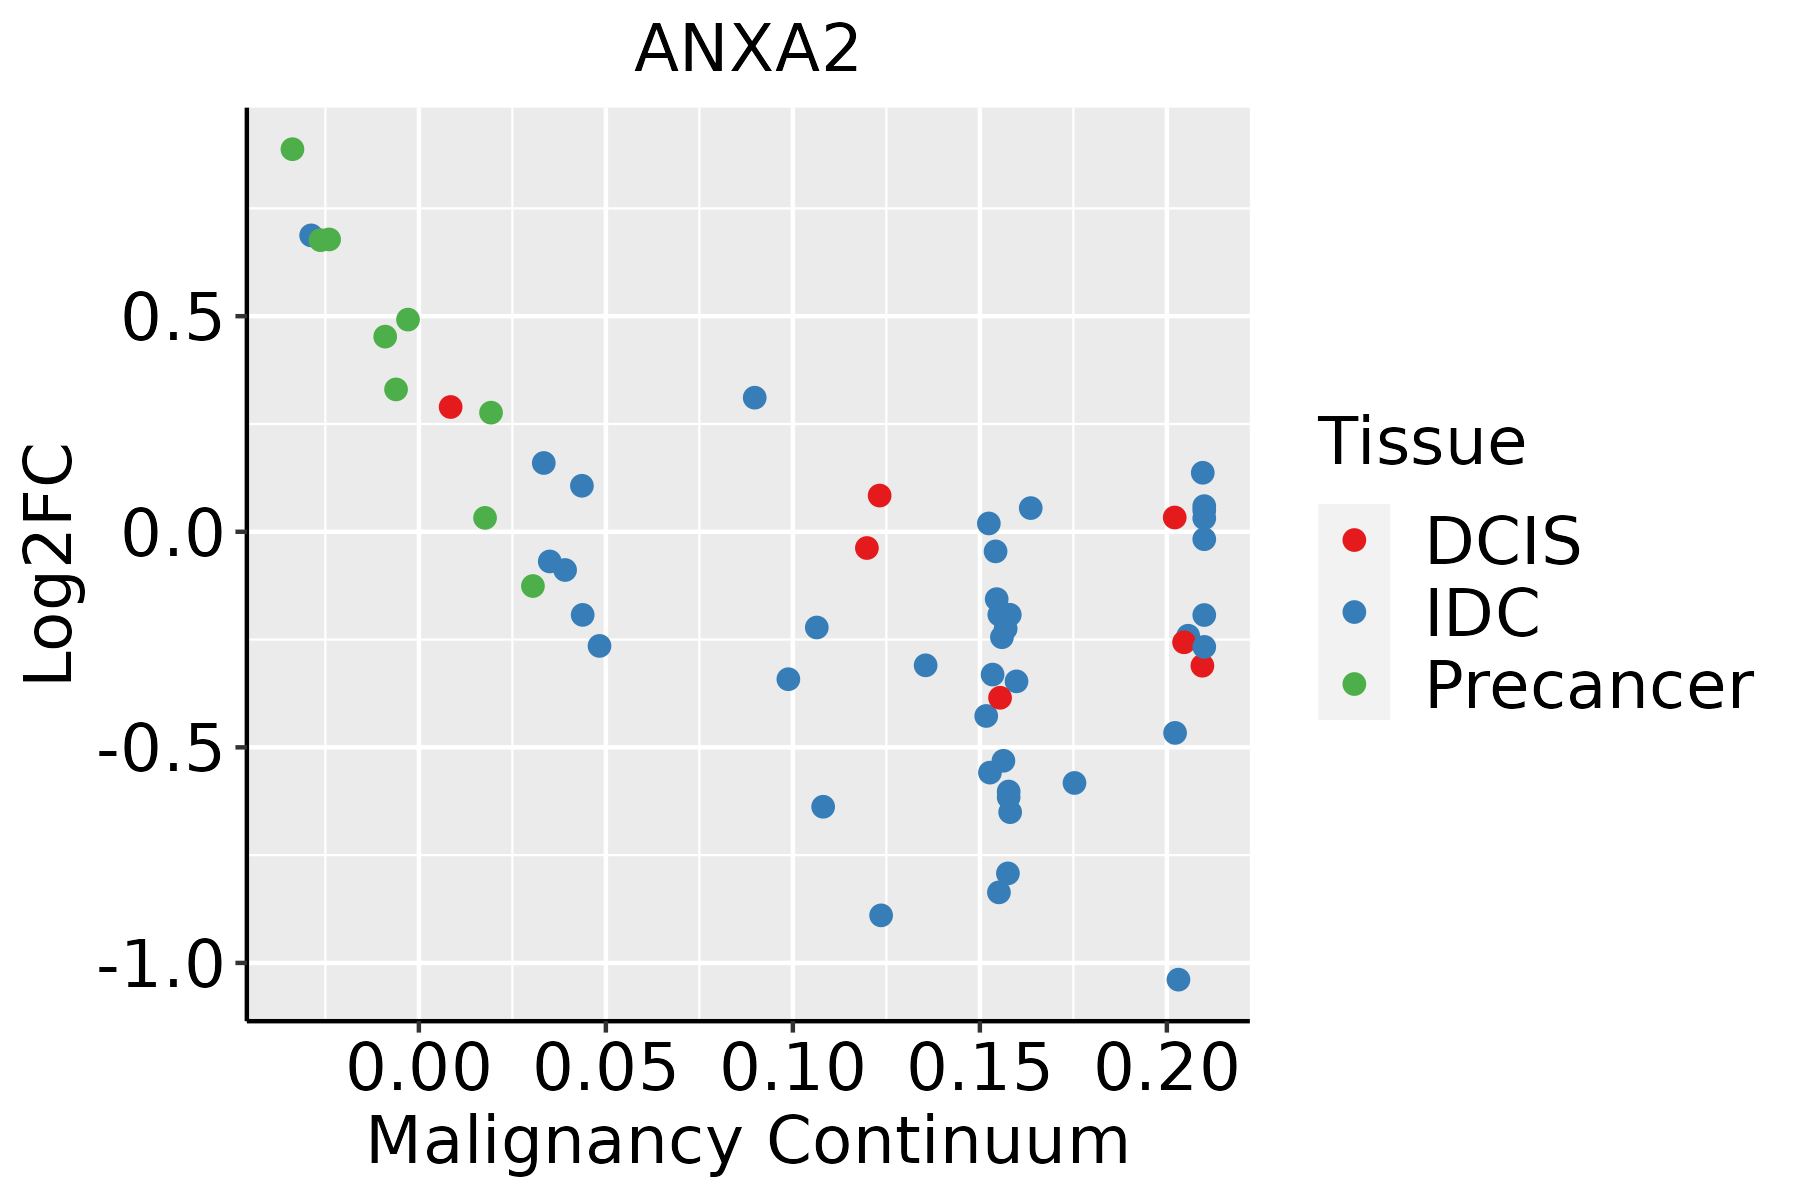 | IDC: Invasive ductal carcinoma |
| DCIS: Ductal carcinoma in situ | ||
| Precancer(BRCA1-mut): Precancerous lesion from BRCA1 mutation carriers | ||
| Cervix |  | CC: Cervix cancer |
| HSIL_HPV: HPV-infected high-grade squamous intraepithelial lesions | ||
| N_HPV: HPV-infected normal cervix | ||
| Colorectum (GSE201348) |  | FAP: Familial adenomatous polyposis |
| CRC: Colorectal cancer | ||
| Colorectum (HTA11) |  | AD: Adenomas |
| SER: Sessile serrated lesions | ||
| MSI-H: Microsatellite-high colorectal cancer | ||
| MSS: Microsatellite stable colorectal cancer | ||
| Endometrium | 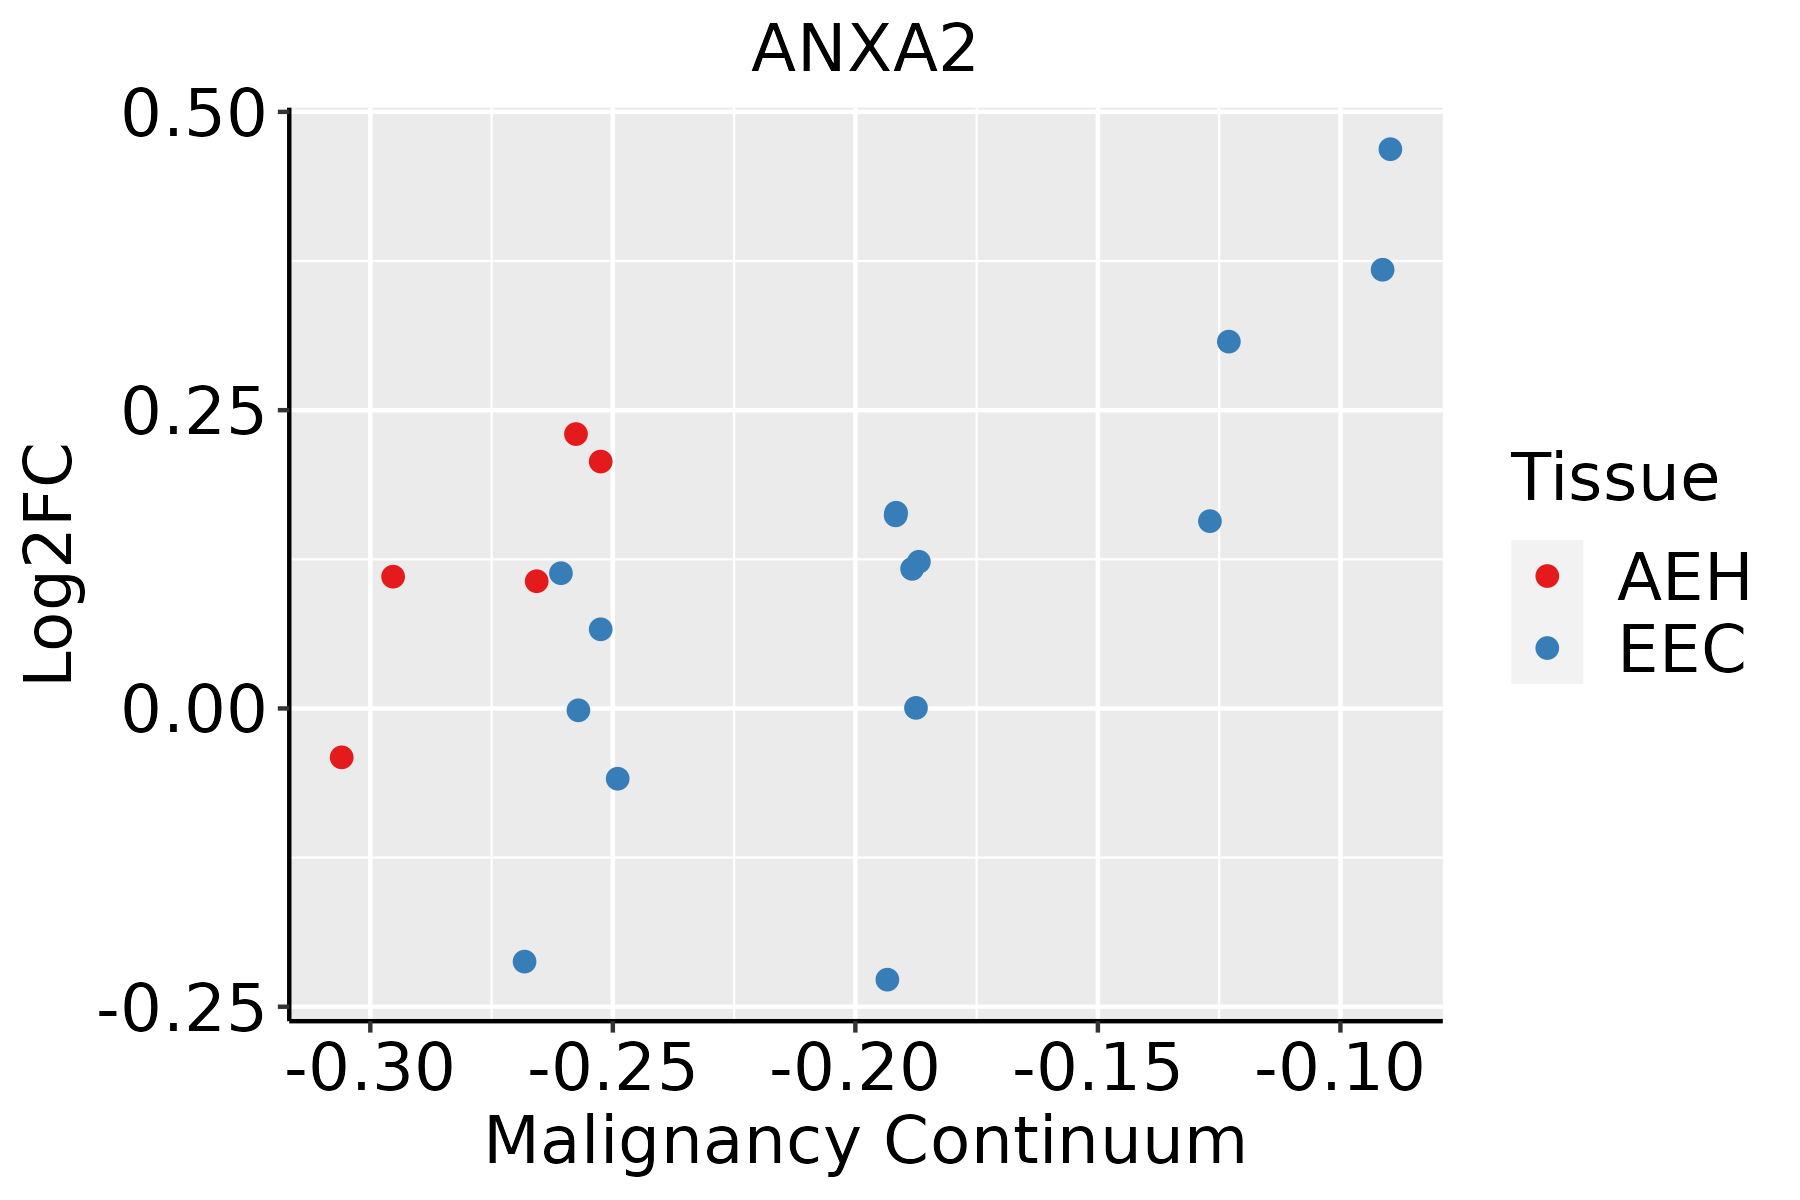 | AEH: Atypical endometrial hyperplasia |
| EEC: Endometrioid Cancer | ||
| Esophagus | 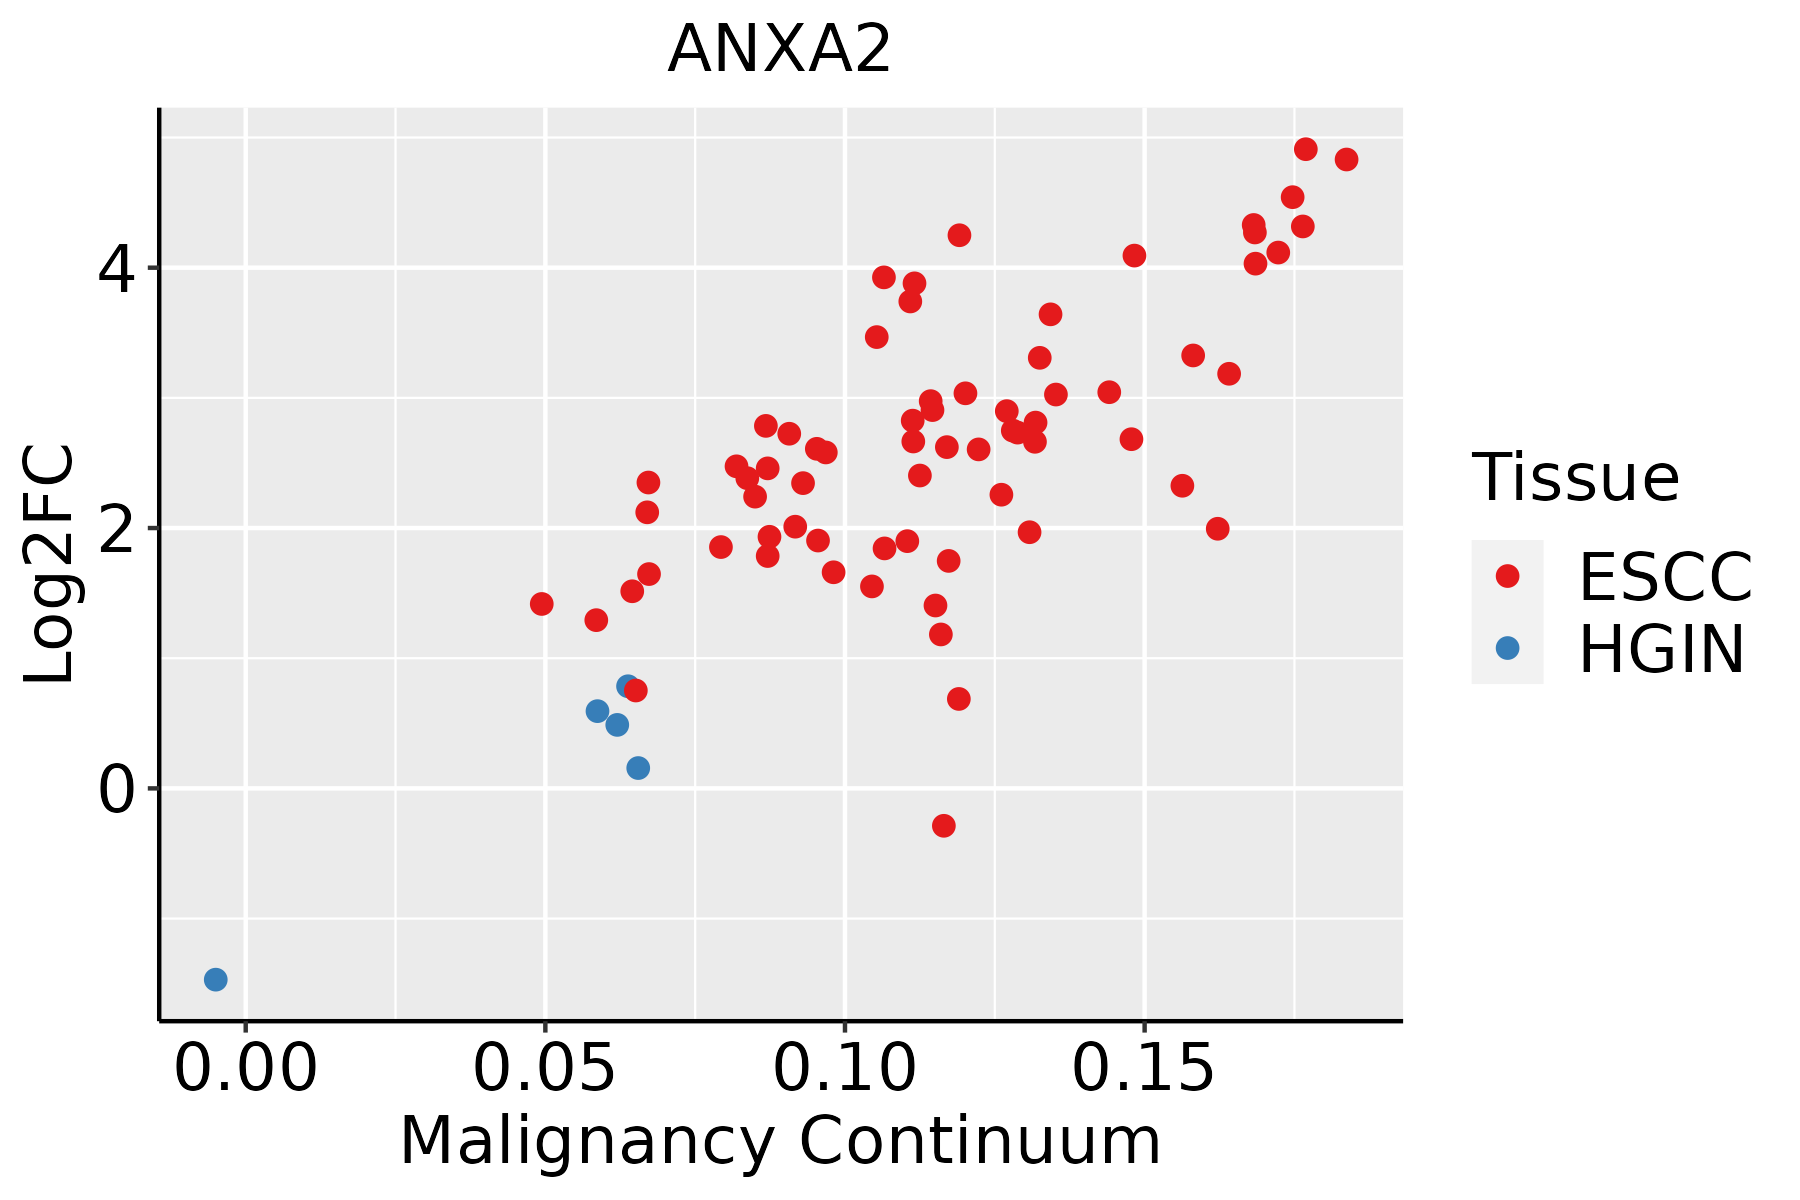 | ESCC: Esophageal squamous cell carcinoma |
| HGIN: High-grade intraepithelial neoplasias | ||
| LGIN: Low-grade intraepithelial neoplasias | ||
| GC |  | CAG: Chronic atrophic gastritis |
| CAG with IM: Chronic atrophic gastritis with intestinal metaplasia | ||
| CSG: Chronic superficial gastritis | ||
| GC: Gastric cancer | ||
| SIM: Severe intestinal metaplasia | ||
| WIM: Wild intestinal metaplasia | ||
| Liver | 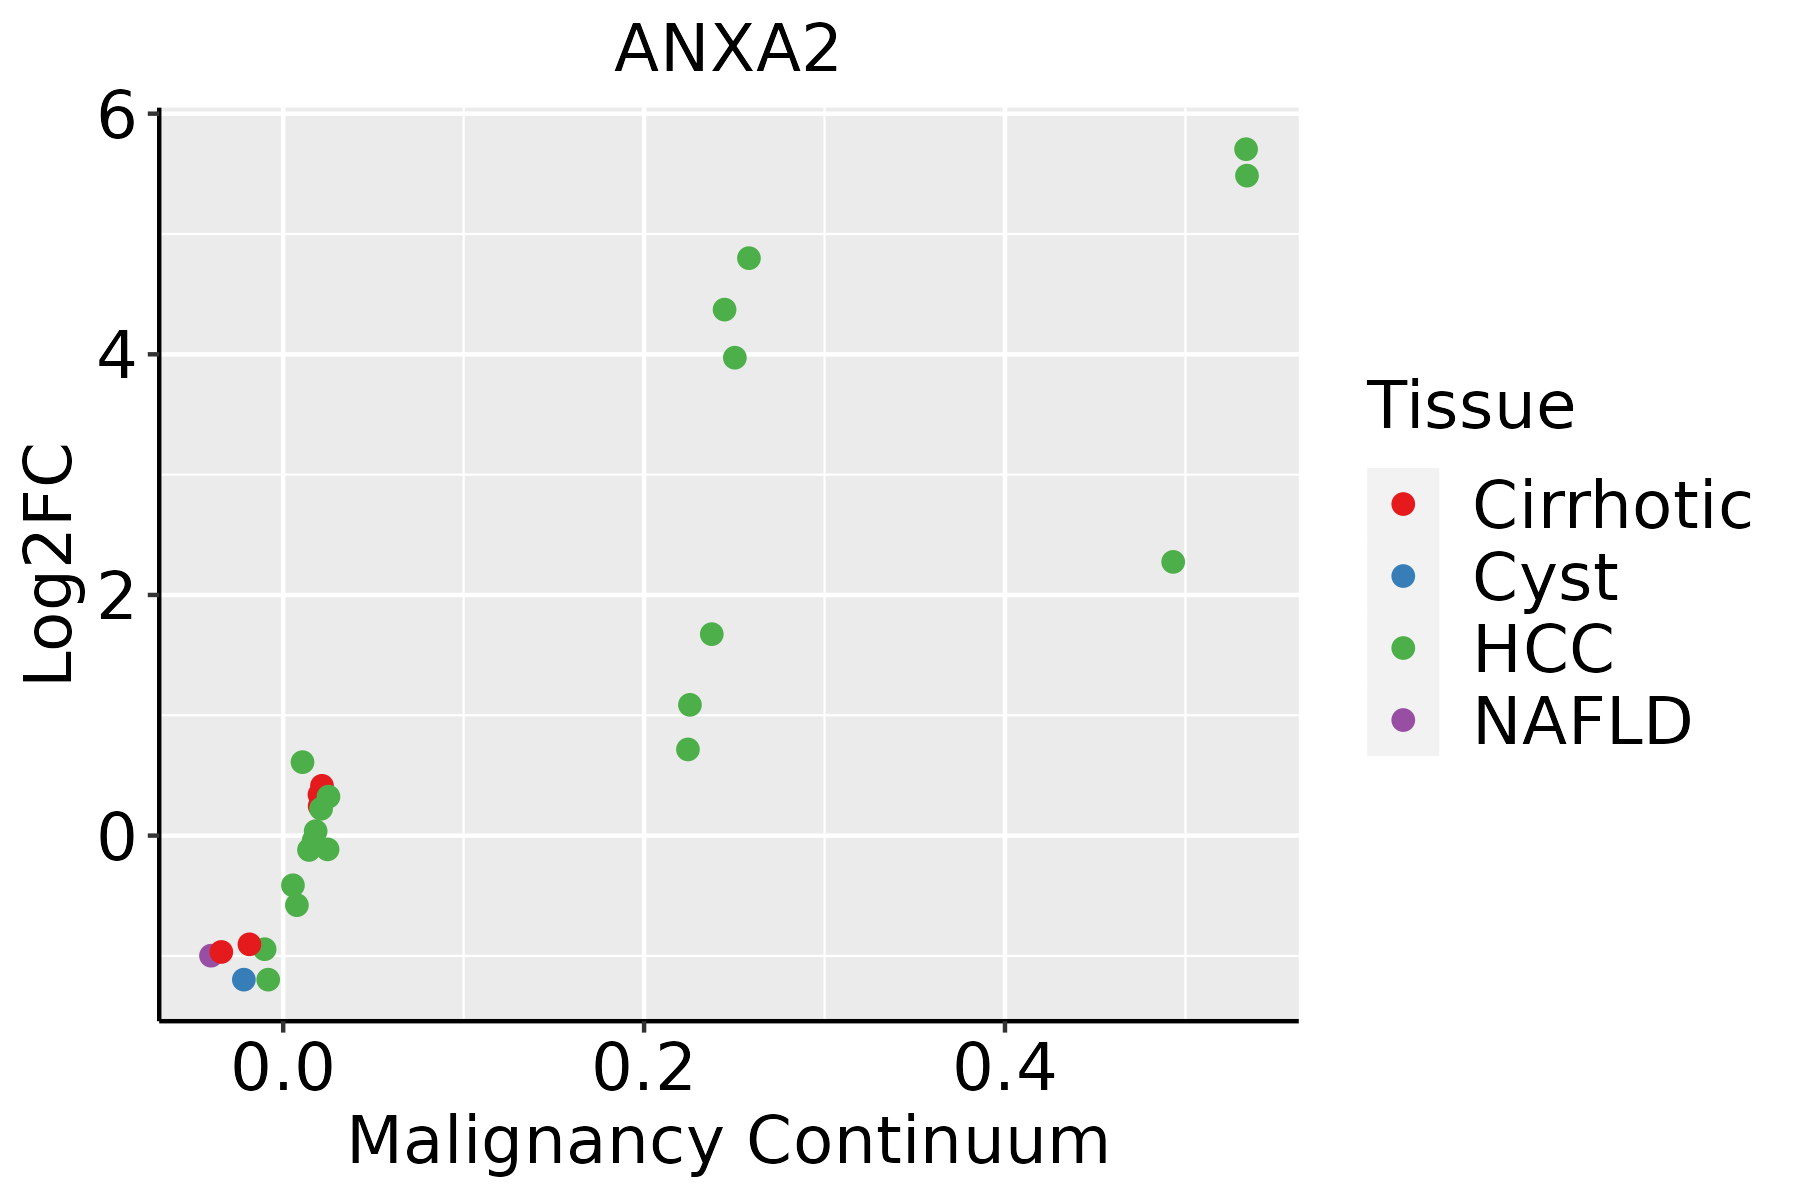 | HCC: Hepatocellular carcinoma |
| NAFLD: Non-alcoholic fatty liver disease | ||
| Lung | 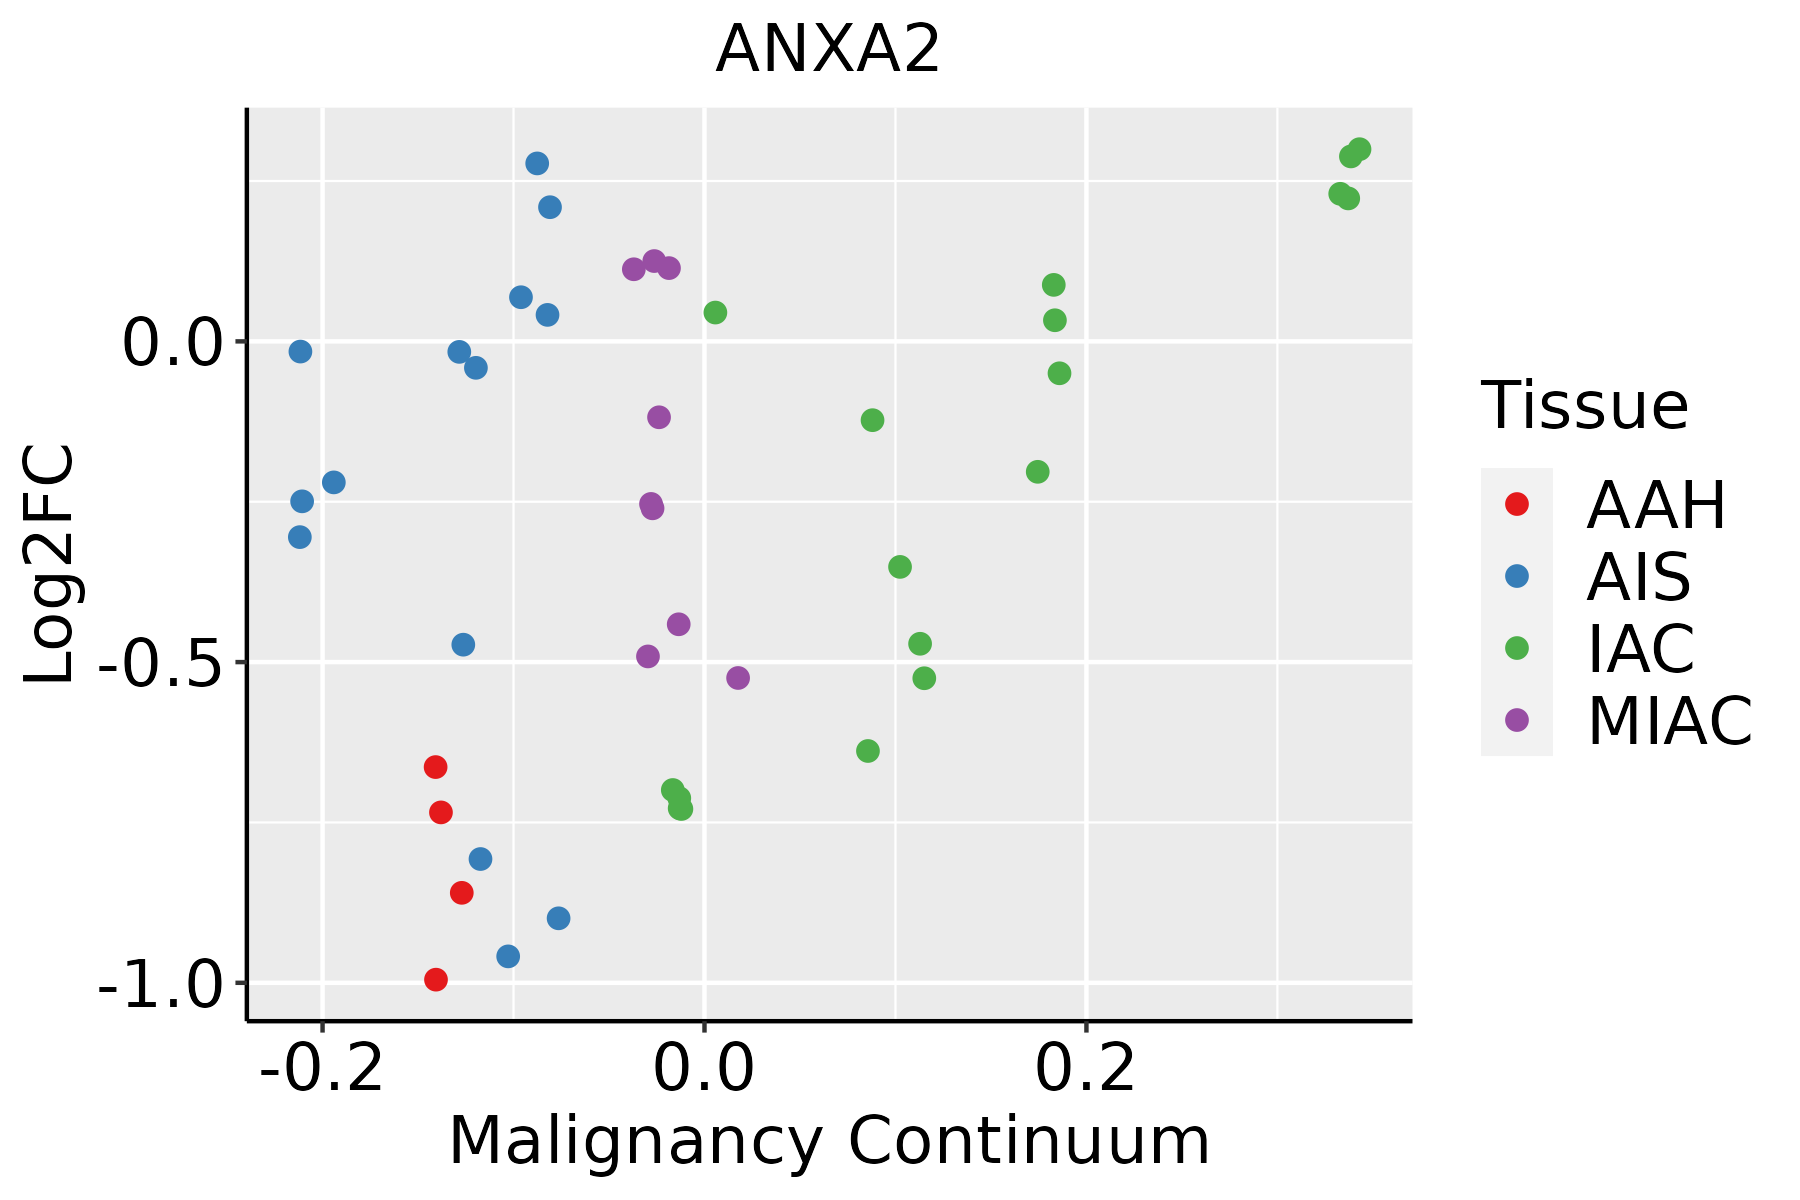 | AAH: Atypical adenomatous hyperplasia |
| AIS: Adenocarcinoma in situ | ||
| IAC: Invasive lung adenocarcinoma | ||
| MIA: Minimally invasive adenocarcinoma | ||
| Oral Cavity |  | EOLP: Erosive Oral lichen planus |
| LP: leukoplakia | ||
| NEOLP: Non-erosive oral lichen planus | ||
| OSCC: Oral squamous cell carcinoma | ||
| Prostate |  | BPH: Benign Prostatic Hyperplasia |
| Skin | 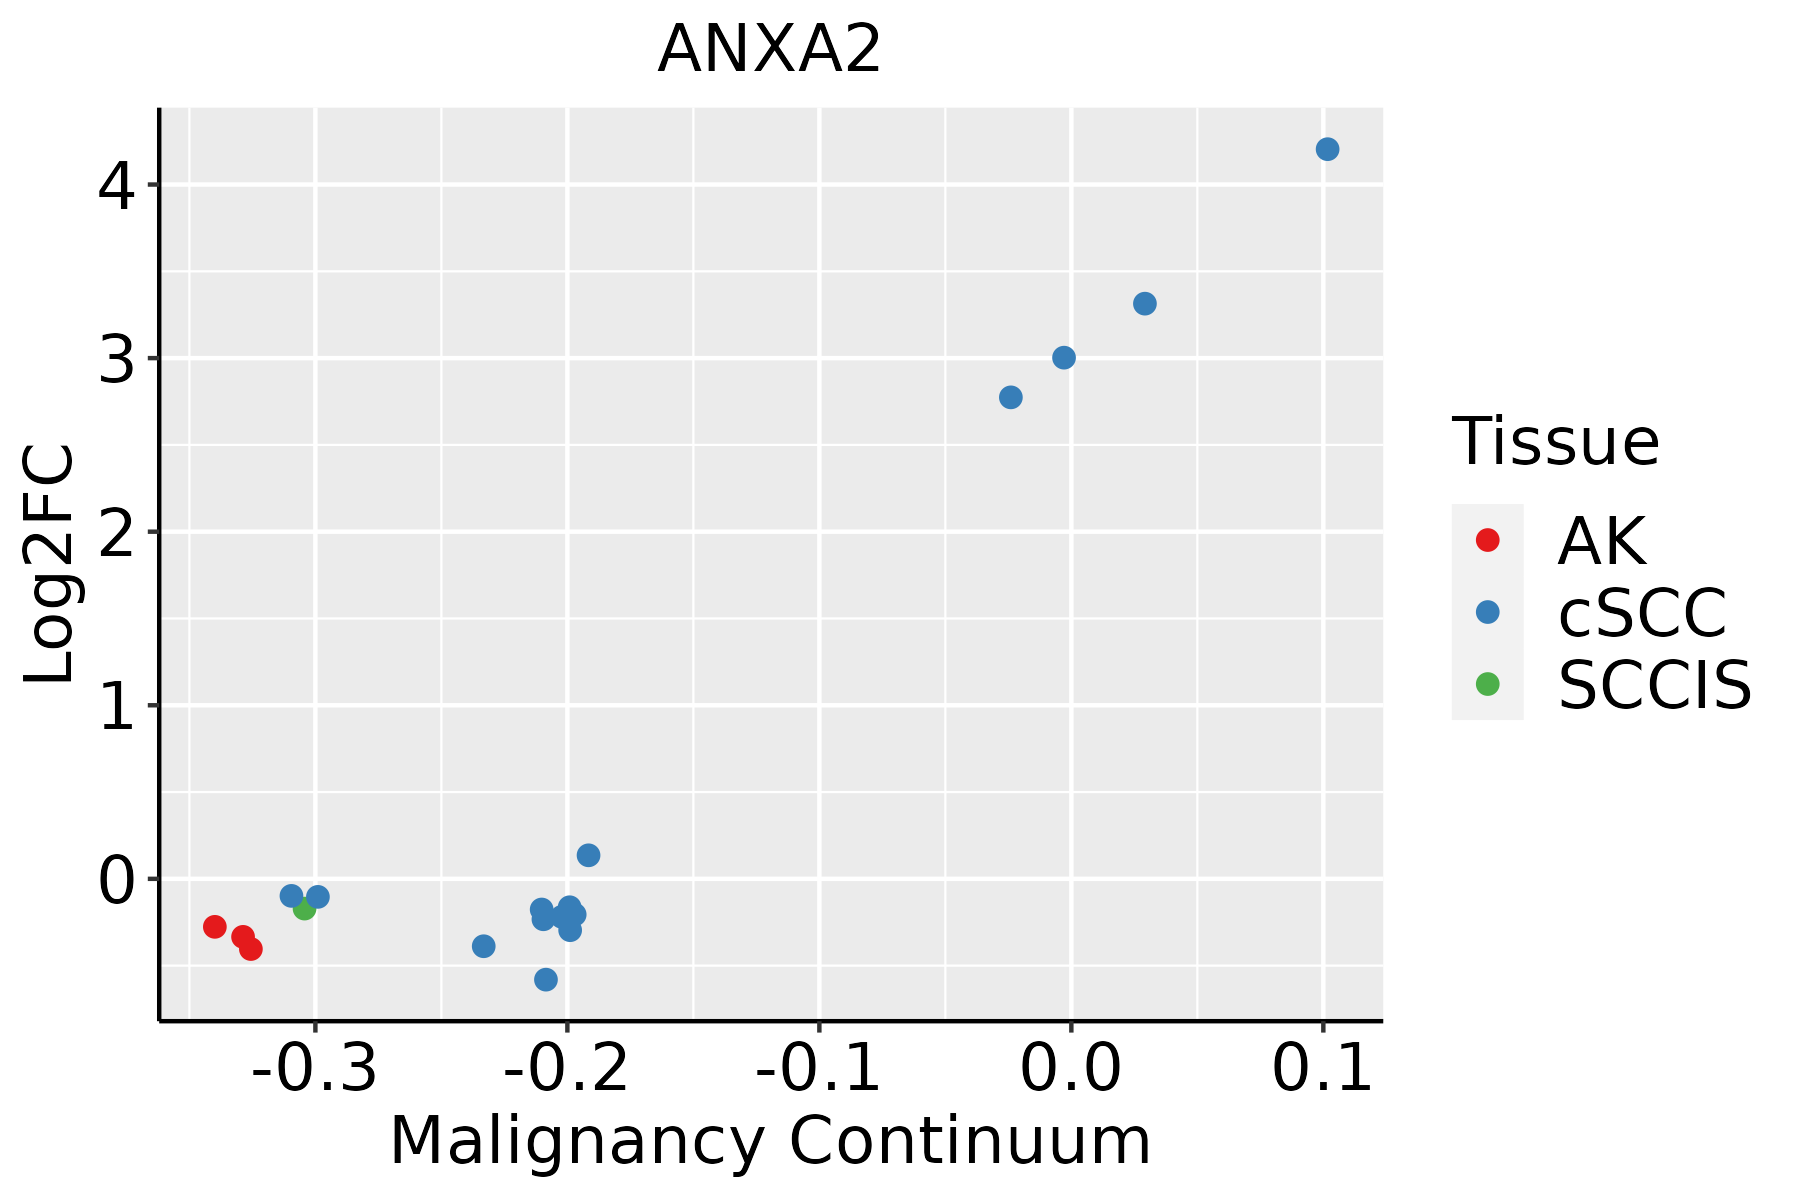 | AK: Actinic keratosis |
| cSCC: Cutaneous squamous cell carcinoma | ||
| SCCIS:squamous cell carcinoma in situ | ||
| Thyroid |  | ATC: Anaplastic thyroid cancer |
| HT: Hashimoto's thyroiditis | ||
| PTC: Papillary thyroid cancer |
| ∗log2FC in expression of this searched gene in stem-like cells from each diseased tissue sample relative to stem-like cells in normal samples in each tissue plotted against the malignancy continuum. Samples are colored based on if they are from different disease stage. |
Top |
Malignant transformation related pathway analysis |
| Find out the enriched GO biological processes and KEGG pathways involved in transition from healthy to precancer to cancer |
| Tissue | Disease Stage | Enriched GO biological Processes |
| Colorectum | AD |  |
| Colorectum | SER |  |
| Colorectum | MSS |  |
| Colorectum | MSI-H |  |
| Colorectum | FAP |  |
| ∗Top 15 enriched GO BP terms are showed in the bar plot of each disease state in each tissue. Each row represents a significant GO biological process which is colored according to the -log10(p.adjust). |
| Page: 1 2 3 4 5 6 7 8 9 |
| GO ID | Tissue | Disease Stage | Description | Gene Ratio | Bg Ratio | pvalue | p.adjust | Count |
| GO:00525479 | Breast | Precancer | regulation of peptidase activity | 71/1080 | 461/18723 | 2.72e-14 | 6.94e-12 | 71 |
| GO:00525489 | Breast | Precancer | regulation of endopeptidase activity | 67/1080 | 432/18723 | 1.06e-13 | 2.36e-11 | 67 |
| GO:00458619 | Breast | Precancer | negative regulation of proteolysis | 50/1080 | 351/18723 | 2.99e-09 | 2.39e-07 | 50 |
| GO:00513468 | Breast | Precancer | negative regulation of hydrolase activity | 50/1080 | 379/18723 | 3.85e-08 | 2.34e-06 | 50 |
| GO:00104668 | Breast | Precancer | negative regulation of peptidase activity | 38/1080 | 262/18723 | 1.46e-07 | 7.82e-06 | 38 |
| GO:00109519 | Breast | Precancer | negative regulation of endopeptidase activity | 37/1080 | 252/18723 | 1.55e-07 | 8.05e-06 | 37 |
| GO:19033629 | Breast | Precancer | regulation of cellular protein catabolic process | 36/1080 | 255/18723 | 6.03e-07 | 2.55e-05 | 36 |
| GO:00421769 | Breast | Precancer | regulation of protein catabolic process | 47/1080 | 391/18723 | 1.50e-06 | 5.58e-05 | 47 |
| GO:00510989 | Breast | Precancer | regulation of binding | 44/1080 | 363/18723 | 2.59e-06 | 8.65e-05 | 44 |
| GO:00300999 | Breast | Precancer | myeloid cell differentiation | 45/1080 | 381/18723 | 4.00e-06 | 1.25e-04 | 45 |
| GO:00420609 | Breast | Precancer | wound healing | 48/1080 | 422/18723 | 5.48e-06 | 1.63e-04 | 48 |
| GO:00313309 | Breast | Precancer | negative regulation of cellular catabolic process | 34/1080 | 262/18723 | 8.16e-06 | 2.20e-04 | 34 |
| GO:00025737 | Breast | Precancer | myeloid leukocyte differentiation | 27/1080 | 208/18723 | 6.72e-05 | 1.35e-03 | 27 |
| GO:19033638 | Breast | Precancer | negative regulation of cellular protein catabolic process | 14/1080 | 75/18723 | 8.54e-05 | 1.63e-03 | 14 |
| GO:00098959 | Breast | Precancer | negative regulation of catabolic process | 36/1080 | 320/18723 | 9.92e-05 | 1.83e-03 | 36 |
| GO:00510999 | Breast | Precancer | positive regulation of binding | 23/1080 | 173/18723 | 1.58e-04 | 2.68e-03 | 23 |
| GO:00069009 | Breast | Precancer | vesicle budding from membrane | 12/1080 | 61/18723 | 1.61e-04 | 2.69e-03 | 12 |
| GO:00508789 | Breast | Precancer | regulation of body fluid levels | 40/1080 | 379/18723 | 1.68e-04 | 2.77e-03 | 40 |
| GO:00421779 | Breast | Precancer | negative regulation of protein catabolic process | 17/1080 | 121/18723 | 5.76e-04 | 7.28e-03 | 17 |
| GO:00068986 | Breast | Precancer | receptor-mediated endocytosis | 27/1080 | 244/18723 | 9.01e-04 | 1.03e-02 | 27 |
| Page: 1 2 3 4 5 6 7 8 9 10 11 12 13 14 15 16 17 18 19 20 21 22 23 24 25 26 27 28 29 30 31 32 33 34 35 36 37 38 39 40 41 42 43 44 45 46 47 48 49 50 51 52 53 54 55 56 57 58 59 60 61 62 63 64 65 66 67 68 69 70 71 72 73 74 75 76 |
| Pathway ID | Tissue | Disease Stage | Description | Gene Ratio | Bg Ratio | pvalue | p.adjust | qvalue | Count |
| hsa0513218 | Breast | Precancer | Salmonella infection | 49/684 | 249/8465 | 2.92e-09 | 6.15e-08 | 4.71e-08 | 49 |
| hsa0513219 | Breast | Precancer | Salmonella infection | 49/684 | 249/8465 | 2.92e-09 | 6.15e-08 | 4.71e-08 | 49 |
| hsa0513224 | Breast | IDC | Salmonella infection | 55/867 | 249/8465 | 2.07e-08 | 4.49e-07 | 3.36e-07 | 55 |
| hsa0513234 | Breast | IDC | Salmonella infection | 55/867 | 249/8465 | 2.07e-08 | 4.49e-07 | 3.36e-07 | 55 |
| hsa0513243 | Breast | DCIS | Salmonella infection | 55/846 | 249/8465 | 8.71e-09 | 1.87e-07 | 1.38e-07 | 55 |
| hsa0513253 | Breast | DCIS | Salmonella infection | 55/846 | 249/8465 | 8.71e-09 | 1.87e-07 | 1.38e-07 | 55 |
| hsa0513220 | Cervix | CC | Salmonella infection | 74/1267 | 249/8465 | 1.33e-09 | 2.54e-08 | 1.50e-08 | 74 |
| hsa05132110 | Cervix | CC | Salmonella infection | 74/1267 | 249/8465 | 1.33e-09 | 2.54e-08 | 1.50e-08 | 74 |
| hsa0513225 | Cervix | HSIL_HPV | Salmonella infection | 34/459 | 249/8465 | 5.03e-07 | 1.13e-05 | 9.17e-06 | 34 |
| hsa0513235 | Cervix | HSIL_HPV | Salmonella infection | 34/459 | 249/8465 | 5.03e-07 | 1.13e-05 | 9.17e-06 | 34 |
| hsa0513244 | Cervix | N_HPV | Salmonella infection | 28/349 | 249/8465 | 1.18e-06 | 1.64e-05 | 1.28e-05 | 28 |
| hsa0513254 | Cervix | N_HPV | Salmonella infection | 28/349 | 249/8465 | 1.18e-06 | 1.64e-05 | 1.28e-05 | 28 |
| hsa05132 | Colorectum | AD | Salmonella infection | 102/2092 | 249/8465 | 7.65e-09 | 1.28e-07 | 8.17e-08 | 102 |
| hsa051321 | Colorectum | AD | Salmonella infection | 102/2092 | 249/8465 | 7.65e-09 | 1.28e-07 | 8.17e-08 | 102 |
| hsa051322 | Colorectum | SER | Salmonella infection | 77/1580 | 249/8465 | 1.56e-06 | 2.35e-05 | 1.71e-05 | 77 |
| hsa051323 | Colorectum | SER | Salmonella infection | 77/1580 | 249/8465 | 1.56e-06 | 2.35e-05 | 1.71e-05 | 77 |
| hsa051324 | Colorectum | MSS | Salmonella infection | 92/1875 | 249/8465 | 5.23e-08 | 9.74e-07 | 5.97e-07 | 92 |
| hsa051325 | Colorectum | MSS | Salmonella infection | 92/1875 | 249/8465 | 5.23e-08 | 9.74e-07 | 5.97e-07 | 92 |
| hsa051326 | Colorectum | MSI-H | Salmonella infection | 43/797 | 249/8465 | 5.91e-05 | 8.33e-04 | 6.98e-04 | 43 |
| hsa051327 | Colorectum | MSI-H | Salmonella infection | 43/797 | 249/8465 | 5.91e-05 | 8.33e-04 | 6.98e-04 | 43 |
| Page: 1 2 3 4 |
Top |
Cell-cell communication analysis |
| Identification of potential cell-cell interactions between two cell types and their ligand-receptor pairs for different disease states |
| Ligand | Receptor | LRpair | Pathway | Tissue | Disease Stage |
| Page: 1 |
Top |
Single-cell gene regulatory network inference analysis |
| Find out the significant the regulons (TFs) and the target genes of each regulon across cell types for different disease states |
| TF | Cell Type | Tissue | Disease Stage | Target Gene | RSS | Regulon Activity |
| ∗The dot plots of a searched regulon are shown for all cell subpopulations in each disease state of each tissue based on the regulon specific score inferred using pySCENIC and by calculating the average expression. |
| Page: 1 |
Top |
Somatic mutation of malignant transformation related genes |
| Annotation of somatic variants for genes involved in malignant transformation |
| Hugo Symbol | Variant Class | Variant Classification | dbSNP RS | HGVSc | HGVSp | HGVSp Short | SWISSPROT | BIOTYPE | SIFT | PolyPhen | Tumor Sample Barcode | Tissue | Histology | Sex | Age | Stage | Therapy Types | Drugs | Outcome |
| ANXA2 | SNV | Missense_Mutation | c.109A>G | p.Thr37Ala | p.T37A | P07355 | protein_coding | tolerated(0.73) | probably_damaging(0.953) | TCGA-FU-A3EO-01 | Cervix | cervical & endocervical cancer | Female | <65 | I/II | Unknown | Unknown | SD | |
| ANXA2 | SNV | Missense_Mutation | novel | c.509N>G | p.Lys170Arg | p.K170R | P07355 | protein_coding | deleterious(0.05) | benign(0.026) | TCGA-UC-A7PG-06 | Cervix | cervical & endocervical cancer | Female | <65 | III/IV | Chemotherapy | cisplatin | PD |
| ANXA2 | SNV | Missense_Mutation | novel | c.514N>A | p.Asp172Asn | p.D172N | P07355 | protein_coding | deleterious(0.01) | benign(0.003) | TCGA-VS-A958-01 | Cervix | cervical & endocervical cancer | Female | <65 | I/II | Chemotherapy | cisplatin | CR |
| ANXA2 | SNV | Missense_Mutation | rs774410888 | c.274N>A | p.Ala92Thr | p.A92T | P07355 | protein_coding | tolerated(0.19) | benign(0.047) | TCGA-AA-3492-01 | Colorectum | colon adenocarcinoma | Female | >=65 | I/II | Unknown | Unknown | SD |
| ANXA2 | SNV | Missense_Mutation | rs753106303 | c.424G>A | p.Asp142Asn | p.D142N | P07355 | protein_coding | deleterious(0.02) | benign(0.254) | TCGA-AA-3977-01 | Colorectum | colon adenocarcinoma | Male | >=65 | I/II | Unknown | Unknown | SD |
| ANXA2 | SNV | Missense_Mutation | c.70N>A | p.Glu24Lys | p.E24K | P07355 | protein_coding | tolerated(0.11) | benign(0.086) | TCGA-AA-A00N-01 | Colorectum | colon adenocarcinoma | Male | >=65 | I/II | Unknown | Unknown | PD | |
| ANXA2 | SNV | Missense_Mutation | c.245N>T | p.Ser82Ile | p.S82I | P07355 | protein_coding | deleterious(0) | possibly_damaging(0.662) | TCGA-AD-5900-01 | Colorectum | colon adenocarcinoma | Male | >=65 | I/II | Unknown | Unknown | SD | |
| ANXA2 | SNV | Missense_Mutation | novel | c.1018G>C | p.Asp340His | p.D340H | P07355 | protein_coding | tolerated(0.29) | probably_damaging(0.999) | TCGA-AG-A032-01 | Colorectum | rectum adenocarcinoma | Male | >=65 | III/IV | Targeted Molecular therapy | bevacizumab | PD |
| ANXA2 | SNV | Missense_Mutation | novel | c.562N>A | p.Leu188Met | p.L188M | P07355 | protein_coding | deleterious(0.02) | probably_damaging(0.946) | TCGA-AH-6643-01 | Colorectum | rectum adenocarcinoma | Male | <65 | III/IV | Chemotherapy | oxaliplatin | PD |
| ANXA2 | SNV | Missense_Mutation | rs774410888 | c.274N>A | p.Ala92Thr | p.A92T | P07355 | protein_coding | tolerated(0.19) | benign(0.047) | TCGA-A5-A0G1-01 | Endometrium | uterine corpus endometrioid carcinoma | Female | >=65 | I/II | Unknown | Unknown | SD |
| Page: 1 2 3 4 |
Top |
Related drugs of malignant transformation related genes |
| Identification of chemicals and drugs interact with genes involved in malignant transfromation |
| (DGIdb 4.0) |
| Entrez ID | Symbol | Category | Interaction Types | Drug Claim Name | Drug Name | PMIDs |
| 302 | ANXA2 | CELL SURFACE, DRUGGABLE GENOME | N-ETHYLMALEIMIDE | N-ETHYLMALEIMIDE | 16408090 | |
| 302 | ANXA2 | CELL SURFACE, DRUGGABLE GENOME | WITHAFERIN A | WITHAFERIN A | 16408090 |
| Page: 1 |

Copyright 2023-Present -The University of Texas Health Science Center at Houston |