
|
|||||
|
 | |
| |
| |
| |
| |
| |
|
Gene: ANXA13 |
Gene summary for ANXA13 |
| Gene information | Species | Human | Gene symbol | ANXA13 | Gene ID | 312 |
| Gene name | annexin A13 | |
| Gene Alias | ANX13 | |
| Cytomap | 8q24.13 | |
| Gene Type | protein-coding | GO ID | GO:0008150 | UniProtAcc | P27216 |
Top |
Malignant transformation analysis |
| Identification of the aberrant gene expression in precancerous and cancerous lesions by comparing the gene expression of stem-like cells in diseased tissues with normal stem cells |
| Entrez ID | Symbol | Replicates | Species | Organ | Tissue | Adj P-value | Log2FC | Malignancy |
| 312 | ANXA13 | HTA11_78_2000001011 | Human | Colorectum | AD | 5.55e-08 | 4.83e-01 | -0.1088 |
| 312 | ANXA13 | HTA11_347_2000001011 | Human | Colorectum | AD | 2.17e-03 | 3.00e-01 | -0.1954 |
| 312 | ANXA13 | HTA11_3361_2000001011 | Human | Colorectum | AD | 1.87e-03 | 2.03e-01 | -0.1207 |
| 312 | ANXA13 | HTA11_696_2000001011 | Human | Colorectum | AD | 1.27e-24 | 8.14e-01 | -0.1464 |
| 312 | ANXA13 | HTA11_866_2000001011 | Human | Colorectum | AD | 7.71e-04 | 1.88e-01 | -0.1001 |
| 312 | ANXA13 | HTA11_8622_2000001021 | Human | Colorectum | SER | 4.61e-04 | 5.12e-01 | 0.0528 |
| 312 | ANXA13 | HTA11_99999965062_69753 | Human | Colorectum | MSI-H | 8.03e-06 | 1.23e+00 | 0.3487 |
| 312 | ANXA13 | HTA11_99999965104_69814 | Human | Colorectum | MSS | 1.04e-08 | 3.47e-01 | 0.281 |
| 312 | ANXA13 | HTA11_99999974143_84620 | Human | Colorectum | MSS | 3.05e-25 | 5.26e-01 | 0.3005 |
| 312 | ANXA13 | F072B | Human | Colorectum | FAP | 1.45e-03 | 3.67e-01 | 0.257 |
| 312 | ANXA13 | S43 | Human | Liver | Cirrhotic | 1.41e-15 | -4.96e-01 | -0.0187 |
| 312 | ANXA13 | HCC1_Meng | Human | Liver | HCC | 2.72e-71 | -2.54e-01 | 0.0246 |
| 312 | ANXA13 | HCC2_Meng | Human | Liver | HCC | 9.95e-17 | -4.72e-01 | 0.0107 |
| 312 | ANXA13 | cirrhotic1 | Human | Liver | Cirrhotic | 8.91e-17 | 2.14e-01 | 0.0202 |
| 312 | ANXA13 | cirrhotic2 | Human | Liver | Cirrhotic | 4.91e-29 | 3.52e-01 | 0.0201 |
| 312 | ANXA13 | cirrhotic3 | Human | Liver | Cirrhotic | 4.66e-08 | -1.07e-01 | 0.0215 |
| 312 | ANXA13 | HCC1 | Human | Liver | HCC | 4.95e-18 | -3.40e-01 | 0.5336 |
| 312 | ANXA13 | HCC2 | Human | Liver | HCC | 3.80e-02 | -3.38e-02 | 0.5341 |
| 312 | ANXA13 | HCC5 | Human | Liver | HCC | 4.57e-13 | -2.04e-01 | 0.4932 |
| 312 | ANXA13 | Pt13.a | Human | Liver | HCC | 3.88e-08 | -4.08e-01 | 0.021 |
| Page: 1 2 |
| Tissue | Expression Dynamics | Abbreviation |
| Colorectum (GSE201348) |  | FAP: Familial adenomatous polyposis |
| CRC: Colorectal cancer | ||
| Colorectum (HTA11) |  | AD: Adenomas |
| SER: Sessile serrated lesions | ||
| MSI-H: Microsatellite-high colorectal cancer | ||
| MSS: Microsatellite stable colorectal cancer | ||
| Liver | 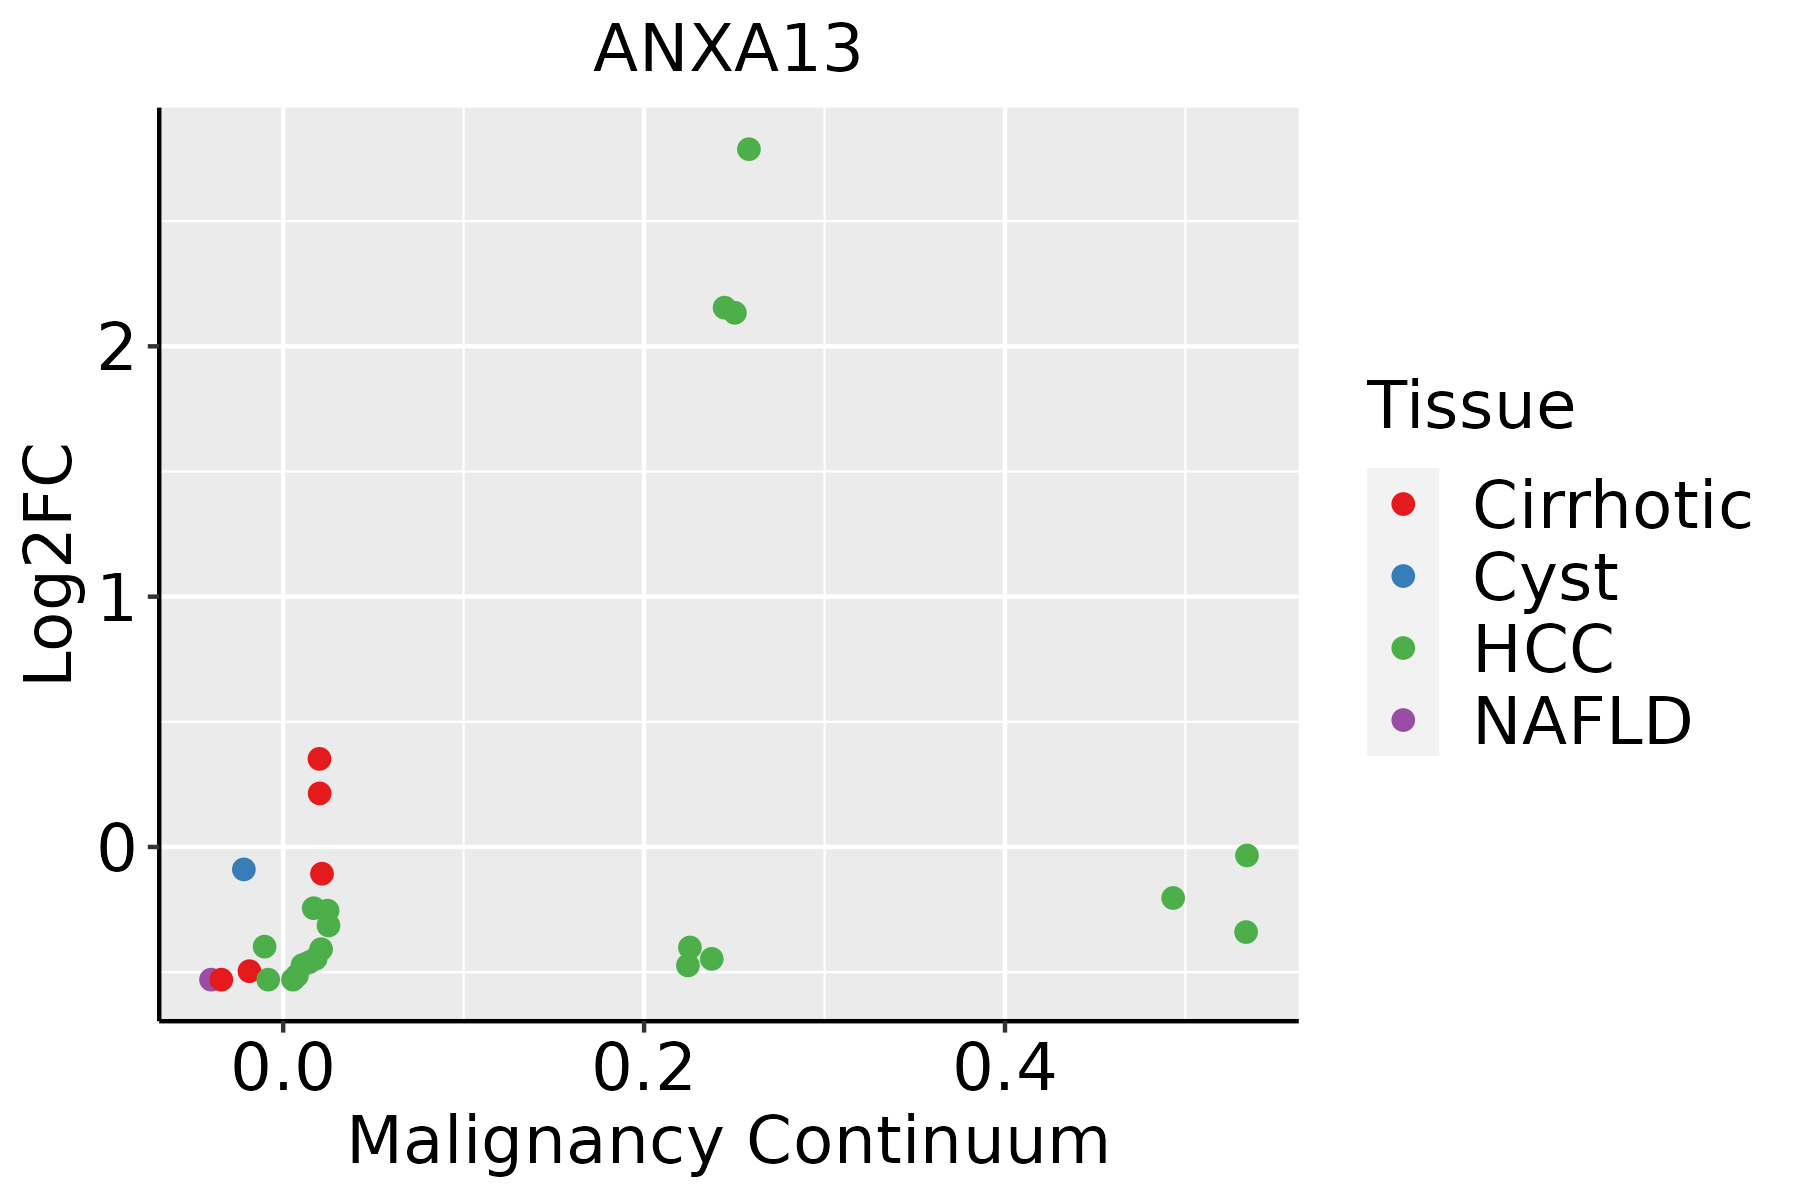 | HCC: Hepatocellular carcinoma |
| NAFLD: Non-alcoholic fatty liver disease |
| ∗log2FC in expression of this searched gene in stem-like cells from each diseased tissue sample relative to stem-like cells in normal samples in each tissue plotted against the malignancy continuum. Samples are colored based on if they are from different disease stage. |
Top |
Malignant transformation related pathway analysis |
| Find out the enriched GO biological processes and KEGG pathways involved in transition from healthy to precancer to cancer |
| Tissue | Disease Stage | Enriched GO biological Processes |
| Colorectum | AD |  |
| Colorectum | SER |  |
| Colorectum | MSS |  |
| Colorectum | MSI-H |  |
| Colorectum | FAP |  |
| ∗Top 15 enriched GO BP terms are showed in the bar plot of each disease state in each tissue. Each row represents a significant GO biological process which is colored according to the -log10(p.adjust). |
| Page: 1 2 3 4 5 6 7 8 9 |
| GO ID | Tissue | Disease Stage | Description | Gene Ratio | Bg Ratio | pvalue | p.adjust | Count |
| Page: 1 |
| Pathway ID | Tissue | Disease Stage | Description | Gene Ratio | Bg Ratio | pvalue | p.adjust | qvalue | Count |
| Page: 1 |
Top |
Cell-cell communication analysis |
| Identification of potential cell-cell interactions between two cell types and their ligand-receptor pairs for different disease states |
| Ligand | Receptor | LRpair | Pathway | Tissue | Disease Stage |
| Page: 1 |
Top |
Single-cell gene regulatory network inference analysis |
| Find out the significant the regulons (TFs) and the target genes of each regulon across cell types for different disease states |
| TF | Cell Type | Tissue | Disease Stage | Target Gene | RSS | Regulon Activity |
| ∗The dot plots of a searched regulon are shown for all cell subpopulations in each disease state of each tissue based on the regulon specific score inferred using pySCENIC and by calculating the average expression. |
| Page: 1 |
Top |
Somatic mutation of malignant transformation related genes |
| Annotation of somatic variants for genes involved in malignant transformation |
| Hugo Symbol | Variant Class | Variant Classification | dbSNP RS | HGVSc | HGVSp | HGVSp Short | SWISSPROT | BIOTYPE | SIFT | PolyPhen | Tumor Sample Barcode | Tissue | Histology | Sex | Age | Stage | Therapy Types | Drugs | Outcome |
| ANXA13 | SNV | Missense_Mutation | c.370N>A | p.Leu124Ile | p.L124I | P27216 | protein_coding | deleterious(0) | probably_damaging(0.998) | TCGA-A7-A0DB-01 | Breast | breast invasive carcinoma | Female | <65 | I/II | Hormone Therapy | arimidex | SD | |
| ANXA13 | SNV | Missense_Mutation | c.362C>T | p.Ala121Val | p.A121V | P27216 | protein_coding | tolerated(0.8) | benign(0.223) | TCGA-BH-A18G-01 | Breast | breast invasive carcinoma | Female | >=65 | I/II | Unknown | Unknown | SD | |
| ANXA13 | SNV | Missense_Mutation | rs376615442 | c.952N>A | p.Glu318Lys | p.E318K | P27216 | protein_coding | deleterious(0.02) | probably_damaging(0.996) | TCGA-D8-A27G-01 | Breast | breast invasive carcinoma | Female | >=65 | I/II | Unknown | Unknown | SD |
| ANXA13 | SNV | Missense_Mutation | novel | c.364T>G | p.Leu122Val | p.L122V | P27216 | protein_coding | tolerated(0.26) | probably_damaging(0.998) | TCGA-E2-A1B0-01 | Breast | breast invasive carcinoma | Female | <65 | III/IV | Chemotherapy | cytoxan | SD |
| ANXA13 | SNV | Missense_Mutation | c.188A>C | p.Lys63Thr | p.K63T | P27216 | protein_coding | tolerated(0.34) | probably_damaging(0.998) | TCGA-E2-A1L7-01 | Breast | breast invasive carcinoma | Female | <65 | III/IV | Chemotherapy | cyclophosphamide | PD | |
| ANXA13 | SNV | Missense_Mutation | rs201946511 | c.536N>T | p.Ser179Leu | p.S179L | P27216 | protein_coding | tolerated(0.07) | probably_damaging(0.998) | TCGA-IR-A3LA-01 | Cervix | cervical & endocervical cancer | Female | <65 | I/II | Chemotherapy | cisplatin | CR |
| ANXA13 | SNV | Missense_Mutation | novel | c.560N>T | p.Gly187Val | p.G187V | P27216 | protein_coding | deleterious(0) | benign(0.251) | TCGA-AA-3984-01 | Colorectum | colon adenocarcinoma | Female | <65 | I/II | Unknown | Unknown | SD |
| ANXA13 | SNV | Missense_Mutation | c.1019N>G | p.Val340Gly | p.V340G | P27216 | protein_coding | deleterious(0) | possibly_damaging(0.885) | TCGA-AY-6197-01 | Colorectum | colon adenocarcinoma | Male | <65 | I/II | Unknown | Unknown | SD | |
| ANXA13 | SNV | Missense_Mutation | c.905N>T | p.Ala302Val | p.A302V | P27216 | protein_coding | tolerated(0.26) | benign(0.001) | TCGA-CK-4951-01 | Colorectum | colon adenocarcinoma | Female | >=65 | I/II | Unknown | Unknown | PD | |
| ANXA13 | SNV | Missense_Mutation | c.836N>G | p.Thr279Ser | p.T279S | P27216 | protein_coding | tolerated(0.06) | probably_damaging(0.996) | TCGA-CK-4951-01 | Colorectum | colon adenocarcinoma | Female | >=65 | I/II | Unknown | Unknown | PD |
| Page: 1 2 3 4 5 6 |
Top |
Related drugs of malignant transformation related genes |
| Identification of chemicals and drugs interact with genes involved in malignant transfromation |
| (DGIdb 4.0) |
| Entrez ID | Symbol | Category | Interaction Types | Drug Claim Name | Drug Name | PMIDs |
| Page: 1 |

Copyright 2023-Present -The University of Texas Health Science Center at Houston |