
|
|||||
|
 | |
| |
| |
| |
| |
| |
|
Gene: ANXA11 |
Gene summary for ANXA11 |
| Gene information | Species | Human | Gene symbol | ANXA11 | Gene ID | 311 |
| Gene name | annexin A11 | |
| Gene Alias | ALS23 | |
| Cytomap | 10q22.3 | |
| Gene Type | protein-coding | GO ID | GO:0000910 | UniProtAcc | P50995 |
Top |
Malignant transformation analysis |
| Identification of the aberrant gene expression in precancerous and cancerous lesions by comparing the gene expression of stem-like cells in diseased tissues with normal stem cells |
| Entrez ID | Symbol | Replicates | Species | Organ | Tissue | Adj P-value | Log2FC | Malignancy |
| 311 | ANXA11 | HTA11_3410_2000001011 | Human | Colorectum | AD | 2.00e-12 | 4.96e-01 | 0.0155 |
| 311 | ANXA11 | HTA11_2487_2000001011 | Human | Colorectum | SER | 4.94e-31 | 1.48e+00 | -0.1808 |
| 311 | ANXA11 | HTA11_1938_2000001011 | Human | Colorectum | AD | 1.95e-24 | 1.09e+00 | -0.0811 |
| 311 | ANXA11 | HTA11_78_2000001011 | Human | Colorectum | AD | 3.41e-18 | 8.73e-01 | -0.1088 |
| 311 | ANXA11 | HTA11_347_2000001011 | Human | Colorectum | AD | 4.64e-40 | 1.13e+00 | -0.1954 |
| 311 | ANXA11 | HTA11_411_2000001011 | Human | Colorectum | SER | 1.32e-14 | 2.08e+00 | -0.2602 |
| 311 | ANXA11 | HTA11_2112_2000001011 | Human | Colorectum | SER | 1.71e-15 | 1.49e+00 | -0.2196 |
| 311 | ANXA11 | HTA11_3361_2000001011 | Human | Colorectum | AD | 5.71e-16 | 9.83e-01 | -0.1207 |
| 311 | ANXA11 | HTA11_83_2000001011 | Human | Colorectum | SER | 1.89e-21 | 1.10e+00 | -0.1526 |
| 311 | ANXA11 | HTA11_696_2000001011 | Human | Colorectum | AD | 1.86e-40 | 1.27e+00 | -0.1464 |
| 311 | ANXA11 | HTA11_866_2000001011 | Human | Colorectum | AD | 4.82e-24 | 8.32e-01 | -0.1001 |
| 311 | ANXA11 | HTA11_1391_2000001011 | Human | Colorectum | AD | 2.42e-30 | 1.45e+00 | -0.059 |
| 311 | ANXA11 | HTA11_2992_2000001011 | Human | Colorectum | SER | 4.81e-13 | 1.57e+00 | -0.1706 |
| 311 | ANXA11 | HTA11_5212_2000001011 | Human | Colorectum | AD | 3.14e-23 | 1.38e+00 | -0.2061 |
| 311 | ANXA11 | HTA11_5216_2000001011 | Human | Colorectum | SER | 1.01e-09 | 1.08e+00 | -0.1462 |
| 311 | ANXA11 | HTA11_546_2000001011 | Human | Colorectum | AD | 6.56e-10 | 9.06e-01 | -0.0842 |
| 311 | ANXA11 | HTA11_7862_2000001011 | Human | Colorectum | AD | 2.00e-04 | 5.97e-01 | -0.0179 |
| 311 | ANXA11 | HTA11_866_3004761011 | Human | Colorectum | AD | 5.28e-22 | 9.50e-01 | 0.096 |
| 311 | ANXA11 | HTA11_4255_2000001011 | Human | Colorectum | SER | 1.55e-08 | 9.82e-01 | 0.0446 |
| 311 | ANXA11 | HTA11_8622_2000001021 | Human | Colorectum | SER | 8.85e-08 | 8.41e-01 | 0.0528 |
| Page: 1 2 3 4 5 6 7 8 9 10 11 12 |
| Tissue | Expression Dynamics | Abbreviation |
| Colorectum (GSE201348) |  | FAP: Familial adenomatous polyposis |
| CRC: Colorectal cancer | ||
| Colorectum (HTA11) |  | AD: Adenomas |
| SER: Sessile serrated lesions | ||
| MSI-H: Microsatellite-high colorectal cancer | ||
| MSS: Microsatellite stable colorectal cancer | ||
| Endometrium | 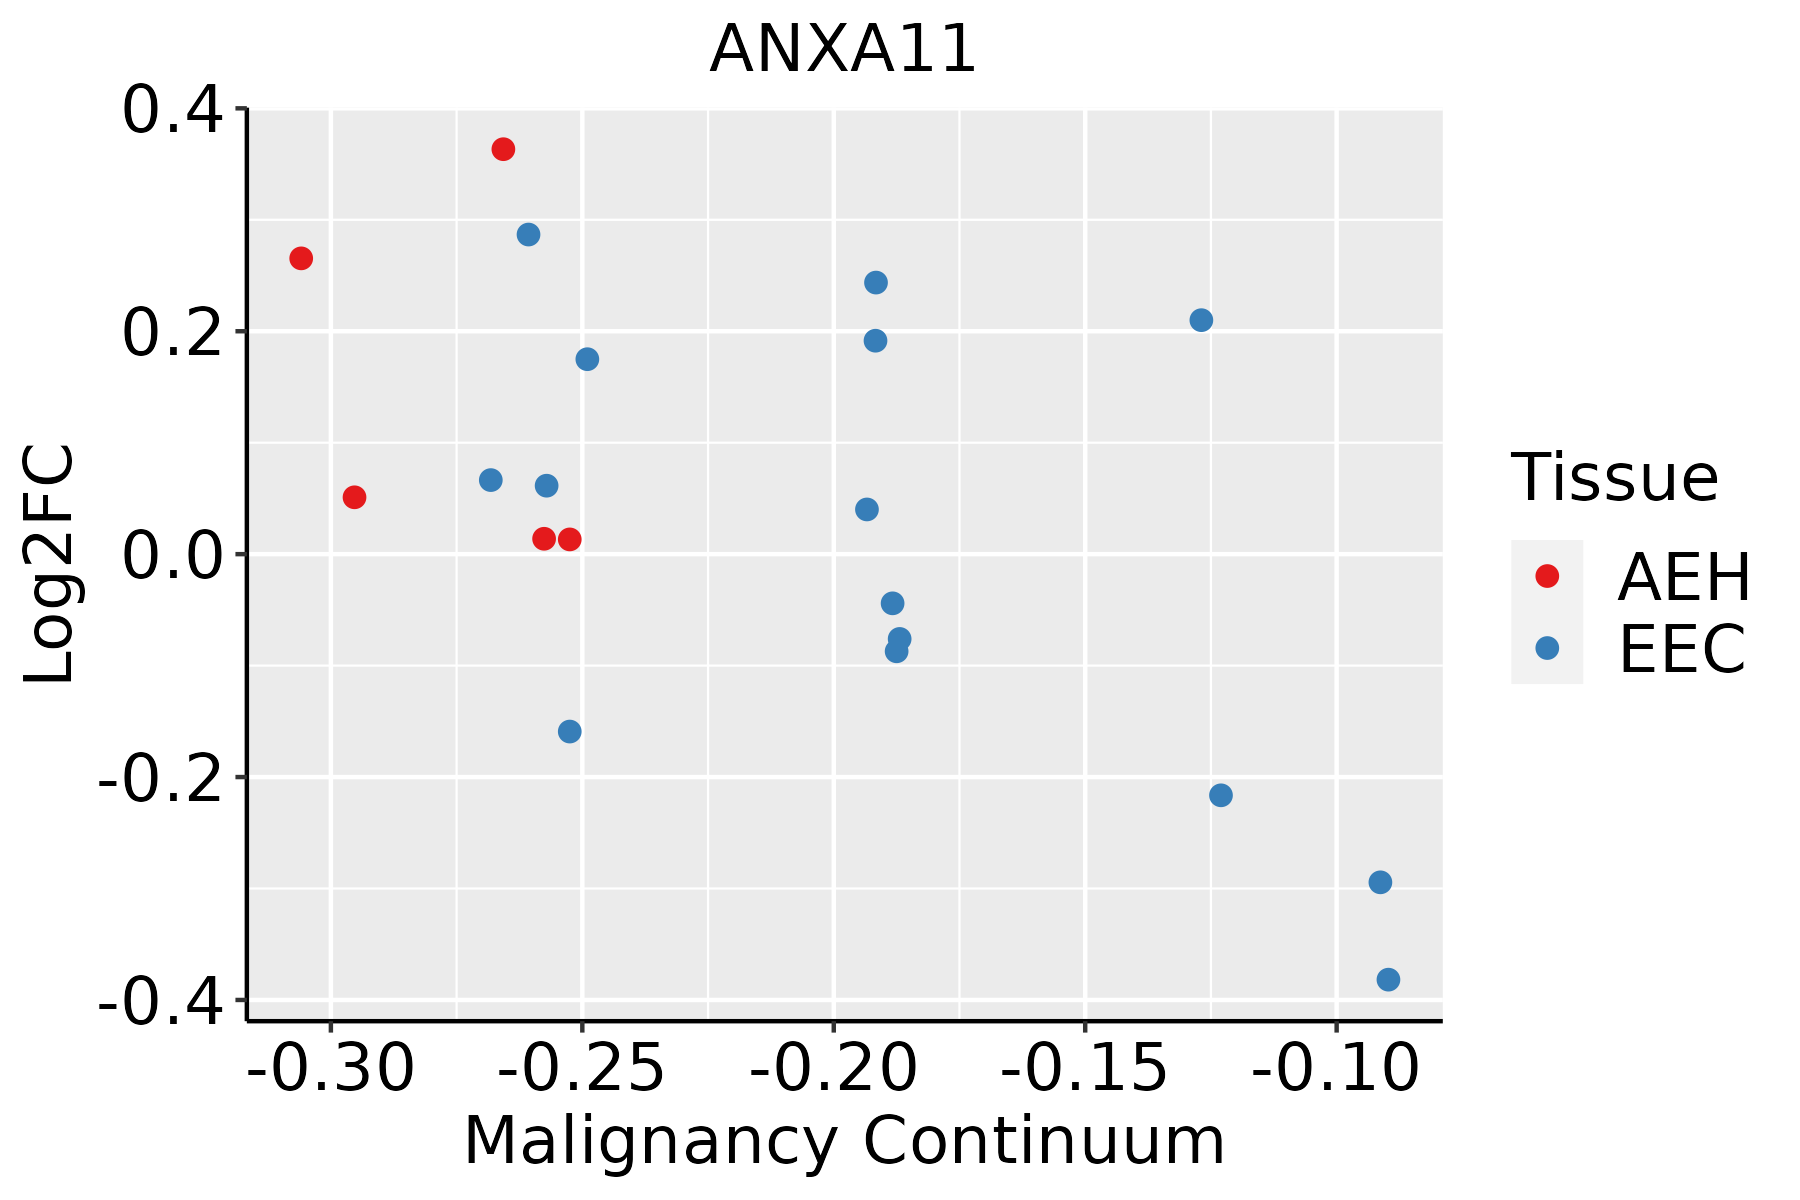 | AEH: Atypical endometrial hyperplasia |
| EEC: Endometrioid Cancer | ||
| Esophagus | 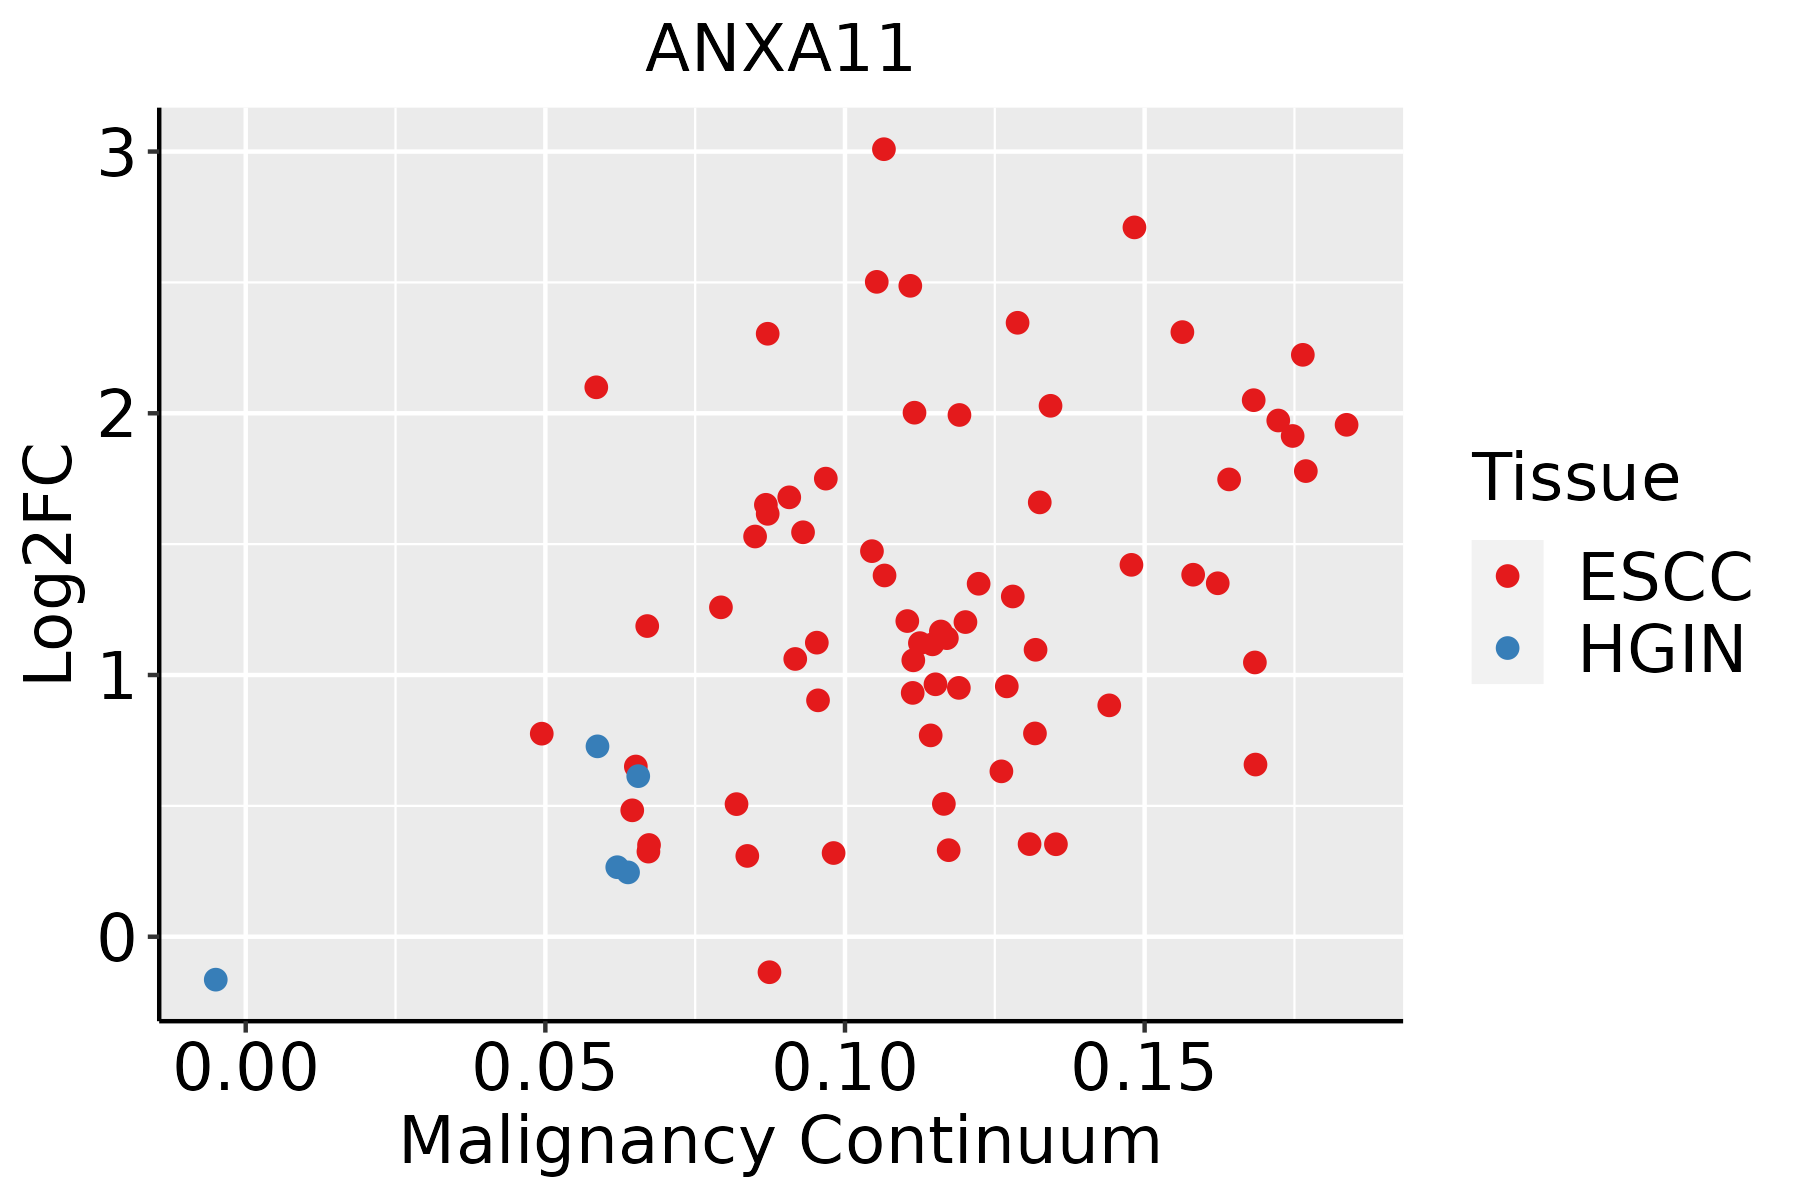 | ESCC: Esophageal squamous cell carcinoma |
| HGIN: High-grade intraepithelial neoplasias | ||
| LGIN: Low-grade intraepithelial neoplasias | ||
| GC | 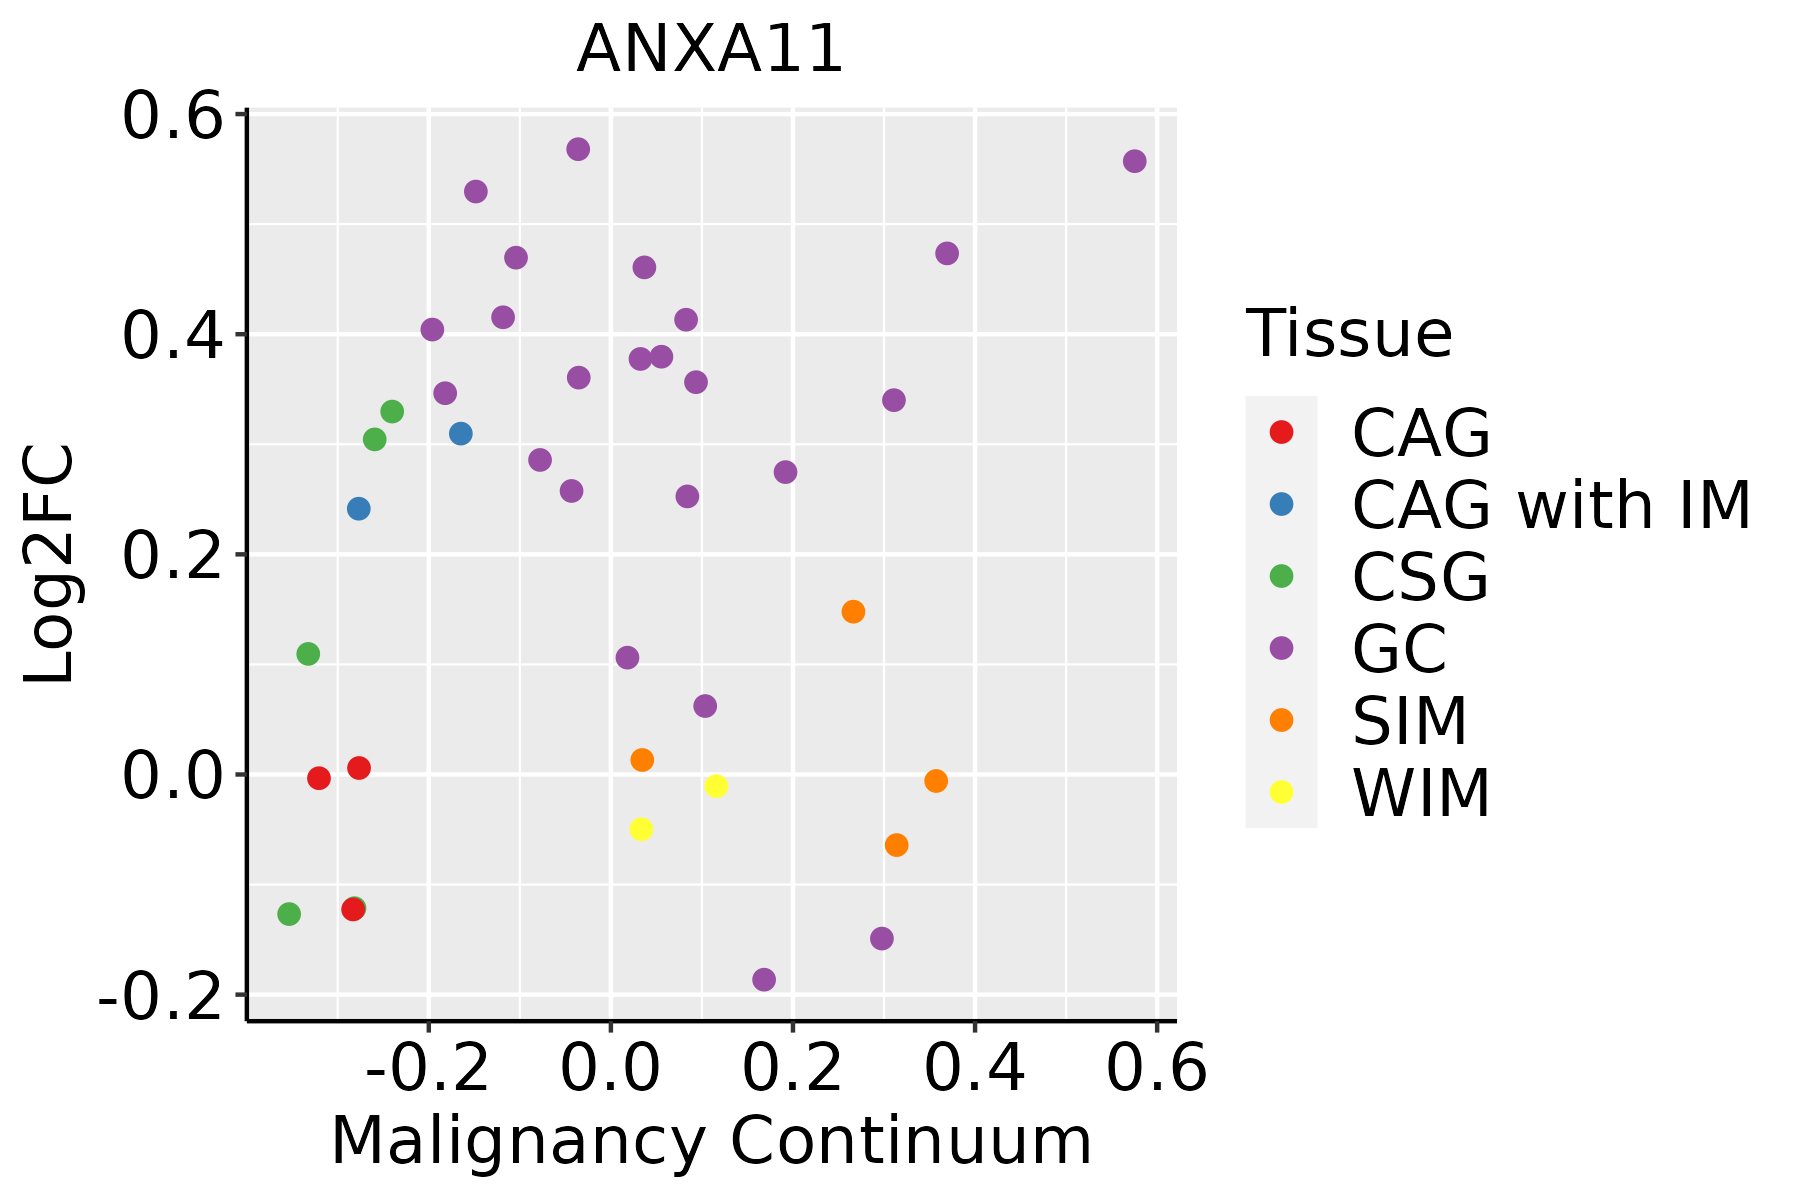 | CAG: Chronic atrophic gastritis |
| CAG with IM: Chronic atrophic gastritis with intestinal metaplasia | ||
| CSG: Chronic superficial gastritis | ||
| GC: Gastric cancer | ||
| SIM: Severe intestinal metaplasia | ||
| WIM: Wild intestinal metaplasia | ||
| Liver | 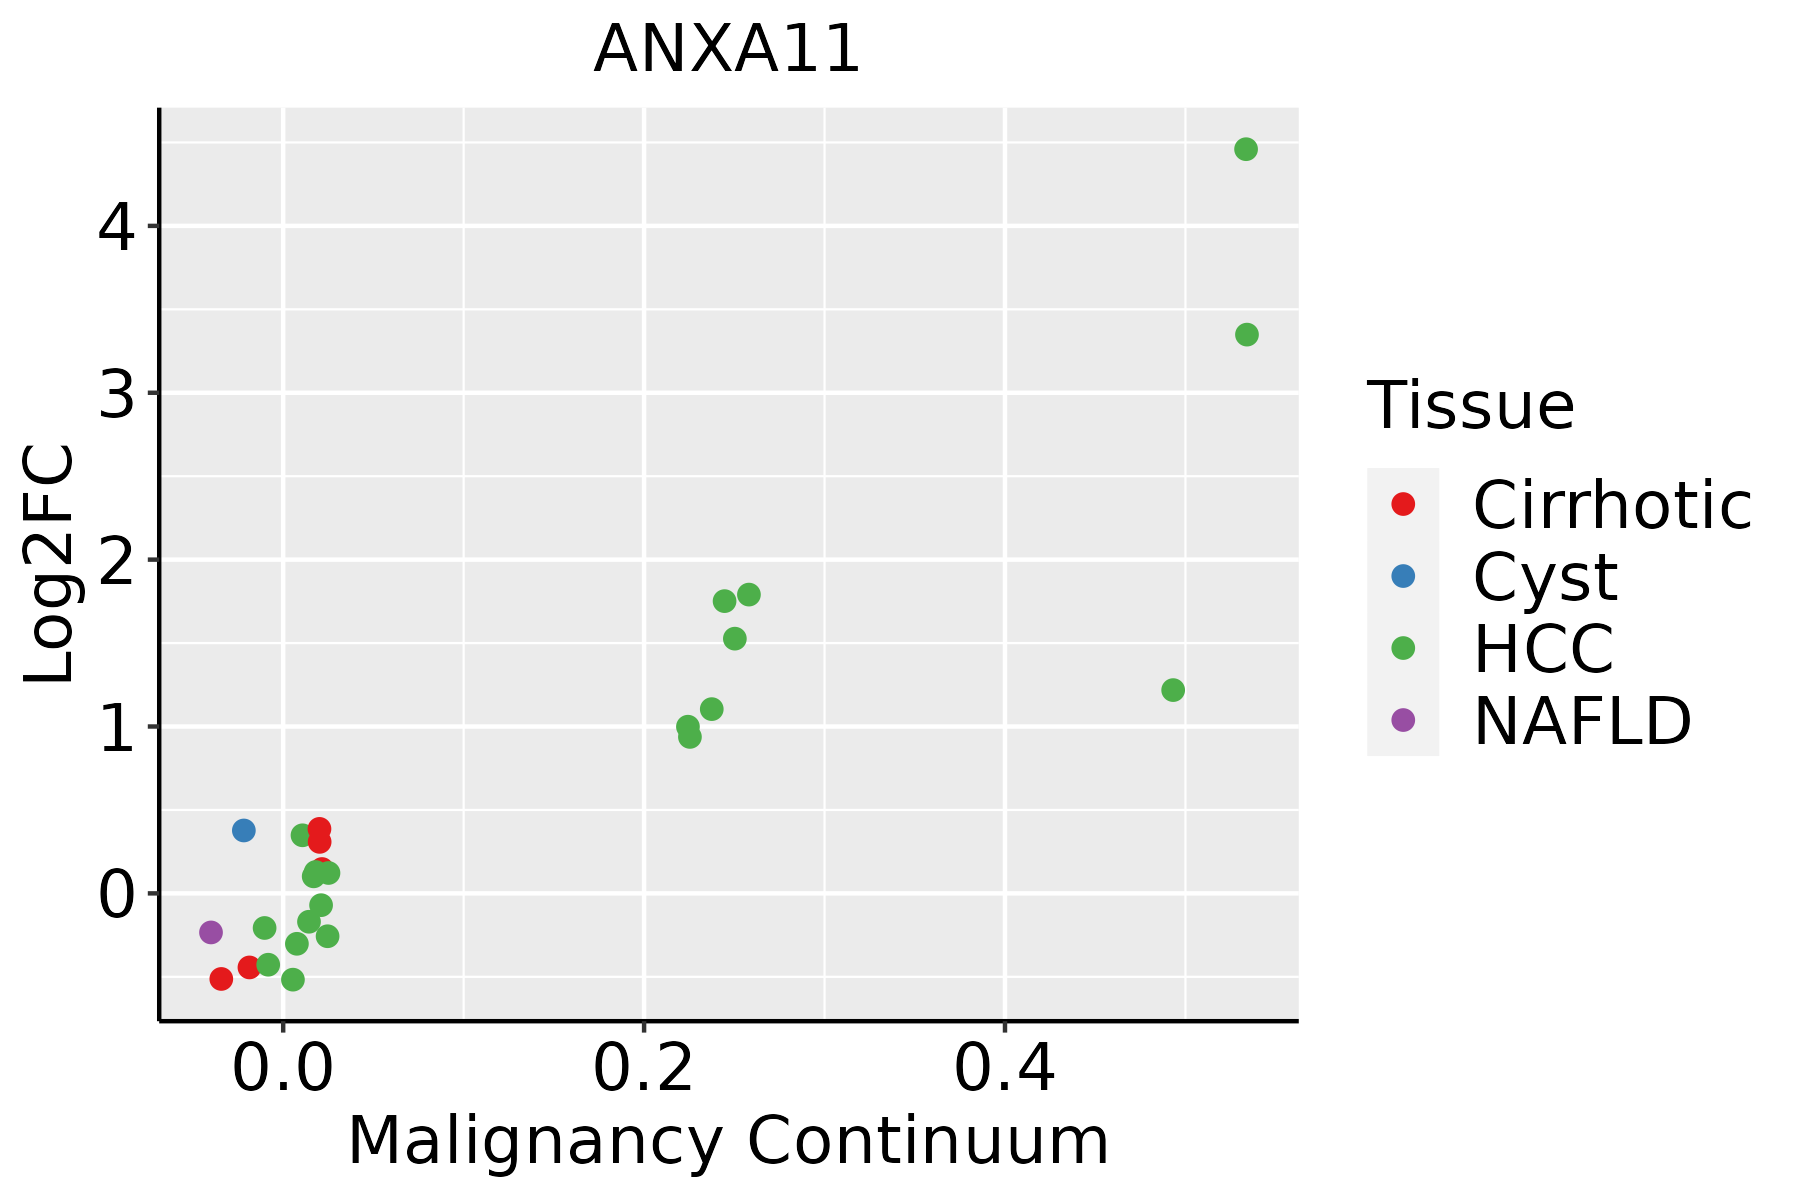 | HCC: Hepatocellular carcinoma |
| NAFLD: Non-alcoholic fatty liver disease | ||
| Oral Cavity | 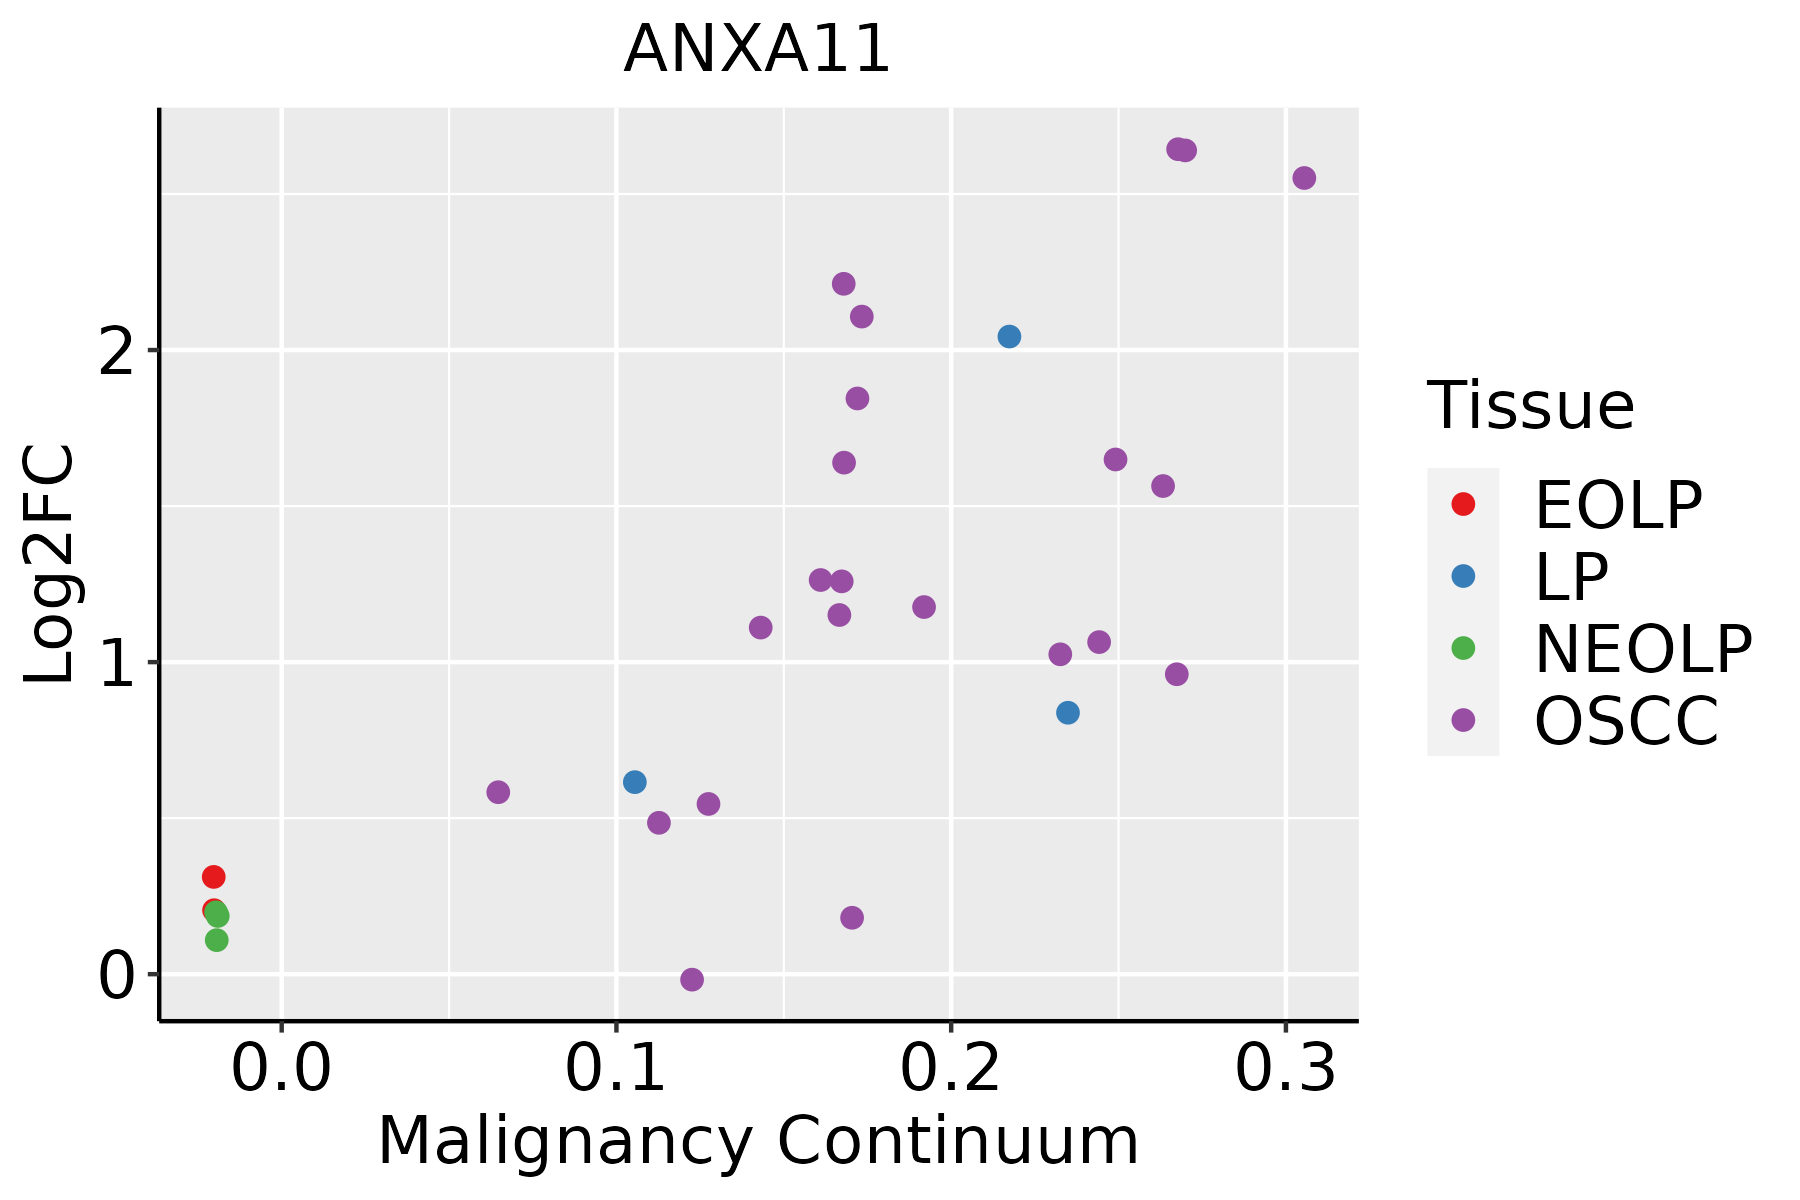 | EOLP: Erosive Oral lichen planus |
| LP: leukoplakia | ||
| NEOLP: Non-erosive oral lichen planus | ||
| OSCC: Oral squamous cell carcinoma | ||
| Prostate | 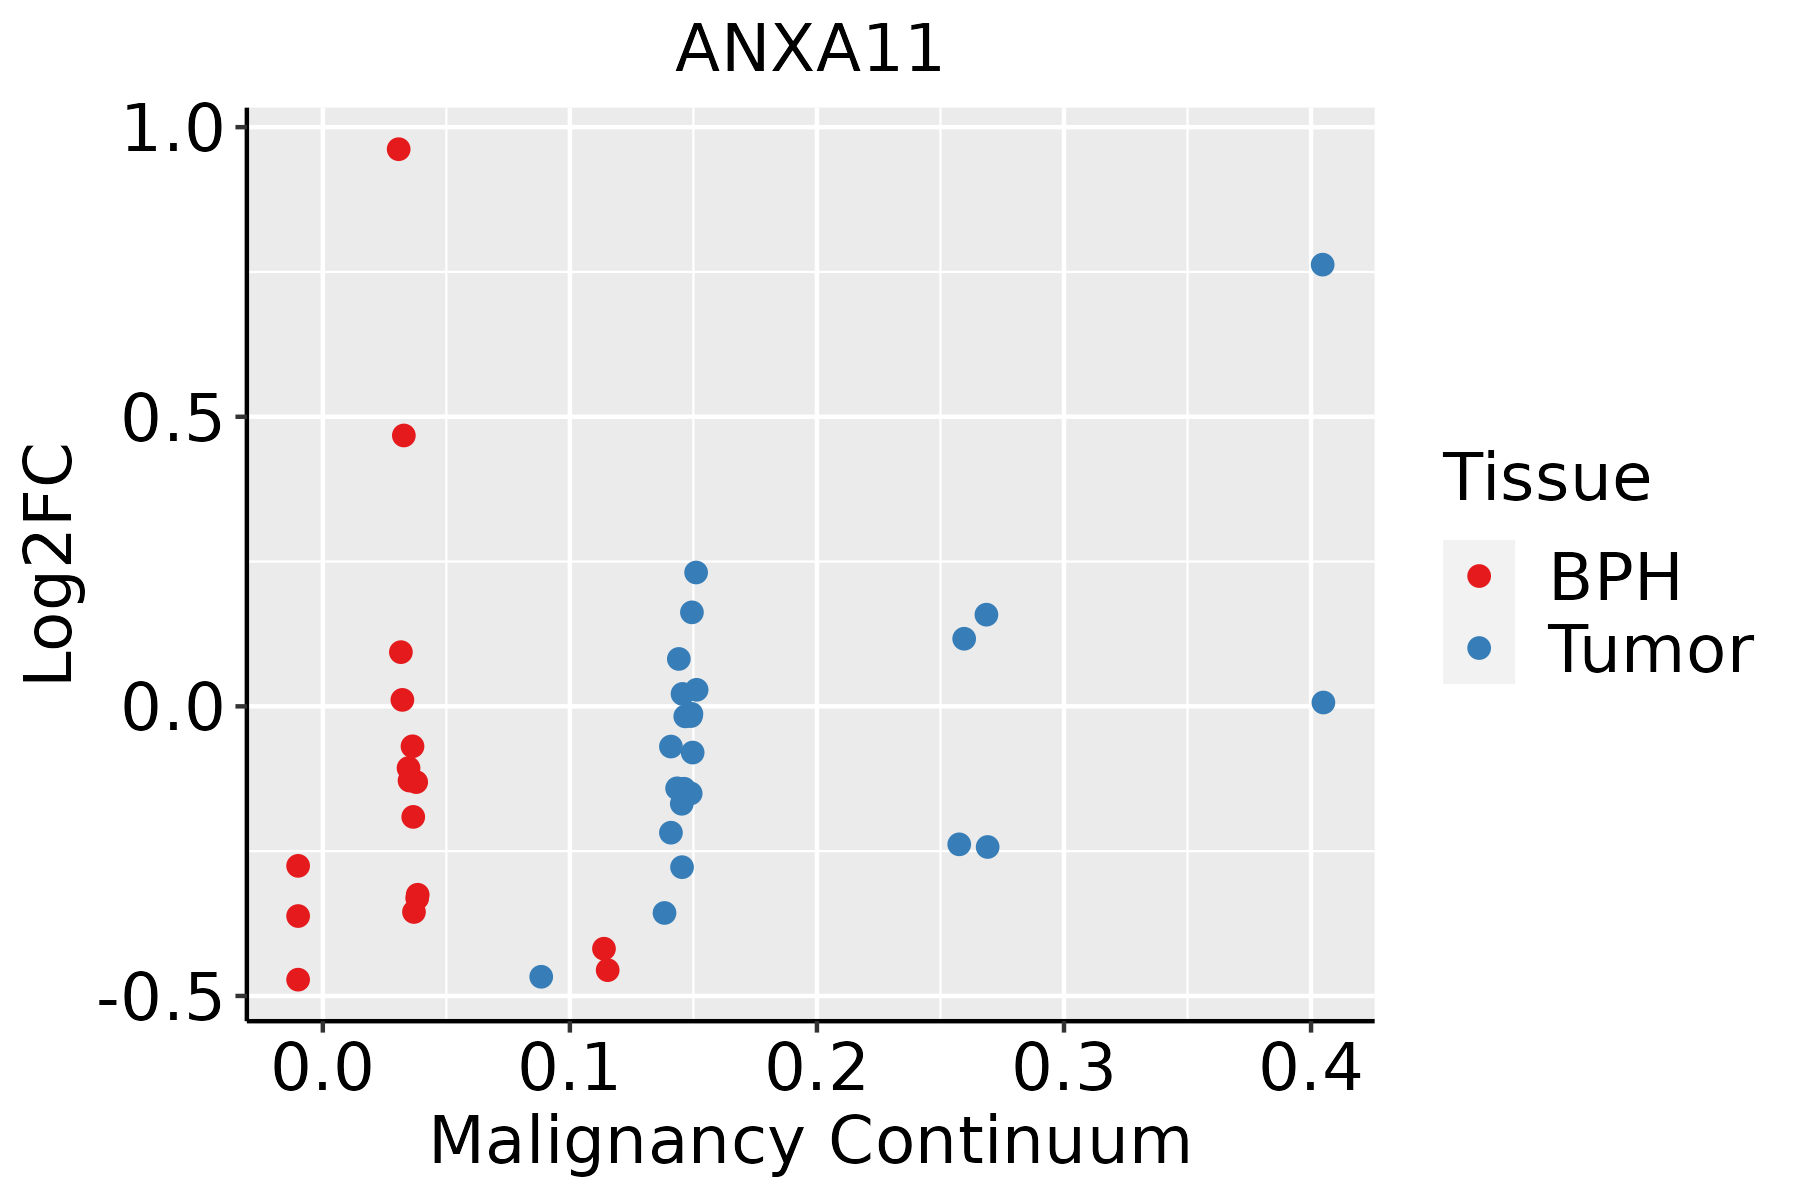 | BPH: Benign Prostatic Hyperplasia |
| Skin | 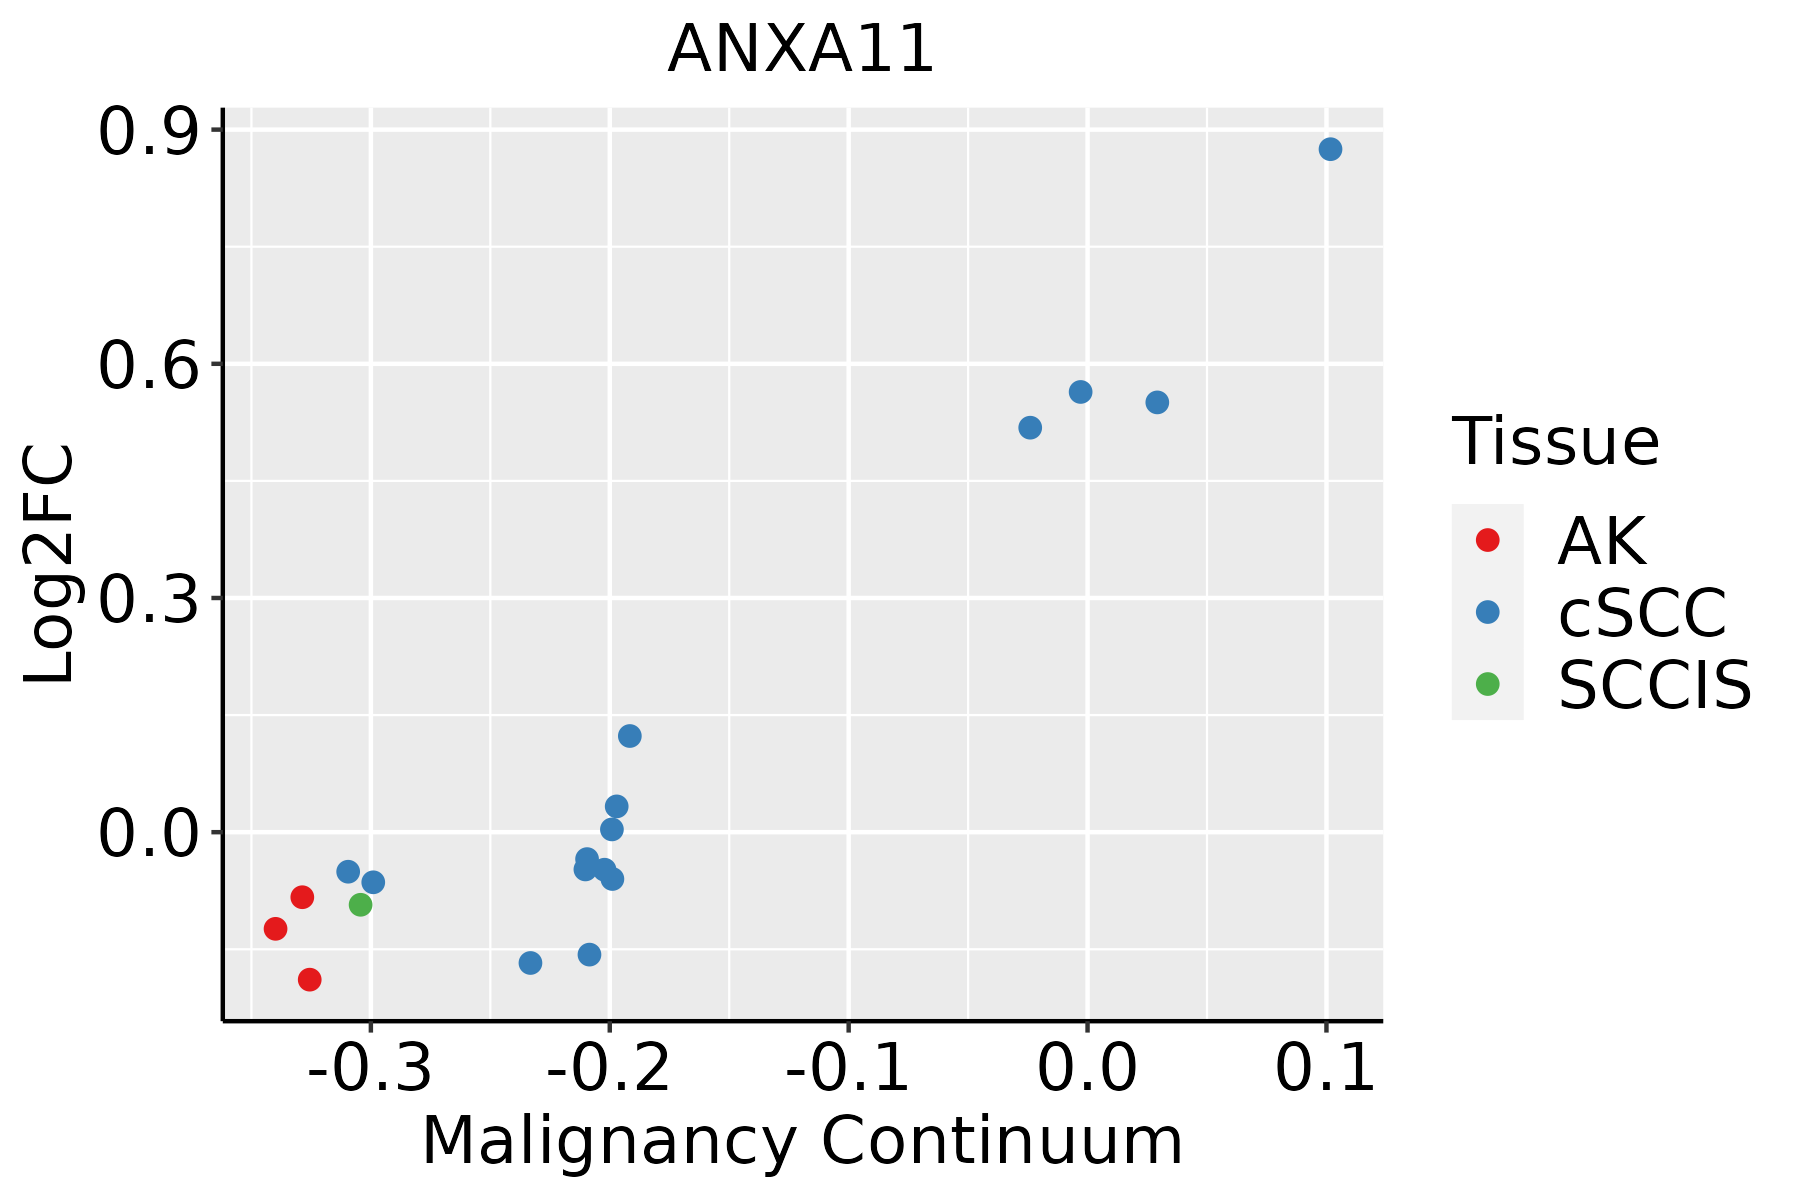 | AK: Actinic keratosis |
| cSCC: Cutaneous squamous cell carcinoma | ||
| SCCIS:squamous cell carcinoma in situ | ||
| Thyroid | 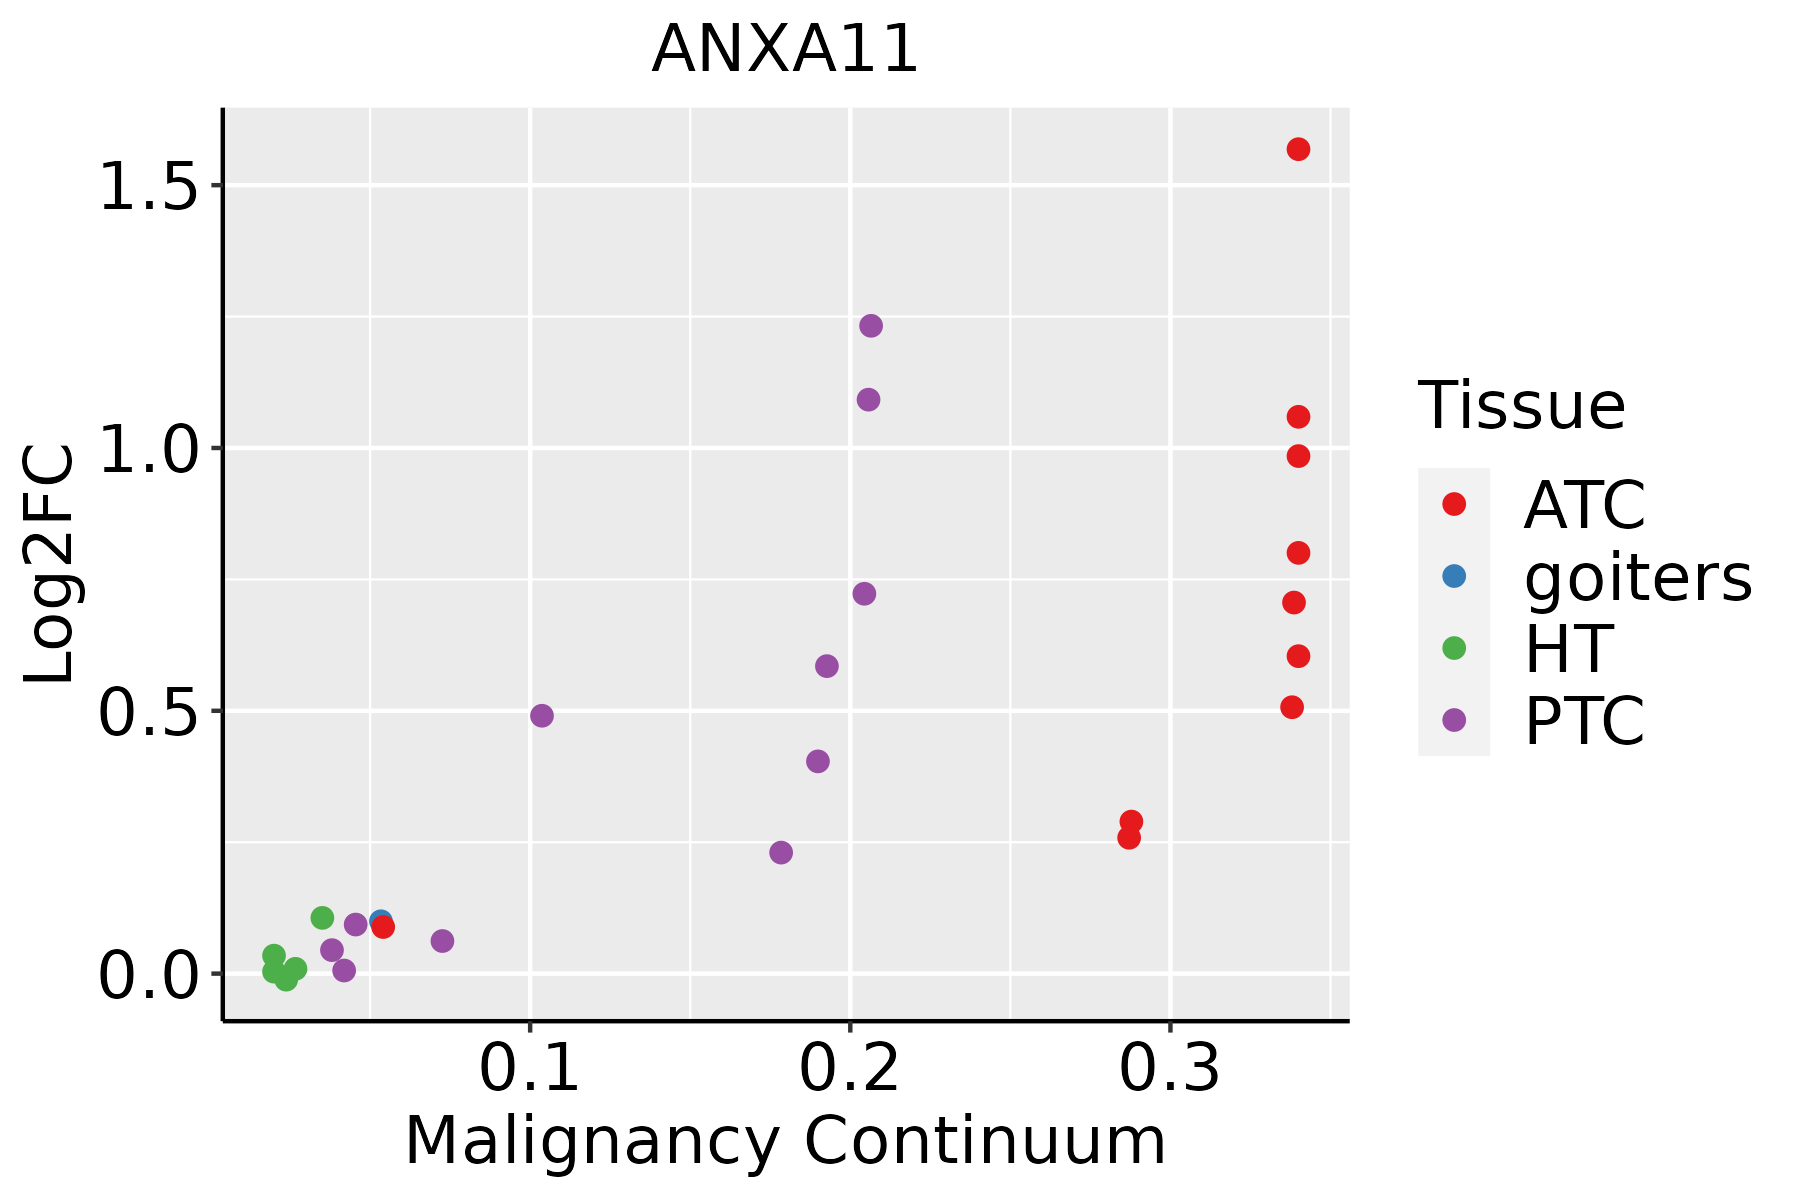 | ATC: Anaplastic thyroid cancer |
| HT: Hashimoto's thyroiditis | ||
| PTC: Papillary thyroid cancer |
| ∗log2FC in expression of this searched gene in stem-like cells from each diseased tissue sample relative to stem-like cells in normal samples in each tissue plotted against the malignancy continuum. Samples are colored based on if they are from different disease stage. |
Top |
Malignant transformation related pathway analysis |
| Find out the enriched GO biological processes and KEGG pathways involved in transition from healthy to precancer to cancer |
| Tissue | Disease Stage | Enriched GO biological Processes |
| Colorectum | AD |  |
| Colorectum | SER |  |
| Colorectum | MSS |  |
| Colorectum | MSI-H |  |
| Colorectum | FAP |  |
| ∗Top 15 enriched GO BP terms are showed in the bar plot of each disease state in each tissue. Each row represents a significant GO biological process which is colored according to the -log10(p.adjust). |
| Page: 1 2 3 4 5 6 7 8 9 |
| GO ID | Tissue | Disease Stage | Description | Gene Ratio | Bg Ratio | pvalue | p.adjust | Count |
| GO:0000910 | Colorectum | AD | cytokinesis | 59/3918 | 173/18723 | 3.74e-05 | 6.75e-04 | 59 |
| GO:0010038 | Colorectum | AD | response to metal ion | 106/3918 | 373/18723 | 3.22e-04 | 3.83e-03 | 106 |
| GO:0032506 | Colorectum | AD | cytokinetic process | 16/3918 | 39/18723 | 3.47e-03 | 2.51e-02 | 16 |
| GO:00100381 | Colorectum | SER | response to metal ion | 84/2897 | 373/18723 | 1.87e-04 | 3.44e-03 | 84 |
| GO:00009101 | Colorectum | SER | cytokinesis | 45/2897 | 173/18723 | 2.28e-04 | 3.93e-03 | 45 |
| GO:00325061 | Colorectum | SER | cytokinetic process | 15/2897 | 39/18723 | 4.16e-04 | 6.17e-03 | 15 |
| GO:00009102 | Colorectum | MSS | cytokinesis | 49/3467 | 173/18723 | 1.02e-03 | 1.02e-02 | 49 |
| GO:00100382 | Colorectum | MSS | response to metal ion | 90/3467 | 373/18723 | 3.76e-03 | 2.76e-02 | 90 |
| GO:00325062 | Colorectum | MSS | cytokinetic process | 14/3467 | 39/18723 | 7.79e-03 | 4.84e-02 | 14 |
| GO:00100383 | Colorectum | MSI-H | response to metal ion | 41/1319 | 373/18723 | 3.09e-03 | 3.87e-02 | 41 |
| GO:0051592 | Colorectum | FAP | response to calcium ion | 33/2622 | 149/18723 | 4.52e-03 | 3.08e-02 | 33 |
| GO:00009103 | Colorectum | FAP | cytokinesis | 37/2622 | 173/18723 | 5.10e-03 | 3.37e-02 | 37 |
| GO:00100384 | Colorectum | FAP | response to metal ion | 70/2622 | 373/18723 | 5.95e-03 | 3.75e-02 | 70 |
| GO:00009104 | Colorectum | CRC | cytokinesis | 34/2078 | 173/18723 | 6.47e-04 | 8.55e-03 | 34 |
| GO:00009108 | Endometrium | AEH | cytokinesis | 40/2100 | 173/18723 | 6.01e-06 | 1.49e-04 | 40 |
| GO:001003816 | Endometrium | AEH | response to metal ion | 65/2100 | 373/18723 | 2.02e-04 | 2.54e-03 | 65 |
| GO:00515927 | Endometrium | AEH | response to calcium ion | 28/2100 | 149/18723 | 4.22e-03 | 2.79e-02 | 28 |
| GO:000091013 | Endometrium | EEC | cytokinesis | 40/2168 | 173/18723 | 1.29e-05 | 2.60e-04 | 40 |
| GO:001003817 | Endometrium | EEC | response to metal ion | 66/2168 | 373/18723 | 2.86e-04 | 3.23e-03 | 66 |
| GO:005159215 | Endometrium | EEC | response to calcium ion | 28/2168 | 149/18723 | 6.52e-03 | 3.81e-02 | 28 |
| Page: 1 2 3 4 |
| Pathway ID | Tissue | Disease Stage | Description | Gene Ratio | Bg Ratio | pvalue | p.adjust | qvalue | Count |
| hsa05014 | Colorectum | AD | Amyotrophic lateral sclerosis | 164/2092 | 364/8465 | 4.28e-18 | 1.27e-16 | 8.09e-17 | 164 |
| hsa050141 | Colorectum | AD | Amyotrophic lateral sclerosis | 164/2092 | 364/8465 | 4.28e-18 | 1.27e-16 | 8.09e-17 | 164 |
| hsa050142 | Colorectum | SER | Amyotrophic lateral sclerosis | 138/1580 | 364/8465 | 9.89e-19 | 2.99e-17 | 2.17e-17 | 138 |
| hsa050143 | Colorectum | SER | Amyotrophic lateral sclerosis | 138/1580 | 364/8465 | 9.89e-19 | 2.99e-17 | 2.17e-17 | 138 |
| hsa050144 | Colorectum | MSS | Amyotrophic lateral sclerosis | 156/1875 | 364/8465 | 1.43e-19 | 4.62e-18 | 2.83e-18 | 156 |
| hsa050145 | Colorectum | MSS | Amyotrophic lateral sclerosis | 156/1875 | 364/8465 | 1.43e-19 | 4.62e-18 | 2.83e-18 | 156 |
| hsa050146 | Colorectum | MSI-H | Amyotrophic lateral sclerosis | 95/797 | 364/8465 | 2.31e-21 | 1.50e-19 | 1.26e-19 | 95 |
| hsa050147 | Colorectum | MSI-H | Amyotrophic lateral sclerosis | 95/797 | 364/8465 | 2.31e-21 | 1.50e-19 | 1.26e-19 | 95 |
| hsa050148 | Colorectum | FAP | Amyotrophic lateral sclerosis | 91/1404 | 364/8465 | 1.84e-05 | 2.36e-04 | 1.44e-04 | 91 |
| hsa050149 | Colorectum | FAP | Amyotrophic lateral sclerosis | 91/1404 | 364/8465 | 1.84e-05 | 2.36e-04 | 1.44e-04 | 91 |
| hsa0501420 | Endometrium | AEH | Amyotrophic lateral sclerosis | 123/1197 | 364/8465 | 2.17e-22 | 7.82e-21 | 5.72e-21 | 123 |
| hsa05014110 | Endometrium | AEH | Amyotrophic lateral sclerosis | 123/1197 | 364/8465 | 2.17e-22 | 7.82e-21 | 5.72e-21 | 123 |
| hsa0501425 | Endometrium | EEC | Amyotrophic lateral sclerosis | 128/1237 | 364/8465 | 9.83e-24 | 4.04e-22 | 3.01e-22 | 128 |
| hsa0501435 | Endometrium | EEC | Amyotrophic lateral sclerosis | 128/1237 | 364/8465 | 9.83e-24 | 4.04e-22 | 3.01e-22 | 128 |
| hsa0501430 | Esophagus | HGIN | Amyotrophic lateral sclerosis | 140/1383 | 364/8465 | 2.13e-25 | 1.16e-23 | 9.19e-24 | 140 |
| hsa05014113 | Esophagus | HGIN | Amyotrophic lateral sclerosis | 140/1383 | 364/8465 | 2.13e-25 | 1.16e-23 | 9.19e-24 | 140 |
| hsa05014210 | Esophagus | ESCC | Amyotrophic lateral sclerosis | 266/4205 | 364/8465 | 1.31e-20 | 2.20e-18 | 1.13e-18 | 266 |
| hsa0501438 | Esophagus | ESCC | Amyotrophic lateral sclerosis | 266/4205 | 364/8465 | 1.31e-20 | 2.20e-18 | 1.13e-18 | 266 |
| hsa0501414 | Liver | Cirrhotic | Amyotrophic lateral sclerosis | 187/2530 | 364/8465 | 1.56e-18 | 6.50e-17 | 4.01e-17 | 187 |
| hsa0501415 | Liver | Cirrhotic | Amyotrophic lateral sclerosis | 187/2530 | 364/8465 | 1.56e-18 | 6.50e-17 | 4.01e-17 | 187 |
| Page: 1 2 |
Top |
Cell-cell communication analysis |
| Identification of potential cell-cell interactions between two cell types and their ligand-receptor pairs for different disease states |
| Ligand | Receptor | LRpair | Pathway | Tissue | Disease Stage |
| Page: 1 |
Top |
Single-cell gene regulatory network inference analysis |
| Find out the significant the regulons (TFs) and the target genes of each regulon across cell types for different disease states |
| TF | Cell Type | Tissue | Disease Stage | Target Gene | RSS | Regulon Activity |
| ANXA11 | FIB | Prostate | BPH | ACTB,CXCL16,KRT7, etc. | 1.16e-02 |  |
| ANXA11 | MSC | Prostate | BPH | ACTB,CXCL16,KRT7, etc. | 3.40e-03 | |
| ∗The dot plots of a searched regulon are shown for all cell subpopulations in each disease state of each tissue based on the regulon specific score inferred using pySCENIC and by calculating the average expression. |
| Page: 1 |
Top |
Somatic mutation of malignant transformation related genes |
| Annotation of somatic variants for genes involved in malignant transformation |
| Hugo Symbol | Variant Class | Variant Classification | dbSNP RS | HGVSc | HGVSp | HGVSp Short | SWISSPROT | BIOTYPE | SIFT | PolyPhen | Tumor Sample Barcode | Tissue | Histology | Sex | Age | Stage | Therapy Types | Drugs | Outcome |
| ANXA11 | SNV | Missense_Mutation | c.1027N>G | p.Gln343Glu | p.Q343E | P50995 | protein_coding | deleterious(0.02) | possibly_damaging(0.704) | TCGA-BH-A18F-01 | Breast | breast invasive carcinoma | Female | <65 | I/II | Chemotherapy | taxotere | CR | |
| ANXA11 | SNV | Missense_Mutation | novel | c.1166N>A | p.Ala389Asp | p.A389D | P50995 | protein_coding | tolerated(0.06) | probably_damaging(0.944) | TCGA-E9-A1QZ-01 | Breast | breast invasive carcinoma | Female | <65 | I/II | Unknown | Unknown | SD |
| ANXA11 | insertion | Frame_Shift_Ins | novel | c.1366_1367insAGGGGATTACCGGAAG | p.Arg456GlnfsTer24 | p.R456Qfs*24 | P50995 | protein_coding | TCGA-A8-A06P-01 | Breast | breast invasive carcinoma | Female | <65 | III/IV | Unspecific | SD | |||
| ANXA11 | insertion | In_Frame_Ins | novel | c.1364_1365insACT | p.Ile455_Arg456insLeu | p.I455_R456insL | P50995 | protein_coding | TCGA-A8-A06P-01 | Breast | breast invasive carcinoma | Female | <65 | III/IV | Unspecific | SD | |||
| ANXA11 | SNV | Missense_Mutation | rs148593238 | c.1366C>T | p.Arg456Cys | p.R456C | P50995 | protein_coding | deleterious(0) | probably_damaging(1) | TCGA-2W-A8YY-01 | Cervix | cervical & endocervical cancer | Female | <65 | I/II | Chemotherapy | cisplatin | CR |
| ANXA11 | SNV | Missense_Mutation | novel | c.361C>T | p.Pro121Ser | p.P121S | P50995 | protein_coding | tolerated(0.07) | benign(0.009) | TCGA-2W-A8YY-01 | Cervix | cervical & endocervical cancer | Female | <65 | I/II | Chemotherapy | cisplatin | CR |
| ANXA11 | SNV | Missense_Mutation | c.894N>G | p.Ile298Met | p.I298M | P50995 | protein_coding | deleterious(0) | probably_damaging(0.995) | TCGA-C5-A1BQ-01 | Cervix | cervical & endocervical cancer | Female | >=65 | III/IV | Chemotherapy | cisplatin | CR | |
| ANXA11 | SNV | Missense_Mutation | novel | c.1489N>G | p.Leu497Val | p.L497V | P50995 | protein_coding | deleterious(0) | probably_damaging(0.963) | TCGA-IR-A3LF-01 | Cervix | cervical & endocervical cancer | Female | <65 | I/II | Unknown | Unknown | SD |
| ANXA11 | SNV | Missense_Mutation | c.954N>G | p.Phe318Leu | p.F318L | P50995 | protein_coding | deleterious(0.04) | benign(0.183) | TCGA-Q1-A73O-01 | Cervix | cervical & endocervical cancer | Female | <65 | I/II | Chemotherapy | cisplatin | CR | |
| ANXA11 | SNV | Missense_Mutation | novel | c.343T>A | p.Ser115Thr | p.S115T | P50995 | protein_coding | tolerated(0.43) | benign(0.014) | TCGA-AA-3947-01 | Colorectum | colon adenocarcinoma | Female | <65 | I/II | Unknown | Unknown | SD |
| Page: 1 2 3 4 5 |
Top |
Related drugs of malignant transformation related genes |
| Identification of chemicals and drugs interact with genes involved in malignant transfromation |
| (DGIdb 4.0) |
| Entrez ID | Symbol | Category | Interaction Types | Drug Claim Name | Drug Name | PMIDs |
| Page: 1 |

Copyright 2023-Present -The University of Texas Health Science Center at Houston |