
|
|||||
|
 | |
| |
| |
| |
| |
| |
|
Gene: ANXA10 |
Gene summary for ANXA10 |
| Gene information | Species | Human | Gene symbol | ANXA10 | Gene ID | 11199 |
| Gene name | annexin A10 | |
| Gene Alias | ANX14 | |
| Cytomap | 4q32.3 | |
| Gene Type | protein-coding | GO ID | GO:0005575 | UniProtAcc | Q9UJ72 |
Top |
Malignant transformation analysis |
| Identification of the aberrant gene expression in precancerous and cancerous lesions by comparing the gene expression of stem-like cells in diseased tissues with normal stem cells |
| Entrez ID | Symbol | Replicates | Species | Organ | Tissue | Adj P-value | Log2FC | Malignancy |
| 11199 | ANXA10 | Pat01-B | Human | Stomach | GC | 6.53e-69 | -1.06e+00 | 0.5754 |
| 11199 | ANXA10 | Pat02-B | Human | Stomach | GC | 3.63e-54 | -3.25e-01 | 0.0368 |
| 11199 | ANXA10 | Pat03-B | Human | Stomach | GC | 3.39e-32 | -4.33e-01 | 0.3693 |
| 11199 | ANXA10 | Pat04-B | Human | Stomach | GC | 1.12e-27 | -2.05e-01 | -0.1483 |
| 11199 | ANXA10 | Pat05-B | Human | Stomach | GC | 9.16e-25 | -3.38e-01 | -0.0353 |
| 11199 | ANXA10 | Pat06-B | Human | Stomach | GC | 1.02e-56 | -3.28e-01 | -0.1961 |
| 11199 | ANXA10 | Pat07-B | Human | Stomach | GC | 5.96e-24 | -1.43e+00 | 0.0935 |
| 11199 | ANXA10 | Pat08-B | Human | Stomach | GC | 3.35e-12 | -7.08e-01 | 0.0182 |
| 11199 | ANXA10 | Pat09-B | Human | Stomach | GC | 3.28e-14 | -2.81e-01 | -0.0359 |
| 11199 | ANXA10 | Pat10-B | Human | Stomach | GC | 5.88e-08 | -3.12e-01 | 0.084 |
| 11199 | ANXA10 | Pat11-B | Human | Stomach | GC | 2.73e-15 | -3.86e-02 | -0.182 |
| 11199 | ANXA10 | Pat12-B | Human | Stomach | GC | 1.18e-45 | -4.59e-01 | 0.0325 |
| 11199 | ANXA10 | Pat13-B | Human | Stomach | GC | 1.88e-39 | -1.16e+00 | 0.0555 |
| 11199 | ANXA10 | Pat15-B | Human | Stomach | GC | 4.00e-33 | -3.26e-01 | -0.0778 |
| 11199 | ANXA10 | Pat16-B | Human | Stomach | GC | 9.25e-52 | -9.55e-01 | 0.1918 |
| 11199 | ANXA10 | Pat17-B | Human | Stomach | GC | 1.92e-47 | -8.59e-01 | 0.3109 |
| 11199 | ANXA10 | Pat18-B | Human | Stomach | GC | 1.81e-37 | -3.20e-01 | -0.0432 |
| 11199 | ANXA10 | Pat19-B | Human | Stomach | GC | 1.51e-37 | -8.28e-01 | 0.0826 |
| 11199 | ANXA10 | Pat22-B | Human | Stomach | GC | 7.47e-28 | -2.56e-01 | -0.1042 |
| 11199 | ANXA10 | Pat24-B | Human | Stomach | GC | 1.42e-35 | -4.06e-01 | -0.1184 |
| Page: 1 2 |
| Tissue | Expression Dynamics | Abbreviation |
| GC | 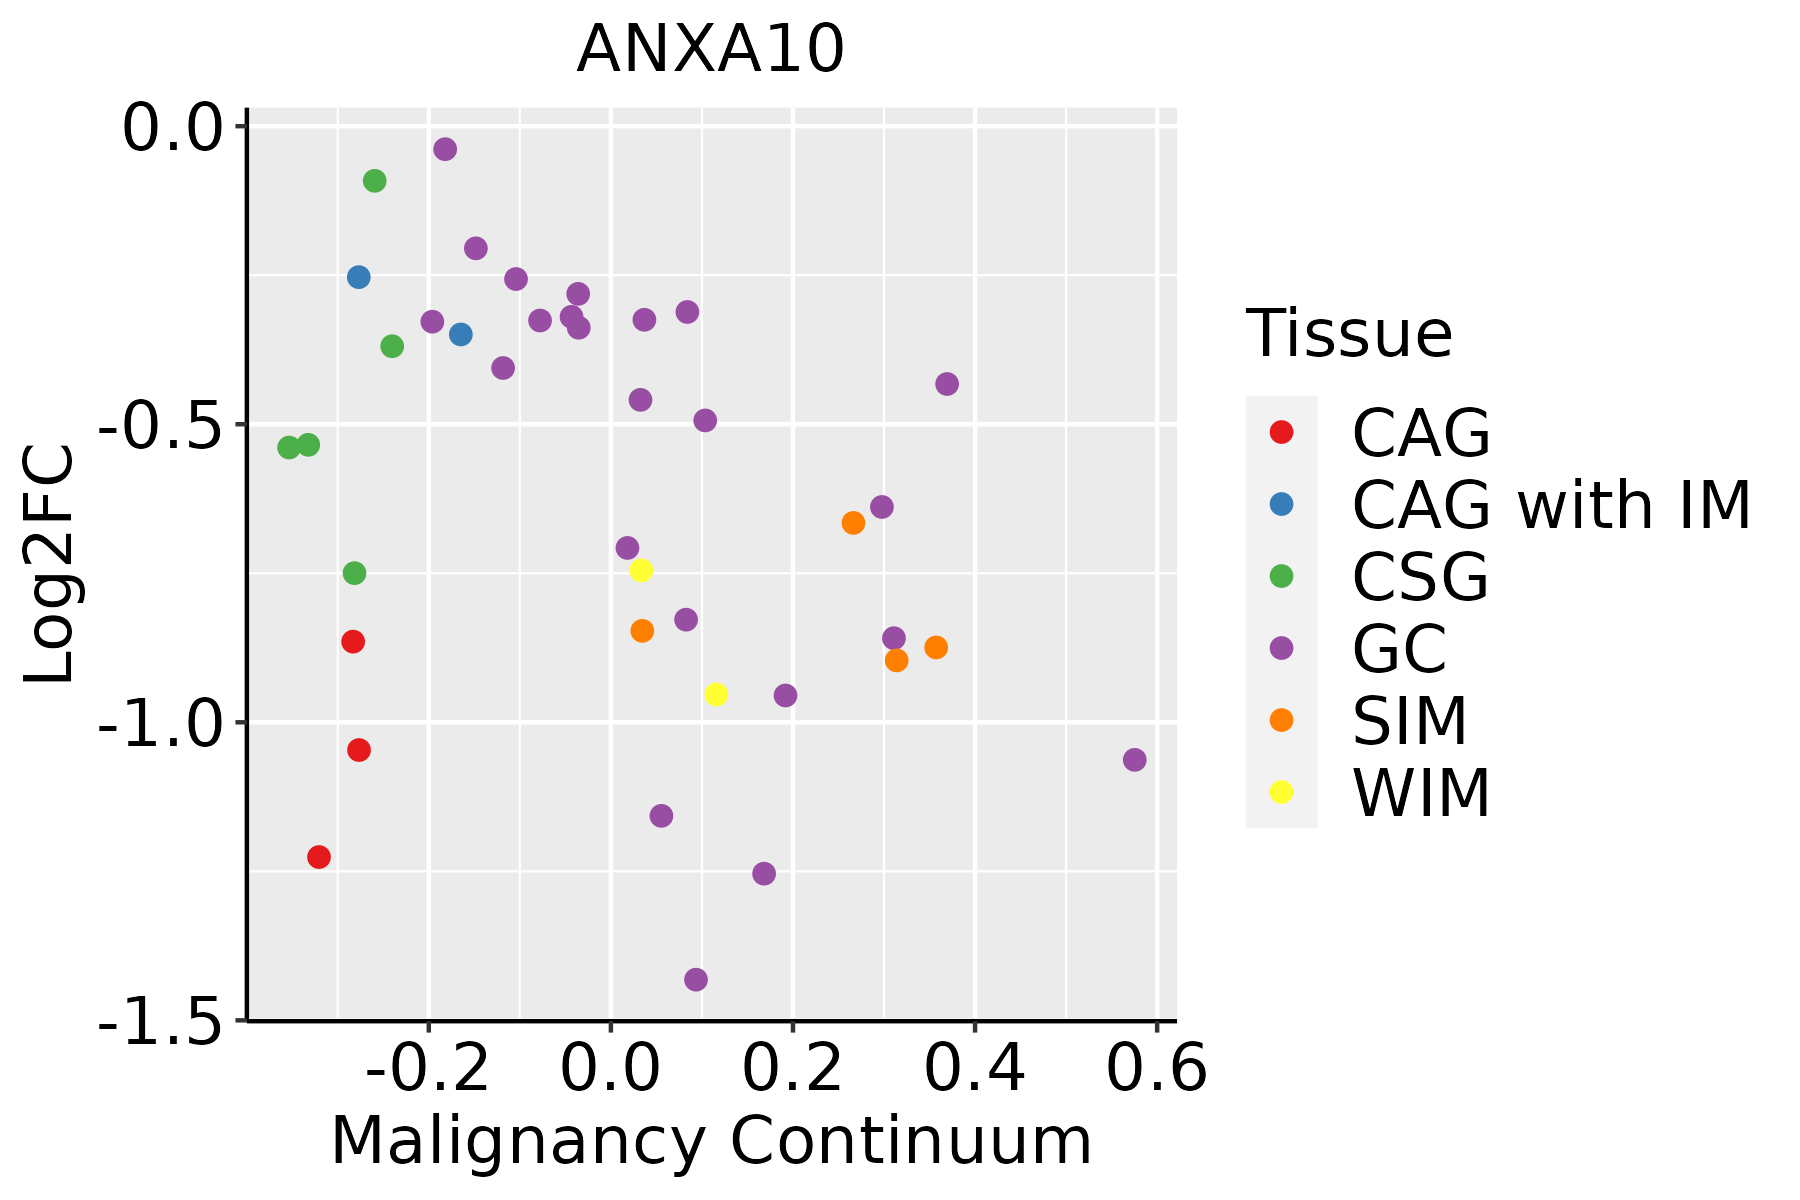 | CAG: Chronic atrophic gastritis |
| CAG with IM: Chronic atrophic gastritis with intestinal metaplasia | ||
| CSG: Chronic superficial gastritis | ||
| GC: Gastric cancer | ||
| SIM: Severe intestinal metaplasia | ||
| WIM: Wild intestinal metaplasia |
| ∗log2FC in expression of this searched gene in stem-like cells from each diseased tissue sample relative to stem-like cells in normal samples in each tissue plotted against the malignancy continuum. Samples are colored based on if they are from different disease stage. |
Top |
Malignant transformation related pathway analysis |
| Find out the enriched GO biological processes and KEGG pathways involved in transition from healthy to precancer to cancer |
| Tissue | Disease Stage | Enriched GO biological Processes |
| Colorectum | AD |  |
| Colorectum | SER |  |
| Colorectum | MSS |  |
| Colorectum | MSI-H |  |
| Colorectum | FAP |  |
| ∗Top 15 enriched GO BP terms are showed in the bar plot of each disease state in each tissue. Each row represents a significant GO biological process which is colored according to the -log10(p.adjust). |
| Page: 1 2 3 4 5 6 7 8 9 |
| GO ID | Tissue | Disease Stage | Description | Gene Ratio | Bg Ratio | pvalue | p.adjust | Count |
| Page: 1 |
| Pathway ID | Tissue | Disease Stage | Description | Gene Ratio | Bg Ratio | pvalue | p.adjust | qvalue | Count |
| Page: 1 |
Top |
Cell-cell communication analysis |
| Identification of potential cell-cell interactions between two cell types and their ligand-receptor pairs for different disease states |
| Ligand | Receptor | LRpair | Pathway | Tissue | Disease Stage |
| Page: 1 |
Top |
Single-cell gene regulatory network inference analysis |
| Find out the significant the regulons (TFs) and the target genes of each regulon across cell types for different disease states |
| TF | Cell Type | Tissue | Disease Stage | Target Gene | RSS | Regulon Activity |
| ∗The dot plots of a searched regulon are shown for all cell subpopulations in each disease state of each tissue based on the regulon specific score inferred using pySCENIC and by calculating the average expression. |
| Page: 1 |
Top |
Somatic mutation of malignant transformation related genes |
| Annotation of somatic variants for genes involved in malignant transformation |
| Hugo Symbol | Variant Class | Variant Classification | dbSNP RS | HGVSc | HGVSp | HGVSp Short | SWISSPROT | BIOTYPE | SIFT | PolyPhen | Tumor Sample Barcode | Tissue | Histology | Sex | Age | Stage | Therapy Types | Drugs | Outcome |
| ANXA10 | SNV | Missense_Mutation | c.873G>T | p.Glu291Asp | p.E291D | Q9UJ72 | protein_coding | tolerated(0.13) | probably_damaging(0.947) | TCGA-A2-A25A-01 | Breast | breast invasive carcinoma | Female | <65 | I/II | Unspecific | Cytoxan | SD | |
| ANXA10 | SNV | Missense_Mutation | rs377068264 | c.404N>G | p.Tyr135Cys | p.Y135C | Q9UJ72 | protein_coding | deleterious(0) | probably_damaging(0.916) | TCGA-AN-A0AK-01 | Breast | breast invasive carcinoma | Female | >=65 | I/II | Unknown | Unknown | SD |
| ANXA10 | SNV | Missense_Mutation | novel | c.289G>A | p.Glu97Lys | p.E97K | Q9UJ72 | protein_coding | deleterious(0.01) | possibly_damaging(0.67) | TCGA-BH-A2L8-01 | Breast | breast invasive carcinoma | Female | <65 | I/II | Chemotherapy | cytoxan | CR |
| ANXA10 | SNV | Missense_Mutation | c.325N>A | p.Glu109Lys | p.E109K | Q9UJ72 | protein_coding | deleterious(0.01) | benign(0.028) | TCGA-D8-A1XJ-01 | Breast | breast invasive carcinoma | Female | >=65 | III/IV | Hormone Therapy | tamoxiphen | SD | |
| ANXA10 | SNV | Missense_Mutation | c.873N>T | p.Glu291Asp | p.E291D | Q9UJ72 | protein_coding | tolerated(0.13) | probably_damaging(0.947) | TCGA-D8-A1XL-01 | Breast | breast invasive carcinoma | Female | <65 | I/II | Chemotherapy | doxorubicine+cyclophosphamide+tamoxifen | SD | |
| ANXA10 | insertion | Nonsense_Mutation | novel | c.878_879insAGAAGAGAAAATGACTACAGAAAAGGGGTGTGTCCACT | p.Tyr293Ter | p.Y293* | Q9UJ72 | protein_coding | TCGA-B6-A0I9-01 | Breast | breast invasive carcinoma | Female | <65 | III/IV | Unknown | Unknown | PD | ||
| ANXA10 | SNV | Missense_Mutation | novel | c.356N>C | p.Arg119Thr | p.R119T | Q9UJ72 | protein_coding | deleterious(0.01) | benign(0.433) | TCGA-VS-A9U7-01 | Cervix | cervical & endocervical cancer | Female | <65 | I/II | Chemotherapy | cisplatin | CR |
| ANXA10 | SNV | Missense_Mutation | c.17N>G | p.Tyr6Cys | p.Y6C | Q9UJ72 | protein_coding | tolerated(0.13) | benign(0) | TCGA-A6-6780-01 | Colorectum | colon adenocarcinoma | Male | >=65 | I/II | Unknown | Unknown | SD | |
| ANXA10 | SNV | Missense_Mutation | c.466A>G | p.Met156Val | p.M156V | Q9UJ72 | protein_coding | tolerated(1) | benign(0.001) | TCGA-AA-3663-01 | Colorectum | colon adenocarcinoma | Male | <65 | I/II | Unknown | Unknown | SD | |
| ANXA10 | SNV | Missense_Mutation | novel | c.820N>A | p.Leu274Ile | p.L274I | Q9UJ72 | protein_coding | tolerated(0.27) | probably_damaging(0.952) | TCGA-CA-6717-01 | Colorectum | colon adenocarcinoma | Male | <65 | I/II | Chemotherapy | oxaliplatin | CR |
| Page: 1 2 3 4 |
Top |
Related drugs of malignant transformation related genes |
| Identification of chemicals and drugs interact with genes involved in malignant transfromation |
| (DGIdb 4.0) |
| Entrez ID | Symbol | Category | Interaction Types | Drug Claim Name | Drug Name | PMIDs |
| Page: 1 |

Copyright 2023-Present -The University of Texas Health Science Center at Houston |