
|
|||||
|
 | |
| |
| |
| |
| |
| |
|
Gene: ANTXR2 |
Gene summary for ANTXR2 |
| Gene information | Species | Human | Gene symbol | ANTXR2 | Gene ID | 118429 |
| Gene name | ANTXR cell adhesion molecule 2 | |
| Gene Alias | CMG-2 | |
| Cytomap | 4q21.21 | |
| Gene Type | protein-coding | GO ID | GO:0006810 | UniProtAcc | P58335 |
Top |
Malignant transformation analysis |
| Identification of the aberrant gene expression in precancerous and cancerous lesions by comparing the gene expression of stem-like cells in diseased tissues with normal stem cells |
| Entrez ID | Symbol | Replicates | Species | Organ | Tissue | Adj P-value | Log2FC | Malignancy |
| 118429 | ANTXR2 | HTA11_3410_2000001011 | Human | Colorectum | AD | 2.74e-13 | -5.02e-01 | 0.0155 |
| 118429 | ANTXR2 | HTA11_866_3004761011 | Human | Colorectum | AD | 4.99e-09 | -4.86e-01 | 0.096 |
| 118429 | ANTXR2 | HTA11_10711_2000001011 | Human | Colorectum | AD | 3.32e-02 | -4.01e-01 | 0.0338 |
| 118429 | ANTXR2 | HTA11_7696_3000711011 | Human | Colorectum | AD | 2.10e-10 | -4.34e-01 | 0.0674 |
| 118429 | ANTXR2 | HTA11_99999971662_82457 | Human | Colorectum | MSS | 4.60e-09 | -4.35e-01 | 0.3859 |
| 118429 | ANTXR2 | HTA11_99999973899_84307 | Human | Colorectum | MSS | 1.47e-02 | -4.42e-01 | 0.2585 |
| 118429 | ANTXR2 | HTA11_99999974143_84620 | Human | Colorectum | MSS | 2.15e-16 | -5.32e-01 | 0.3005 |
| 118429 | ANTXR2 | F007 | Human | Colorectum | FAP | 1.61e-04 | -3.86e-01 | 0.1176 |
| 118429 | ANTXR2 | A015-C-203 | Human | Colorectum | FAP | 2.76e-22 | -4.81e-01 | -0.1294 |
| 118429 | ANTXR2 | A015-C-204 | Human | Colorectum | FAP | 1.68e-08 | -3.70e-01 | -0.0228 |
| 118429 | ANTXR2 | A014-C-040 | Human | Colorectum | FAP | 9.59e-06 | -5.34e-01 | -0.1184 |
| 118429 | ANTXR2 | A002-C-201 | Human | Colorectum | FAP | 3.90e-15 | -4.06e-01 | 0.0324 |
| 118429 | ANTXR2 | A001-C-119 | Human | Colorectum | FAP | 8.90e-12 | -5.24e-01 | -0.1557 |
| 118429 | ANTXR2 | A001-C-108 | Human | Colorectum | FAP | 5.04e-09 | -2.56e-01 | -0.0272 |
| 118429 | ANTXR2 | A002-C-205 | Human | Colorectum | FAP | 5.75e-22 | -5.24e-01 | -0.1236 |
| 118429 | ANTXR2 | A015-C-005 | Human | Colorectum | FAP | 2.22e-06 | -3.30e-01 | -0.0336 |
| 118429 | ANTXR2 | A015-C-006 | Human | Colorectum | FAP | 1.10e-15 | -5.38e-01 | -0.0994 |
| 118429 | ANTXR2 | A015-C-106 | Human | Colorectum | FAP | 3.40e-08 | -2.19e-01 | -0.0511 |
| 118429 | ANTXR2 | A002-C-114 | Human | Colorectum | FAP | 1.16e-16 | -4.29e-01 | -0.1561 |
| 118429 | ANTXR2 | A015-C-104 | Human | Colorectum | FAP | 4.80e-23 | -5.05e-01 | -0.1899 |
| Page: 1 2 3 4 |
| Tissue | Expression Dynamics | Abbreviation |
| Colorectum (GSE201348) |  | FAP: Familial adenomatous polyposis |
| CRC: Colorectal cancer | ||
| Colorectum (HTA11) |  | AD: Adenomas |
| SER: Sessile serrated lesions | ||
| MSI-H: Microsatellite-high colorectal cancer | ||
| MSS: Microsatellite stable colorectal cancer | ||
| Liver |  | HCC: Hepatocellular carcinoma |
| NAFLD: Non-alcoholic fatty liver disease | ||
| Oral Cavity |  | EOLP: Erosive Oral lichen planus |
| LP: leukoplakia | ||
| NEOLP: Non-erosive oral lichen planus | ||
| OSCC: Oral squamous cell carcinoma | ||
| Prostate |  | BPH: Benign Prostatic Hyperplasia |
| Thyroid | 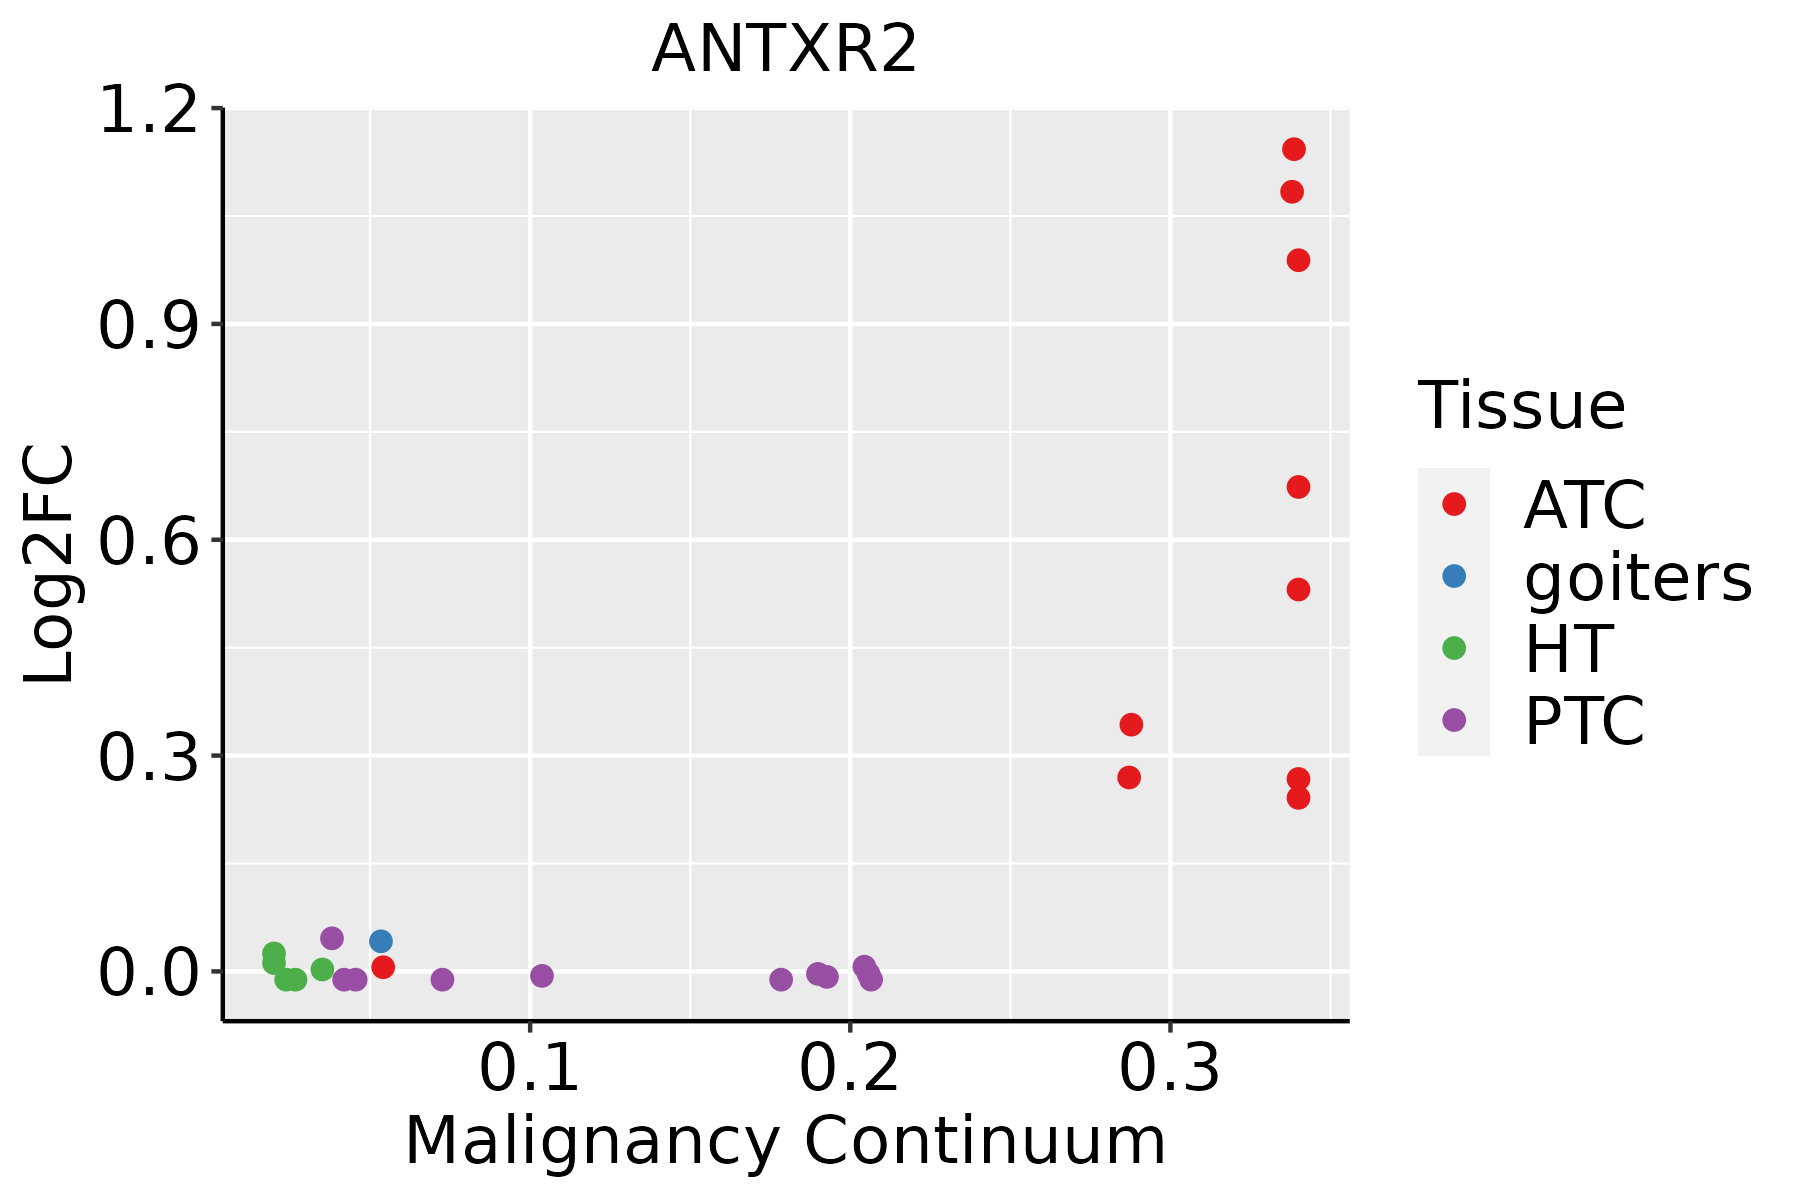 | ATC: Anaplastic thyroid cancer |
| HT: Hashimoto's thyroiditis | ||
| PTC: Papillary thyroid cancer |
| ∗log2FC in expression of this searched gene in stem-like cells from each diseased tissue sample relative to stem-like cells in normal samples in each tissue plotted against the malignancy continuum. Samples are colored based on if they are from different disease stage. |
Top |
Malignant transformation related pathway analysis |
| Find out the enriched GO biological processes and KEGG pathways involved in transition from healthy to precancer to cancer |
| Tissue | Disease Stage | Enriched GO biological Processes |
| Colorectum | AD |  |
| Colorectum | SER |  |
| Colorectum | MSS |  |
| Colorectum | MSI-H |  |
| Colorectum | FAP |  |
| ∗Top 15 enriched GO BP terms are showed in the bar plot of each disease state in each tissue. Each row represents a significant GO biological process which is colored according to the -log10(p.adjust). |
| Page: 1 2 3 4 5 6 7 8 9 |
| GO ID | Tissue | Disease Stage | Description | Gene Ratio | Bg Ratio | pvalue | p.adjust | Count |
| GO:19019986 | Oral cavity | OSCC | toxin transport | 25/7305 | 40/18723 | 2.22e-03 | 1.00e-02 | 25 |
| GO:19019985 | Prostate | BPH | toxin transport | 15/3107 | 40/18723 | 1.21e-03 | 7.41e-03 | 15 |
| GO:190199811 | Prostate | Tumor | toxin transport | 16/3246 | 40/18723 | 5.99e-04 | 4.29e-03 | 16 |
| GO:190199813 | Thyroid | ATC | toxin transport | 25/6293 | 40/18723 | 1.72e-04 | 1.17e-03 | 25 |
| Page: 1 |
| Pathway ID | Tissue | Disease Stage | Description | Gene Ratio | Bg Ratio | pvalue | p.adjust | qvalue | Count |
| hsa046218 | Oral cavity | OSCC | NOD-like receptor signaling pathway | 108/3704 | 186/8465 | 5.13e-05 | 2.07e-04 | 1.05e-04 | 108 |
| hsa0462113 | Oral cavity | OSCC | NOD-like receptor signaling pathway | 108/3704 | 186/8465 | 5.13e-05 | 2.07e-04 | 1.05e-04 | 108 |
| hsa046214 | Oral cavity | EOLP | NOD-like receptor signaling pathway | 48/1218 | 186/8465 | 2.51e-05 | 1.31e-04 | 7.70e-05 | 48 |
| hsa046215 | Oral cavity | EOLP | NOD-like receptor signaling pathway | 48/1218 | 186/8465 | 2.51e-05 | 1.31e-04 | 7.70e-05 | 48 |
| Page: 1 |
Top |
Cell-cell communication analysis |
| Identification of potential cell-cell interactions between two cell types and their ligand-receptor pairs for different disease states |
| Ligand | Receptor | LRpair | Pathway | Tissue | Disease Stage |
| Page: 1 |
Top |
Single-cell gene regulatory network inference analysis |
| Find out the significant the regulons (TFs) and the target genes of each regulon across cell types for different disease states |
| TF | Cell Type | Tissue | Disease Stage | Target Gene | RSS | Regulon Activity |
| ∗The dot plots of a searched regulon are shown for all cell subpopulations in each disease state of each tissue based on the regulon specific score inferred using pySCENIC and by calculating the average expression. |
| Page: 1 |
Top |
Somatic mutation of malignant transformation related genes |
| Annotation of somatic variants for genes involved in malignant transformation |
| Hugo Symbol | Variant Class | Variant Classification | dbSNP RS | HGVSc | HGVSp | HGVSp Short | SWISSPROT | BIOTYPE | SIFT | PolyPhen | Tumor Sample Barcode | Tissue | Histology | Sex | Age | Stage | Therapy Types | Drugs | Outcome |
| ANTXR2 | SNV | Missense_Mutation | c.1160N>T | p.Gly387Val | p.G387V | P58335 | protein_coding | deleterious(0) | probably_damaging(0.952) | TCGA-D8-A1J9-01 | Breast | breast invasive carcinoma | Female | <65 | I/II | Unknown | Unknown | SD | |
| ANTXR2 | SNV | Missense_Mutation | c.1130N>T | p.Asp377Val | p.D377V | P58335 | protein_coding | deleterious(0) | probably_damaging(0.989) | TCGA-A6-5661-01 | Colorectum | colon adenocarcinoma | Female | >=65 | I/II | Unknown | Unknown | SD | |
| ANTXR2 | SNV | Missense_Mutation | novel | c.217N>A | p.Phe73Ile | p.F73I | P58335 | protein_coding | deleterious(0) | probably_damaging(1) | TCGA-AA-3984-01 | Colorectum | colon adenocarcinoma | Female | <65 | I/II | Unknown | Unknown | SD |
| ANTXR2 | SNV | Missense_Mutation | c.390N>C | p.Gln130His | p.Q130H | P58335 | protein_coding | deleterious(0) | probably_damaging(0.996) | TCGA-AA-A00N-01 | Colorectum | colon adenocarcinoma | Male | >=65 | I/II | Unknown | Unknown | PD | |
| ANTXR2 | SNV | Missense_Mutation | rs767242762 | c.1295N>A | p.Arg432Gln | p.R432Q | P58335 | protein_coding | tolerated(0.11) | benign(0.029) | TCGA-AA-A010-01 | Colorectum | colon adenocarcinoma | Female | <65 | I/II | Chemotherapy | folinic | CR |
| ANTXR2 | SNV | Missense_Mutation | c.1123N>C | p.Thr375Pro | p.T375P | P58335 | protein_coding | deleterious(0) | probably_damaging(0.987) | TCGA-AA-A01P-01 | Colorectum | colon adenocarcinoma | Female | >=65 | III/IV | Unknown | Unknown | PD | |
| ANTXR2 | SNV | Missense_Mutation | c.1172N>T | p.Arg391Ile | p.R391I | P58335 | protein_coding | deleterious(0) | probably_damaging(0.981) | TCGA-CA-6717-01 | Colorectum | colon adenocarcinoma | Male | <65 | I/II | Chemotherapy | oxaliplatin | CR | |
| ANTXR2 | SNV | Missense_Mutation | c.293N>G | p.Asp98Gly | p.D98G | P58335 | protein_coding | deleterious(0) | possibly_damaging(0.765) | TCGA-CA-6717-01 | Colorectum | colon adenocarcinoma | Male | <65 | I/II | Chemotherapy | oxaliplatin | CR | |
| ANTXR2 | SNV | Missense_Mutation | rs756324499 | c.958N>A | p.Ala320Thr | p.A320T | P58335 | protein_coding | tolerated(0.41) | possibly_damaging(0.677) | TCGA-D5-6928-01 | Colorectum | colon adenocarcinoma | Male | >=65 | I/II | Unknown | Unknown | SD |
| ANTXR2 | SNV | Missense_Mutation | c.1034G>T | p.Cys345Phe | p.C345F | P58335 | protein_coding | deleterious(0.01) | probably_damaging(0.999) | TCGA-AH-6544-01 | Colorectum | rectum adenocarcinoma | Male | <65 | III/IV | Chemotherapy | oxaliplatin | SD |
| Page: 1 2 3 4 5 6 |
Top |
Related drugs of malignant transformation related genes |
| Identification of chemicals and drugs interact with genes involved in malignant transfromation |
| (DGIdb 4.0) |
| Entrez ID | Symbol | Category | Interaction Types | Drug Claim Name | Drug Name | PMIDs |
| Page: 1 |

Copyright 2023-Present -The University of Texas Health Science Center at Houston |