
|
|||||
|
 | |
| |
| |
| |
| |
| |
|
Gene: ANOS1 |
Gene summary for ANOS1 |
| Gene information | Species | Human | Gene symbol | ANOS1 | Gene ID | 3730 |
| Gene name | anosmin 1 | |
| Gene Alias | ADMLX | |
| Cytomap | Xp22.31 | |
| Gene Type | protein-coding | GO ID | GO:0000902 | UniProtAcc | P23352 |
Top |
Malignant transformation analysis |
| Identification of the aberrant gene expression in precancerous and cancerous lesions by comparing the gene expression of stem-like cells in diseased tissues with normal stem cells |
| Entrez ID | Symbol | Replicates | Species | Organ | Tissue | Adj P-value | Log2FC | Malignancy |
| 3730 | ANOS1 | LZE8T | Human | Esophagus | ESCC | 2.44e-04 | 1.06e-01 | 0.067 |
| 3730 | ANOS1 | LZE24T | Human | Esophagus | ESCC | 4.07e-02 | 1.73e-01 | 0.0596 |
| 3730 | ANOS1 | P2T-E | Human | Esophagus | ESCC | 2.17e-17 | 5.06e-01 | 0.1177 |
| 3730 | ANOS1 | P4T-E | Human | Esophagus | ESCC | 5.20e-07 | 2.47e-01 | 0.1323 |
| 3730 | ANOS1 | P8T-E | Human | Esophagus | ESCC | 3.62e-61 | 1.22e+00 | 0.0889 |
| 3730 | ANOS1 | P10T-E | Human | Esophagus | ESCC | 5.77e-07 | 1.34e-01 | 0.116 |
| 3730 | ANOS1 | P12T-E | Human | Esophagus | ESCC | 1.81e-39 | 8.29e-01 | 0.1122 |
| 3730 | ANOS1 | P15T-E | Human | Esophagus | ESCC | 9.42e-11 | 3.32e-01 | 0.1149 |
| 3730 | ANOS1 | P16T-E | Human | Esophagus | ESCC | 1.24e-19 | 4.41e-01 | 0.1153 |
| 3730 | ANOS1 | P23T-E | Human | Esophagus | ESCC | 5.02e-09 | 2.98e-01 | 0.108 |
| 3730 | ANOS1 | P26T-E | Human | Esophagus | ESCC | 2.85e-22 | 5.66e-01 | 0.1276 |
| 3730 | ANOS1 | P27T-E | Human | Esophagus | ESCC | 1.80e-15 | 3.56e-01 | 0.1055 |
| 3730 | ANOS1 | P30T-E | Human | Esophagus | ESCC | 4.70e-12 | 5.41e-01 | 0.137 |
| 3730 | ANOS1 | P42T-E | Human | Esophagus | ESCC | 1.81e-03 | 2.04e-01 | 0.1175 |
| 3730 | ANOS1 | P48T-E | Human | Esophagus | ESCC | 1.79e-10 | 2.15e-01 | 0.0959 |
| 3730 | ANOS1 | P52T-E | Human | Esophagus | ESCC | 1.50e-03 | 1.14e-01 | 0.1555 |
| 3730 | ANOS1 | P54T-E | Human | Esophagus | ESCC | 9.08e-16 | 5.03e-01 | 0.0975 |
| 3730 | ANOS1 | P56T-E | Human | Esophagus | ESCC | 3.84e-18 | 3.12e+00 | 0.1613 |
| 3730 | ANOS1 | P57T-E | Human | Esophagus | ESCC | 1.57e-17 | 5.99e-01 | 0.0926 |
| 3730 | ANOS1 | P61T-E | Human | Esophagus | ESCC | 1.68e-22 | 6.08e-01 | 0.099 |
| Page: 1 2 |
| Tissue | Expression Dynamics | Abbreviation |
| Esophagus |  | ESCC: Esophageal squamous cell carcinoma |
| HGIN: High-grade intraepithelial neoplasias | ||
| LGIN: Low-grade intraepithelial neoplasias | ||
| Thyroid | 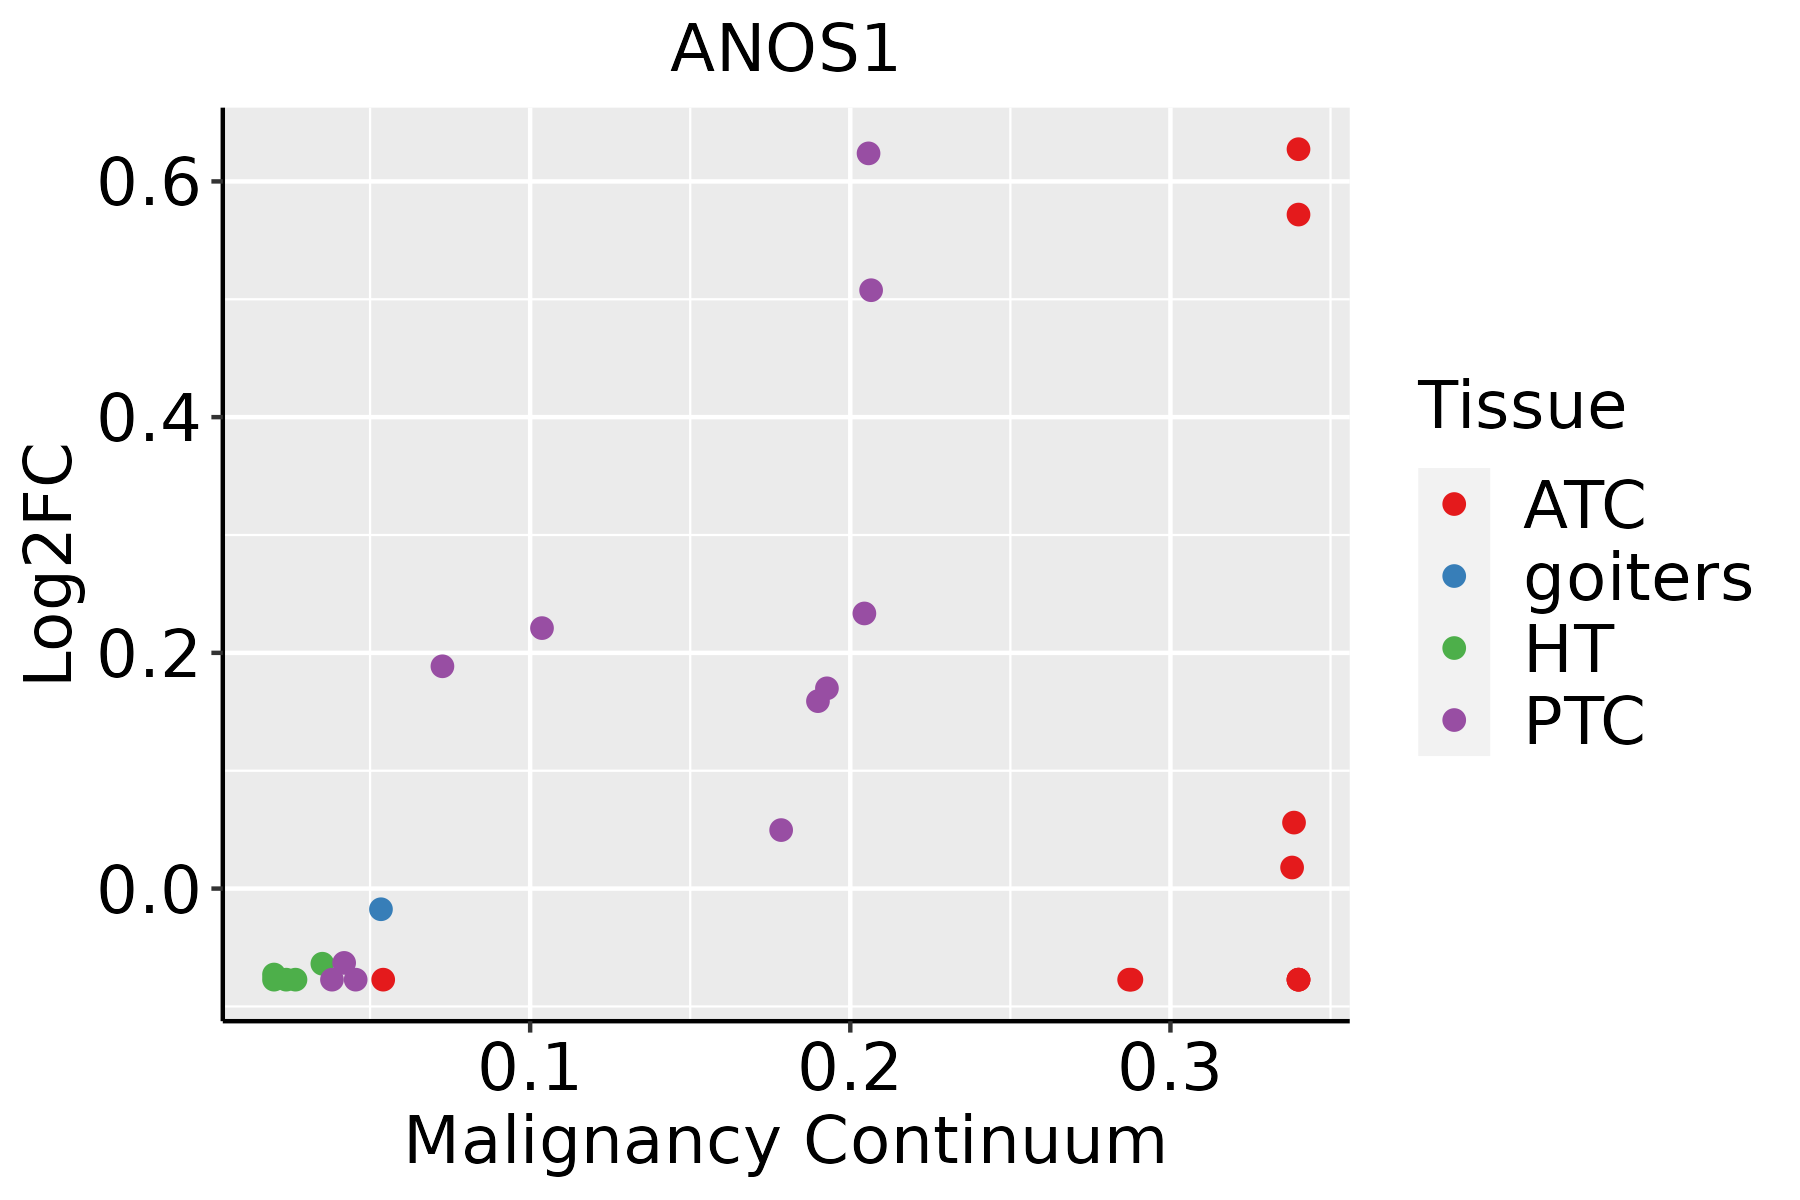 | ATC: Anaplastic thyroid cancer |
| HT: Hashimoto's thyroiditis | ||
| PTC: Papillary thyroid cancer |
| ∗log2FC in expression of this searched gene in stem-like cells from each diseased tissue sample relative to stem-like cells in normal samples in each tissue plotted against the malignancy continuum. Samples are colored based on if they are from different disease stage. |
Top |
Malignant transformation related pathway analysis |
| Find out the enriched GO biological processes and KEGG pathways involved in transition from healthy to precancer to cancer |
| Tissue | Disease Stage | Enriched GO biological Processes |
| Colorectum | AD |  |
| Colorectum | SER |  |
| Colorectum | MSS |  |
| Colorectum | MSI-H |  |
| Colorectum | FAP |  |
| ∗Top 15 enriched GO BP terms are showed in the bar plot of each disease state in each tissue. Each row represents a significant GO biological process which is colored according to the -log10(p.adjust). |
| Page: 1 2 3 4 5 6 7 8 9 |
| GO ID | Tissue | Disease Stage | Description | Gene Ratio | Bg Ratio | pvalue | p.adjust | Count |
| GO:0052547111 | Esophagus | ESCC | regulation of peptidase activity | 275/8552 | 461/18723 | 7.54e-10 | 1.88e-08 | 275 |
| GO:0052548111 | Esophagus | ESCC | regulation of endopeptidase activity | 253/8552 | 432/18723 | 3.68e-08 | 6.78e-07 | 253 |
| GO:0045861111 | Esophagus | ESCC | negative regulation of proteolysis | 195/8552 | 351/18723 | 1.13e-04 | 7.85e-04 | 195 |
| GO:0051346110 | Esophagus | ESCC | negative regulation of hydrolase activity | 208/8552 | 379/18723 | 1.76e-04 | 1.14e-03 | 208 |
| GO:006156415 | Esophagus | ESCC | axon development | 251/8552 | 467/18723 | 2.41e-04 | 1.49e-03 | 251 |
| GO:000740915 | Esophagus | ESCC | axonogenesis | 219/8552 | 418/18723 | 3.14e-03 | 1.31e-02 | 219 |
| GO:001046620 | Esophagus | ESCC | negative regulation of peptidase activity | 140/8552 | 262/18723 | 6.73e-03 | 2.46e-02 | 140 |
| GO:001095119 | Esophagus | ESCC | negative regulation of endopeptidase activity | 135/8552 | 252/18723 | 6.86e-03 | 2.51e-02 | 135 |
| GO:000989622 | Liver | HCC | positive regulation of catabolic process | 335/7958 | 492/18723 | 3.83e-31 | 1.87e-28 | 335 |
| GO:003133122 | Liver | HCC | positive regulation of cellular catabolic process | 295/7958 | 427/18723 | 3.20e-29 | 1.45e-26 | 295 |
| GO:004427021 | Liver | HCC | cellular nitrogen compound catabolic process | 303/7958 | 451/18723 | 9.76e-27 | 3.64e-24 | 303 |
| GO:004670021 | Liver | HCC | heterocycle catabolic process | 299/7958 | 445/18723 | 2.07e-26 | 7.29e-24 | 299 |
| GO:190136121 | Liver | HCC | organic cyclic compound catabolic process | 325/7958 | 495/18723 | 6.52e-26 | 2.18e-23 | 325 |
| GO:001943921 | Liver | HCC | aromatic compound catabolic process | 309/7958 | 467/18723 | 1.56e-25 | 4.94e-23 | 309 |
| GO:000640121 | Liver | HCC | RNA catabolic process | 201/7958 | 278/18723 | 3.88e-24 | 1.02e-21 | 201 |
| GO:003465521 | Liver | HCC | nucleobase-containing compound catabolic process | 273/7958 | 407/18723 | 4.84e-24 | 1.23e-21 | 273 |
| GO:190331121 | Liver | HCC | regulation of mRNA metabolic process | 205/7958 | 288/18723 | 3.38e-23 | 6.90e-21 | 205 |
| GO:000640221 | Liver | HCC | mRNA catabolic process | 169/7958 | 232/18723 | 4.50e-21 | 6.96e-19 | 169 |
| GO:000641722 | Liver | HCC | regulation of translation | 287/7958 | 468/18723 | 8.79e-17 | 8.08e-15 | 287 |
| GO:004348721 | Liver | HCC | regulation of RNA stability | 119/7958 | 170/18723 | 3.20e-13 | 1.71e-11 | 119 |
| Page: 1 2 3 |
| Pathway ID | Tissue | Disease Stage | Description | Gene Ratio | Bg Ratio | pvalue | p.adjust | qvalue | Count |
| Page: 1 |
Top |
Cell-cell communication analysis |
| Identification of potential cell-cell interactions between two cell types and their ligand-receptor pairs for different disease states |
| Ligand | Receptor | LRpair | Pathway | Tissue | Disease Stage |
| Page: 1 |
Top |
Single-cell gene regulatory network inference analysis |
| Find out the significant the regulons (TFs) and the target genes of each regulon across cell types for different disease states |
| TF | Cell Type | Tissue | Disease Stage | Target Gene | RSS | Regulon Activity |
| ∗The dot plots of a searched regulon are shown for all cell subpopulations in each disease state of each tissue based on the regulon specific score inferred using pySCENIC and by calculating the average expression. |
| Page: 1 |
Top |
Somatic mutation of malignant transformation related genes |
| Annotation of somatic variants for genes involved in malignant transformation |
| Hugo Symbol | Variant Class | Variant Classification | dbSNP RS | HGVSc | HGVSp | HGVSp Short | SWISSPROT | BIOTYPE | SIFT | PolyPhen | Tumor Sample Barcode | Tissue | Histology | Sex | Age | Stage | Therapy Types | Drugs | Outcome |
| ANOS1 | SNV | Missense_Mutation | c.276N>C | p.Glu92Asp | p.E92D | P23352 | protein_coding | tolerated(0.17) | benign(0.003) | TCGA-AN-A0XW-01 | Breast | breast invasive carcinoma | Female | <65 | III/IV | Unknown | Unknown | SD | |
| ANOS1 | SNV | Missense_Mutation | c.590C>T | p.Ser197Phe | p.S197F | P23352 | protein_coding | deleterious(0) | probably_damaging(0.983) | TCGA-AO-A128-01 | Breast | breast invasive carcinoma | Female | <65 | I/II | Chemotherapy | doxorubicin | SD | |
| ANOS1 | SNV | Missense_Mutation | novel | c.1418C>T | p.Thr473Ile | p.T473I | P23352 | protein_coding | tolerated(0.13) | benign(0.072) | TCGA-UU-A93S-01 | Breast | breast invasive carcinoma | Female | <65 | III/IV | Unknown | Unknown | PD |
| ANOS1 | SNV | Missense_Mutation | novel | c.889N>T | p.Arg297Trp | p.R297W | P23352 | protein_coding | deleterious(0.01) | probably_damaging(0.955) | TCGA-2W-A8YY-01 | Cervix | cervical & endocervical cancer | Female | <65 | I/II | Chemotherapy | cisplatin | CR |
| ANOS1 | SNV | Missense_Mutation | c.1375N>G | p.His459Asp | p.H459D | P23352 | protein_coding | tolerated(0.2) | benign(0.28) | TCGA-DR-A0ZM-01 | Cervix | cervical & endocervical cancer | Female | <65 | III/IV | Unspecific | Cisplatin | SD | |
| ANOS1 | SNV | Missense_Mutation | novel | c.1672N>A | p.Phe558Ile | p.F558I | P23352 | protein_coding | deleterious(0) | probably_damaging(0.981) | TCGA-DS-A1OA-01 | Cervix | cervical & endocervical cancer | Female | >=65 | I/II | Chemotherapy | carboplatin | PD |
| ANOS1 | SNV | Missense_Mutation | novel | c.1523A>C | p.Lys508Thr | p.K508T | P23352 | protein_coding | tolerated(0.1) | benign(0.007) | TCGA-FU-A3HZ-01 | Cervix | cervical & endocervical cancer | Female | <65 | I/II | Chemotherapy | cisplatin | CR |
| ANOS1 | SNV | Missense_Mutation | c.761N>A | p.Arg254Lys | p.R254K | P23352 | protein_coding | deleterious(0.02) | probably_damaging(0.93) | TCGA-VS-A9V3-01 | Cervix | cervical & endocervical cancer | Female | <65 | I/II | Chemotherapy | cisplatin | PD | |
| ANOS1 | insertion | Frame_Shift_Ins | novel | c.1673_1674insGACACAGA | p.Phe558LeufsTer9 | p.F558Lfs*9 | P23352 | protein_coding | TCGA-DS-A1OA-01 | Cervix | cervical & endocervical cancer | Female | >=65 | I/II | Chemotherapy | carboplatin | PD | ||
| ANOS1 | SNV | Missense_Mutation | c.494N>T | p.Ser165Leu | p.S165L | P23352 | protein_coding | tolerated(0.1) | probably_damaging(0.937) | TCGA-A6-6780-01 | Colorectum | colon adenocarcinoma | Male | >=65 | I/II | Unknown | Unknown | SD |
| Page: 1 2 3 4 5 6 7 8 9 10 11 |
Top |
Related drugs of malignant transformation related genes |
| Identification of chemicals and drugs interact with genes involved in malignant transfromation |
| (DGIdb 4.0) |
| Entrez ID | Symbol | Category | Interaction Types | Drug Claim Name | Drug Name | PMIDs |
| Page: 1 |

Copyright 2023-Present -The University of Texas Health Science Center at Houston |