
|
|||||
|
 | |
| |
| |
| |
| |
| |
|
Gene: ANO7 |
Gene summary for ANO7 |
| Gene information | Species | Human | Gene symbol | ANO7 | Gene ID | 50636 |
| Gene name | anoctamin 7 | |
| Gene Alias | D-TMPP | |
| Cytomap | 2q37.3 | |
| Gene Type | protein-coding | GO ID | GO:0006810 | UniProtAcc | Q6IWH7 |
Top |
Malignant transformation analysis |
| Identification of the aberrant gene expression in precancerous and cancerous lesions by comparing the gene expression of stem-like cells in diseased tissues with normal stem cells |
| Entrez ID | Symbol | Replicates | Species | Organ | Tissue | Adj P-value | Log2FC | Malignancy |
| 50636 | ANO7 | HTA11_78_2000001011 | Human | Colorectum | AD | 2.79e-02 | 2.17e-01 | -0.1088 |
| 50636 | ANO7 | HTA11_2112_2000001011 | Human | Colorectum | SER | 7.02e-03 | 4.42e-01 | -0.2196 |
| 50636 | ANO7 | HTA11_3361_2000001011 | Human | Colorectum | AD | 9.33e-05 | 3.59e-01 | -0.1207 |
| 50636 | ANO7 | HTA11_696_2000001011 | Human | Colorectum | AD | 2.92e-11 | 4.11e-01 | -0.1464 |
| 50636 | ANO7 | HTA11_866_2000001011 | Human | Colorectum | AD | 2.31e-07 | 2.60e-01 | -0.1001 |
| 50636 | ANO7 | P15T-E | Human | Esophagus | ESCC | 1.14e-06 | 1.32e-01 | 0.1149 |
| 50636 | ANO7 | P16T-E | Human | Esophagus | ESCC | 8.40e-04 | 1.14e-01 | 0.1153 |
| 50636 | ANO7 | P21T-E | Human | Esophagus | ESCC | 3.89e-12 | 2.12e-01 | 0.1617 |
| 50636 | ANO7 | P28T-E | Human | Esophagus | ESCC | 8.84e-05 | 1.26e-01 | 0.1149 |
| 50636 | ANO7 | P49T-E | Human | Esophagus | ESCC | 1.65e-02 | 2.14e-01 | 0.1768 |
| 50636 | ANO7 | P62T-E | Human | Esophagus | ESCC | 1.36e-04 | 6.56e-02 | 0.1302 |
| 50636 | ANO7 | P74T-E | Human | Esophagus | ESCC | 4.38e-05 | 1.27e-01 | 0.1479 |
| 50636 | ANO7 | P76T-E | Human | Esophagus | ESCC | 4.17e-05 | 1.35e-01 | 0.1207 |
| 50636 | ANO7 | P79T-E | Human | Esophagus | ESCC | 3.75e-03 | 7.32e-02 | 0.1154 |
| 50636 | ANO7 | P82T-E | Human | Esophagus | ESCC | 4.27e-06 | 2.23e-01 | 0.1072 |
| 50636 | ANO7 | P83T-E | Human | Esophagus | ESCC | 7.64e-05 | 1.74e-01 | 0.1738 |
| 50636 | ANO7 | P89T-E | Human | Esophagus | ESCC | 2.04e-03 | 2.45e-01 | 0.1752 |
| 50636 | ANO7 | P94T-E | Human | Esophagus | ESCC | 1.43e-02 | 5.38e-01 | 0.0879 |
| 50636 | ANO7 | P104T-E | Human | Esophagus | ESCC | 4.22e-12 | 5.60e-01 | 0.0931 |
| 50636 | ANO7 | P107T-E | Human | Esophagus | ESCC | 3.88e-05 | 8.81e-02 | 0.171 |
| Page: 1 2 |
| Tissue | Expression Dynamics | Abbreviation |
| Colorectum (GSE201348) |  | FAP: Familial adenomatous polyposis |
| CRC: Colorectal cancer | ||
| Colorectum (HTA11) |  | AD: Adenomas |
| SER: Sessile serrated lesions | ||
| MSI-H: Microsatellite-high colorectal cancer | ||
| MSS: Microsatellite stable colorectal cancer | ||
| Esophagus | 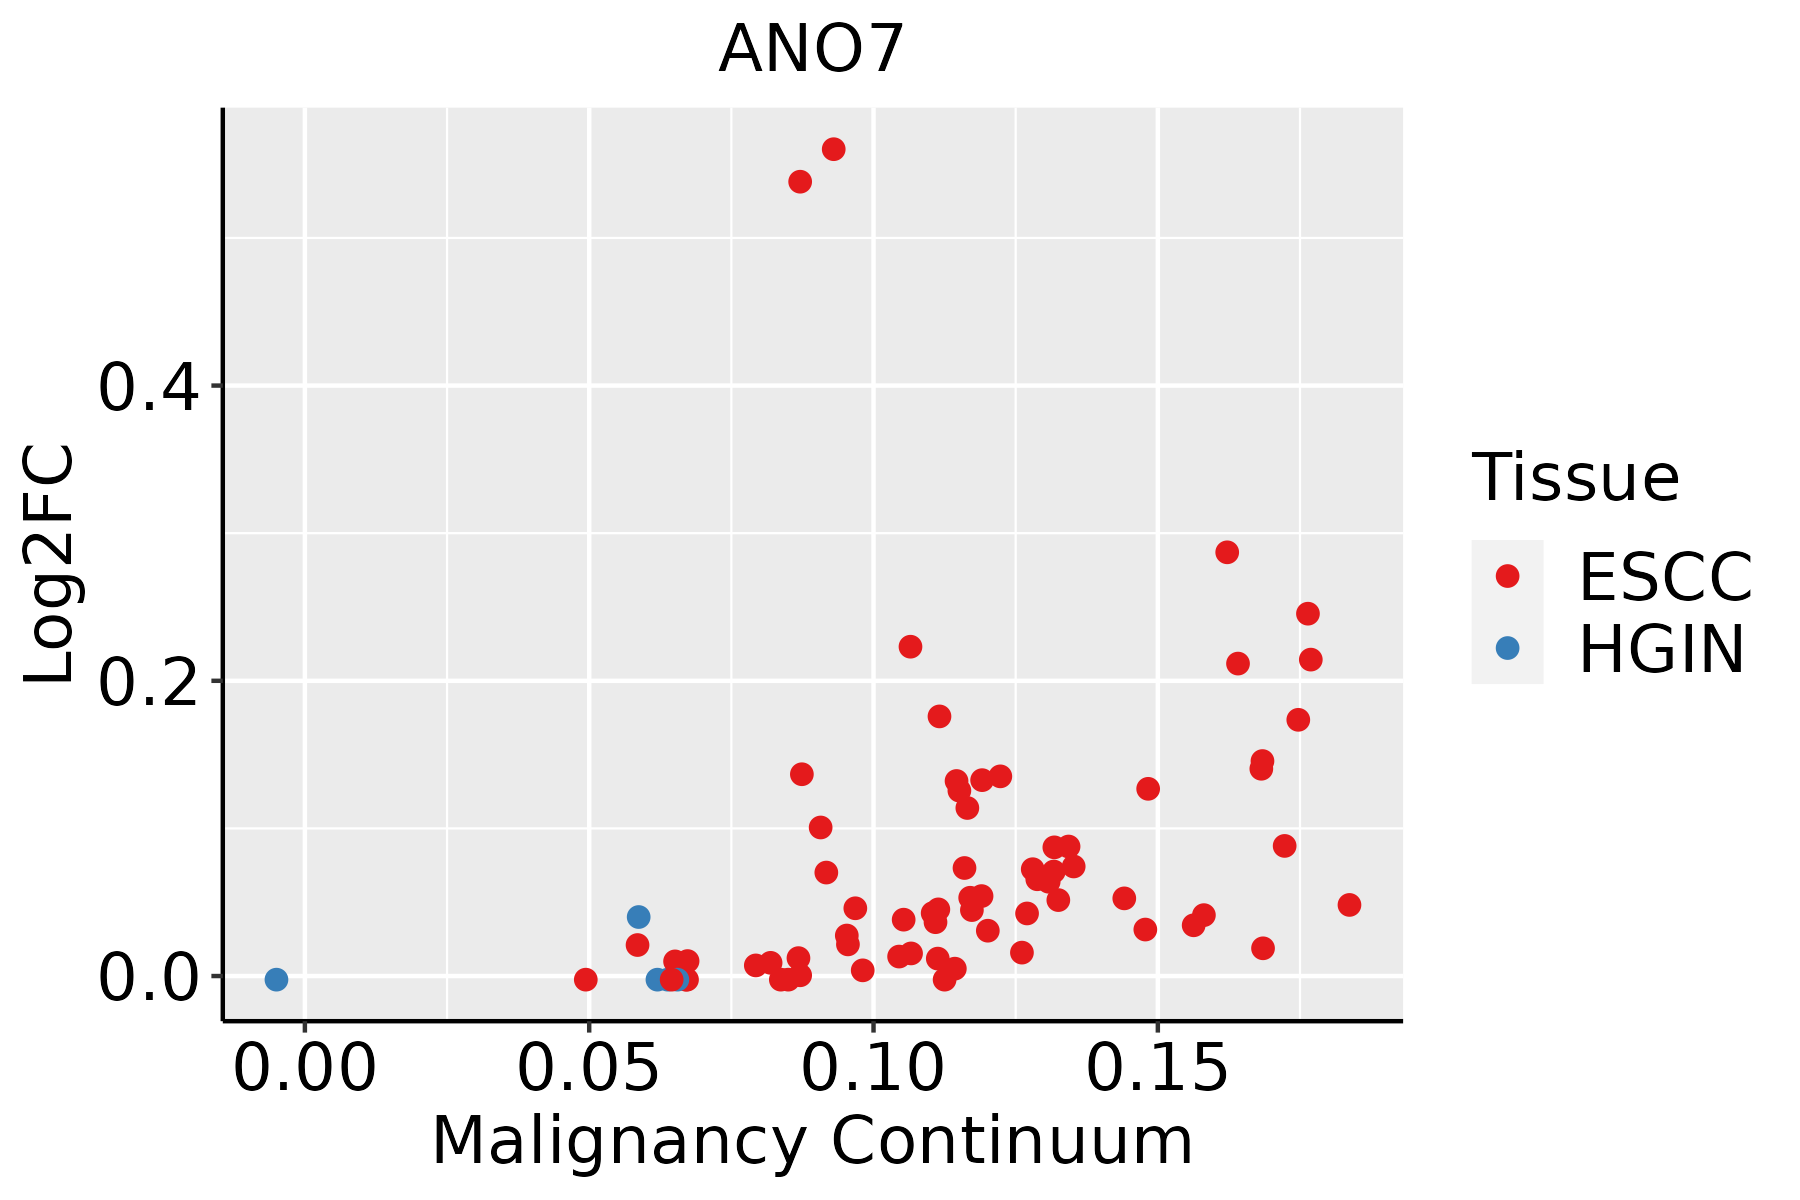 | ESCC: Esophageal squamous cell carcinoma |
| HGIN: High-grade intraepithelial neoplasias | ||
| LGIN: Low-grade intraepithelial neoplasias |
| ∗log2FC in expression of this searched gene in stem-like cells from each diseased tissue sample relative to stem-like cells in normal samples in each tissue plotted against the malignancy continuum. Samples are colored based on if they are from different disease stage. |
Top |
Malignant transformation related pathway analysis |
| Find out the enriched GO biological processes and KEGG pathways involved in transition from healthy to precancer to cancer |
| Tissue | Disease Stage | Enriched GO biological Processes |
| Colorectum | AD |  |
| Colorectum | SER |  |
| Colorectum | MSS |  |
| Colorectum | MSI-H |  |
| Colorectum | FAP |  |
| ∗Top 15 enriched GO BP terms are showed in the bar plot of each disease state in each tissue. Each row represents a significant GO biological process which is colored according to the -log10(p.adjust). |
| Page: 1 2 3 4 5 6 7 8 9 |
| GO ID | Tissue | Disease Stage | Description | Gene Ratio | Bg Ratio | pvalue | p.adjust | Count |
| GO:0010876 | Colorectum | AD | lipid localization | 120/3918 | 448/18723 | 1.59e-03 | 1.33e-02 | 120 |
| GO:0006869 | Colorectum | AD | lipid transport | 108/3918 | 398/18723 | 1.67e-03 | 1.39e-02 | 108 |
| GO:0015698 | Colorectum | AD | inorganic anion transport | 52/3918 | 180/18723 | 6.83e-03 | 4.22e-02 | 52 |
| GO:0015748 | Colorectum | AD | organophosphate ester transport | 42/3918 | 140/18723 | 7.04e-03 | 4.31e-02 | 42 |
| GO:0007009 | Colorectum | SER | plasma membrane organization | 36/2897 | 142/18723 | 1.50e-03 | 1.62e-02 | 36 |
| Page: 1 |
| Pathway ID | Tissue | Disease Stage | Description | Gene Ratio | Bg Ratio | pvalue | p.adjust | qvalue | Count |
| Page: 1 |
Top |
Cell-cell communication analysis |
| Identification of potential cell-cell interactions between two cell types and their ligand-receptor pairs for different disease states |
| Ligand | Receptor | LRpair | Pathway | Tissue | Disease Stage |
| Page: 1 |
Top |
Single-cell gene regulatory network inference analysis |
| Find out the significant the regulons (TFs) and the target genes of each regulon across cell types for different disease states |
| TF | Cell Type | Tissue | Disease Stage | Target Gene | RSS | Regulon Activity |
| ∗The dot plots of a searched regulon are shown for all cell subpopulations in each disease state of each tissue based on the regulon specific score inferred using pySCENIC and by calculating the average expression. |
| Page: 1 |
Top |
Somatic mutation of malignant transformation related genes |
| Annotation of somatic variants for genes involved in malignant transformation |
| Hugo Symbol | Variant Class | Variant Classification | dbSNP RS | HGVSc | HGVSp | HGVSp Short | SWISSPROT | BIOTYPE | SIFT | PolyPhen | Tumor Sample Barcode | Tissue | Histology | Sex | Age | Stage | Therapy Types | Drugs | Outcome |
| ANO7 | SNV | Missense_Mutation | c.800N>G | p.Pro267Arg | p.P267R | Q6IWH7 | protein_coding | tolerated(0.27) | benign(0.011) | TCGA-D8-A1JK-01 | Breast | breast invasive carcinoma | Female | >=65 | I/II | Unknown | Unknown | SD | |
| ANO7 | insertion | In_Frame_Ins | novel | c.521_522insTTA | p.Ala174_Ser175insTyr | p.A174_S175insY | Q6IWH7 | protein_coding | TCGA-BH-A0H7-01 | Breast | breast invasive carcinoma | Female | >=65 | III/IV | Chemotherapy | doxorubicin | SD | ||
| ANO7 | insertion | Frame_Shift_Ins | novel | c.522_523insCACGGCTACAGAAATGCCAGTCTTT | p.Ser175HisfsTer78 | p.S175Hfs*78 | Q6IWH7 | protein_coding | TCGA-BH-A0H7-01 | Breast | breast invasive carcinoma | Female | >=65 | III/IV | Chemotherapy | doxorubicin | SD | ||
| ANO7 | SNV | Missense_Mutation | rs543636867 | c.247N>A | p.Gly83Arg | p.G83R | Q6IWH7 | protein_coding | deleterious(0.03) | possibly_damaging(0.573) | TCGA-C5-A8YR-01 | Cervix | cervical & endocervical cancer | Female | <65 | I/II | Unknown | Unknown | PD |
| ANO7 | SNV | Missense_Mutation | c.611N>T | p.Ala204Val | p.A204V | Q6IWH7 | protein_coding | tolerated(0.22) | benign(0.255) | TCGA-EA-A410-01 | Cervix | cervical & endocervical cancer | Female | <65 | I/II | Unknown | Unknown | SD | |
| ANO7 | SNV | Missense_Mutation | c.1502C>T | p.Ser501Phe | p.S501F | Q6IWH7 | protein_coding | tolerated(0.67) | benign(0.018) | TCGA-EK-A3GK-01 | Cervix | cervical & endocervical cancer | Female | <65 | I/II | Unknown | Unknown | SD | |
| ANO7 | SNV | Missense_Mutation | rs375780942 | c.1483C>T | p.Arg495Cys | p.R495C | Q6IWH7 | protein_coding | tolerated(0.1) | possibly_damaging(0.809) | TCGA-HG-A2PA-01 | Cervix | cervical & endocervical cancer | Female | <65 | I/II | Unspecific | Taxol | PD |
| ANO7 | SNV | Missense_Mutation | c.1688N>A | p.Ile563Asn | p.I563N | Q6IWH7 | protein_coding | deleterious(0) | possibly_damaging(0.83) | TCGA-JX-A3Q8-01 | Cervix | cervical & endocervical cancer | Female | <65 | I/II | Unknown | Unknown | SD | |
| ANO7 | SNV | Missense_Mutation | rs373704127 | c.1247N>A | p.Arg416Gln | p.R416Q | Q6IWH7 | protein_coding | tolerated(0.24) | benign(0.15) | TCGA-Q1-A73S-01 | Cervix | cervical & endocervical cancer | Female | <65 | I/II | Chemotherapy | cisplatin | SD |
| ANO7 | SNV | Missense_Mutation | rs770239303 | c.2041N>A | p.Ala681Thr | p.A681T | Q6IWH7 | protein_coding | tolerated(0.54) | benign(0.037) | TCGA-VS-A94Z-01 | Cervix | cervical & endocervical cancer | Female | <65 | I/II | Chemotherapy | cisplatin | CR |
| Page: 1 2 3 4 5 6 7 8 9 10 11 |
Top |
Related drugs of malignant transformation related genes |
| Identification of chemicals and drugs interact with genes involved in malignant transfromation |
| (DGIdb 4.0) |
| Entrez ID | Symbol | Category | Interaction Types | Drug Claim Name | Drug Name | PMIDs |
| Page: 1 |

Copyright 2023-Present -The University of Texas Health Science Center at Houston |