Schematic overview of the cellular and molecular mechanisms involved in the cancer progression, including the proposed cellular and molecular mechanisms in cancer cells trajectory. AT1: alveolar type 1 cells; AT2: alveolar type 2 cells; AAH: atypical adenomatous hyperplasia; AIS: adenocarcinoma in situ; MIA: minimally invasive adenocarcinoma; IA: invasive adenocarcinoma; EMT: epithelial-mesenchymal transition

Home

Download

Statistics

Help

Contact

Center for Computational Systems Medicine
leaf

Gene summary

leaf

Malignant transformation analysis

leaf

Malignant transformation related pathway analysis

leaf

Cell-cell communication analysis

leaf

Single-cell gene regulatory network inference analysis

leaf

Somatic mutation of malignant transformation related genes

leaf

Related drugs of malignant transformation related genes

Gene: ANLN

Gene summary for ANLN

check button Gene summary.

Gene informationSpeciesHuman
Gene symbol

ANLN

Gene ID

54443

Gene nameanillin actin binding protein
Gene AliasFSGS8
Cytomap7p14.2
Gene Typeprotein-coding
GO ID

GO:0000278

UniProtAcc

Q9NQW6


Top

Malignant transformation analysis

check button Identification of the aberrant gene expression in precancerous and cancerous lesions by comparing the gene expression of stem-like cells in diseased tissues with normal stem cells
check button Malignant transformation involving gene list.
Entrez IDSymbolReplicatesSpeciesOrganTissueAdj P-valueLog2FCMalignancy
54443ANLNLZE2THumanEsophagusESCC9.54e-067.69e-010.082
54443ANLNLZE4THumanEsophagusESCC1.70e-032.71e-010.0811
54443ANLNLZE22THumanEsophagusESCC1.57e-033.80e-010.068
54443ANLNLZE21THumanEsophagusESCC1.37e-065.57e-010.0655
54443ANLNP2T-EHumanEsophagusESCC7.08e-134.74e-010.1177
54443ANLNP4T-EHumanEsophagusESCC4.13e-174.77e-010.1323
54443ANLNP5T-EHumanEsophagusESCC3.28e-287.00e-010.1327
54443ANLNP9T-EHumanEsophagusESCC3.05e-072.99e-010.1131
54443ANLNP10T-EHumanEsophagusESCC7.37e-104.07e-010.116
54443ANLNP11T-EHumanEsophagusESCC9.07e-043.53e-010.1426
54443ANLNP12T-EHumanEsophagusESCC2.20e-133.13e-010.1122
54443ANLNP15T-EHumanEsophagusESCC7.07e-103.17e-010.1149
54443ANLNP16T-EHumanEsophagusESCC2.04e-041.98e-010.1153
54443ANLNP17T-EHumanEsophagusESCC1.49e-055.38e-010.1278
54443ANLNP19T-EHumanEsophagusESCC6.53e-044.54e-010.1662
54443ANLNP20T-EHumanEsophagusESCC8.24e-041.56e-010.1124
54443ANLNP21T-EHumanEsophagusESCC1.29e-116.66e-010.1617
54443ANLNP22T-EHumanEsophagusESCC1.16e-053.34e-010.1236
54443ANLNP23T-EHumanEsophagusESCC1.83e-073.85e-010.108
54443ANLNP24T-EHumanEsophagusESCC4.09e-072.61e-010.1287
Page: 1 2 3 4 5 

check button Transcriptomic changes along malignancy continuum.
TissueExpression DynamicsAbbreviation
EsophagusThe image shows the transcriptomic changes along malignancy continuum.log2FC in expression of this searched gene in stem-like cells from each diseased tissue sample relative to stem-like cells in normal samples in each tissue plotted against the malignancy continuum. Samples are colored based on if they are from different disease stage.ESCC: Esophageal squamous cell carcinoma
HGIN: High-grade intraepithelial neoplasias
LGIN: Low-grade intraepithelial neoplasias
LiverThe image shows the transcriptomic changes along malignancy continuum.log2FC in expression of this searched gene in stem-like cells from each diseased tissue sample relative to stem-like cells in normal samples in each tissue plotted against the malignancy continuum. Samples are colored based on if they are from different disease stage.
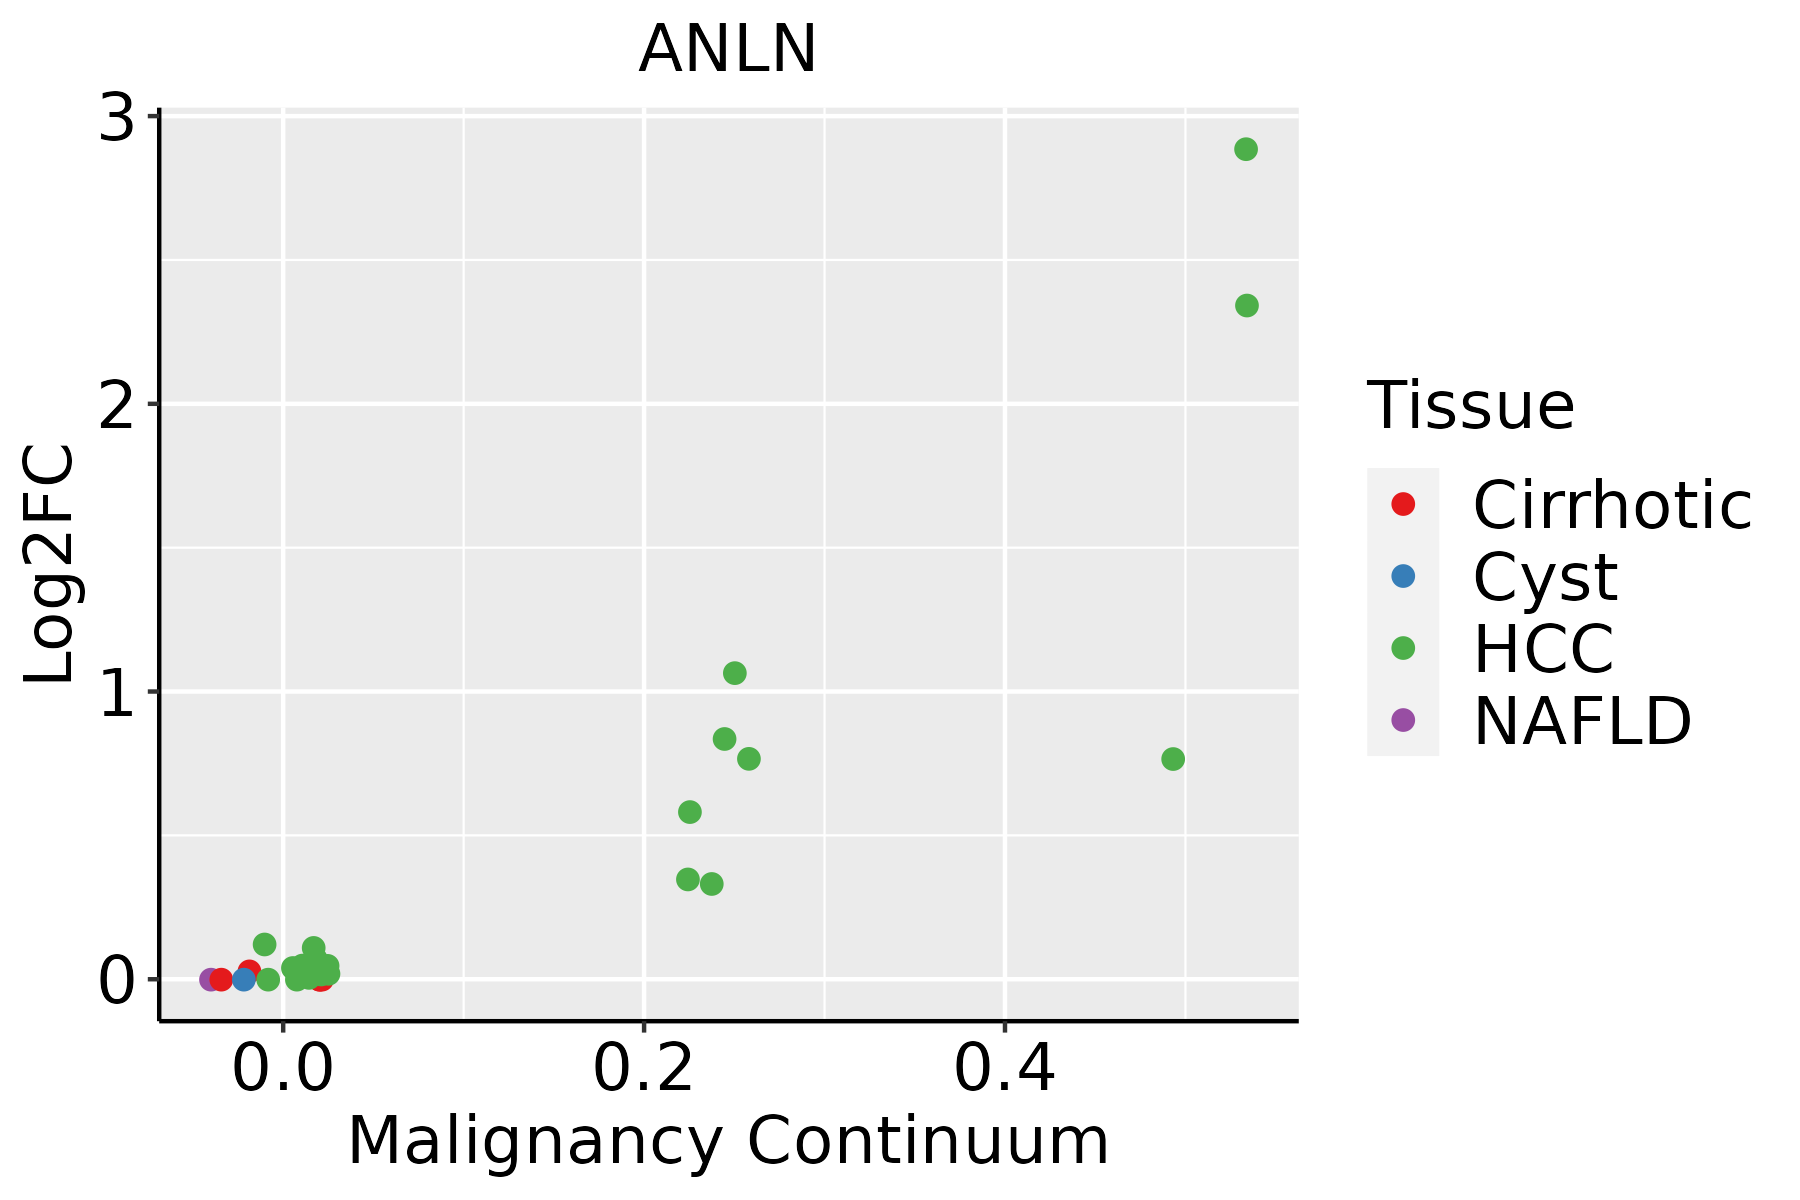
HCC: Hepatocellular carcinoma
NAFLD: Non-alcoholic fatty liver disease
Oral CavityThe image shows the transcriptomic changes along malignancy continuum.log2FC in expression of this searched gene in stem-like cells from each diseased tissue sample relative to stem-like cells in normal samples in each tissue plotted against the malignancy continuum. Samples are colored based on if they are from different disease stage.
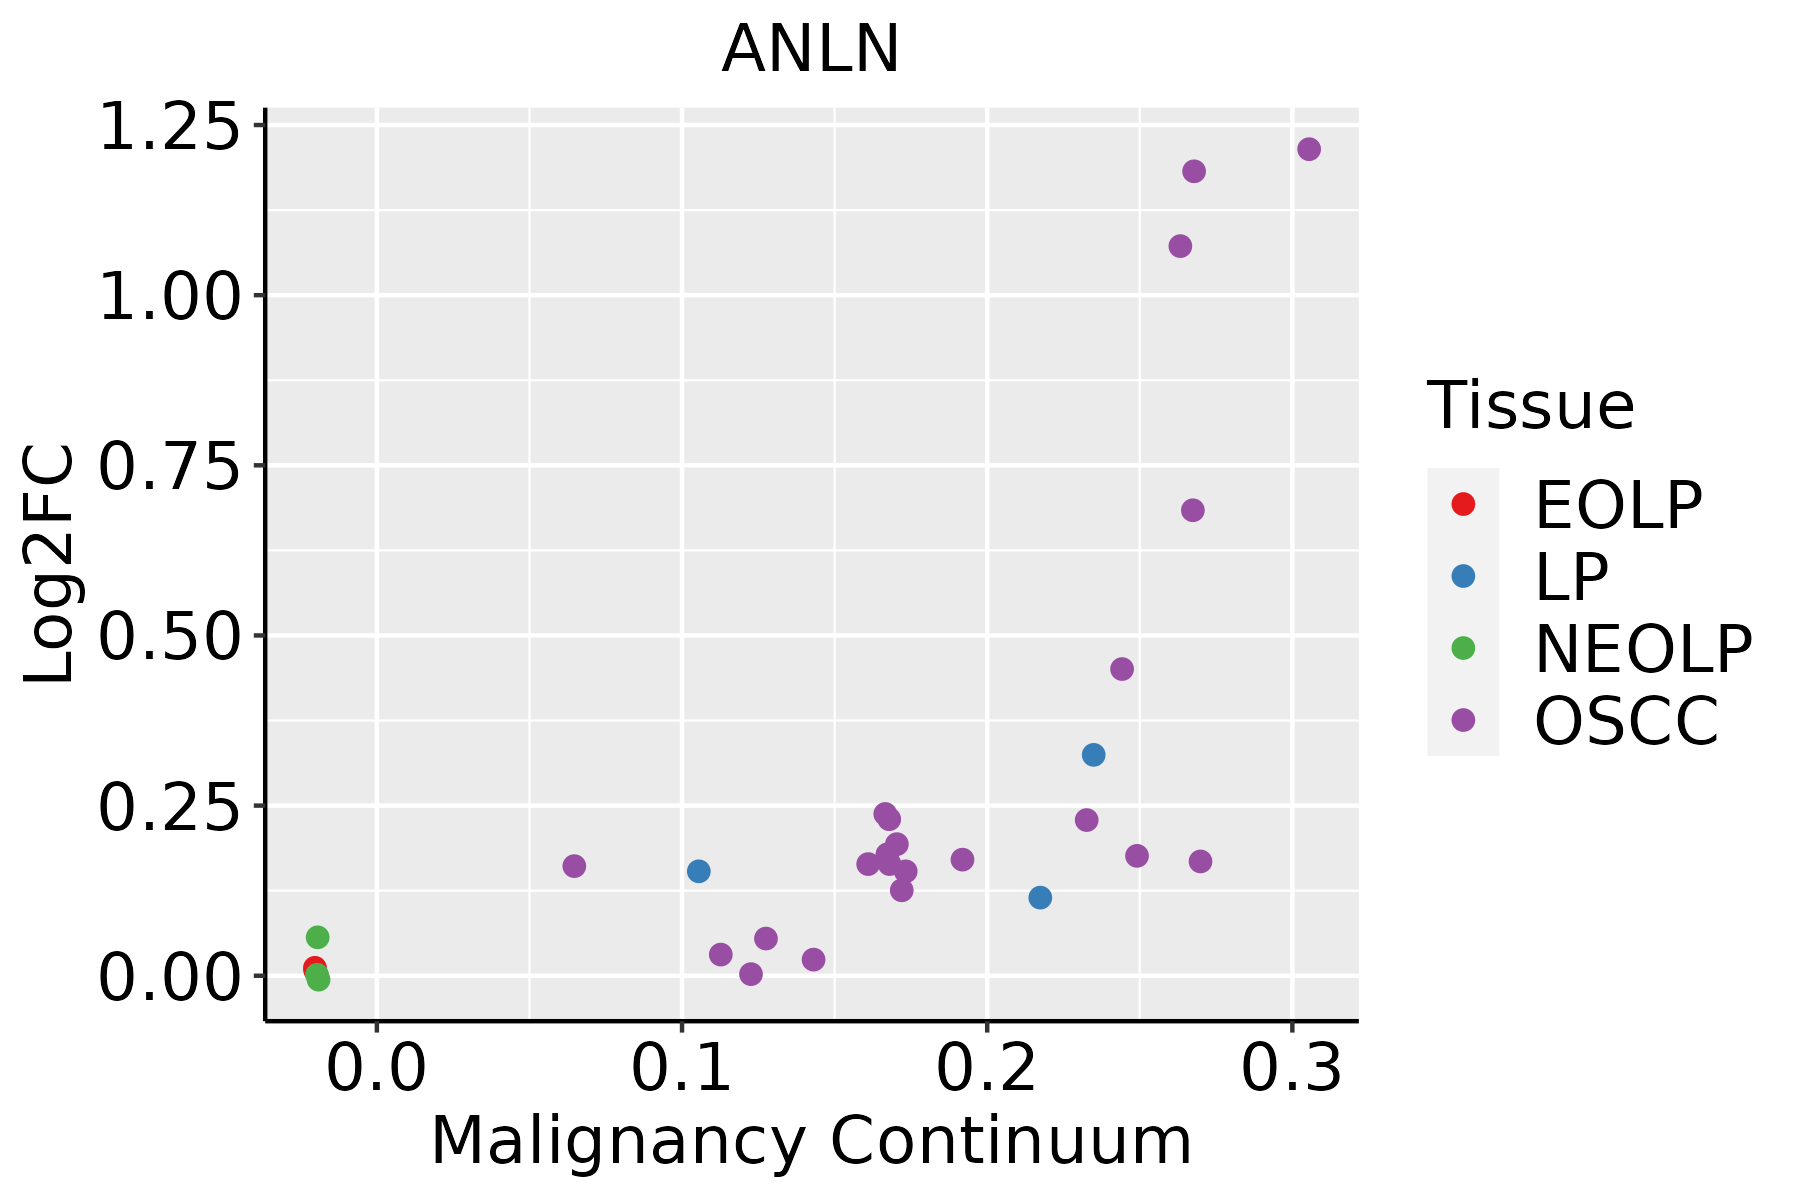
EOLP: Erosive Oral lichen planus
LP: leukoplakia
NEOLP: Non-erosive oral lichen planus
OSCC: Oral squamous cell carcinoma
SkinThe image shows the transcriptomic changes along malignancy continuum.log2FC in expression of this searched gene in stem-like cells from each diseased tissue sample relative to stem-like cells in normal samples in each tissue plotted against the malignancy continuum. Samples are colored based on if they are from different disease stage.
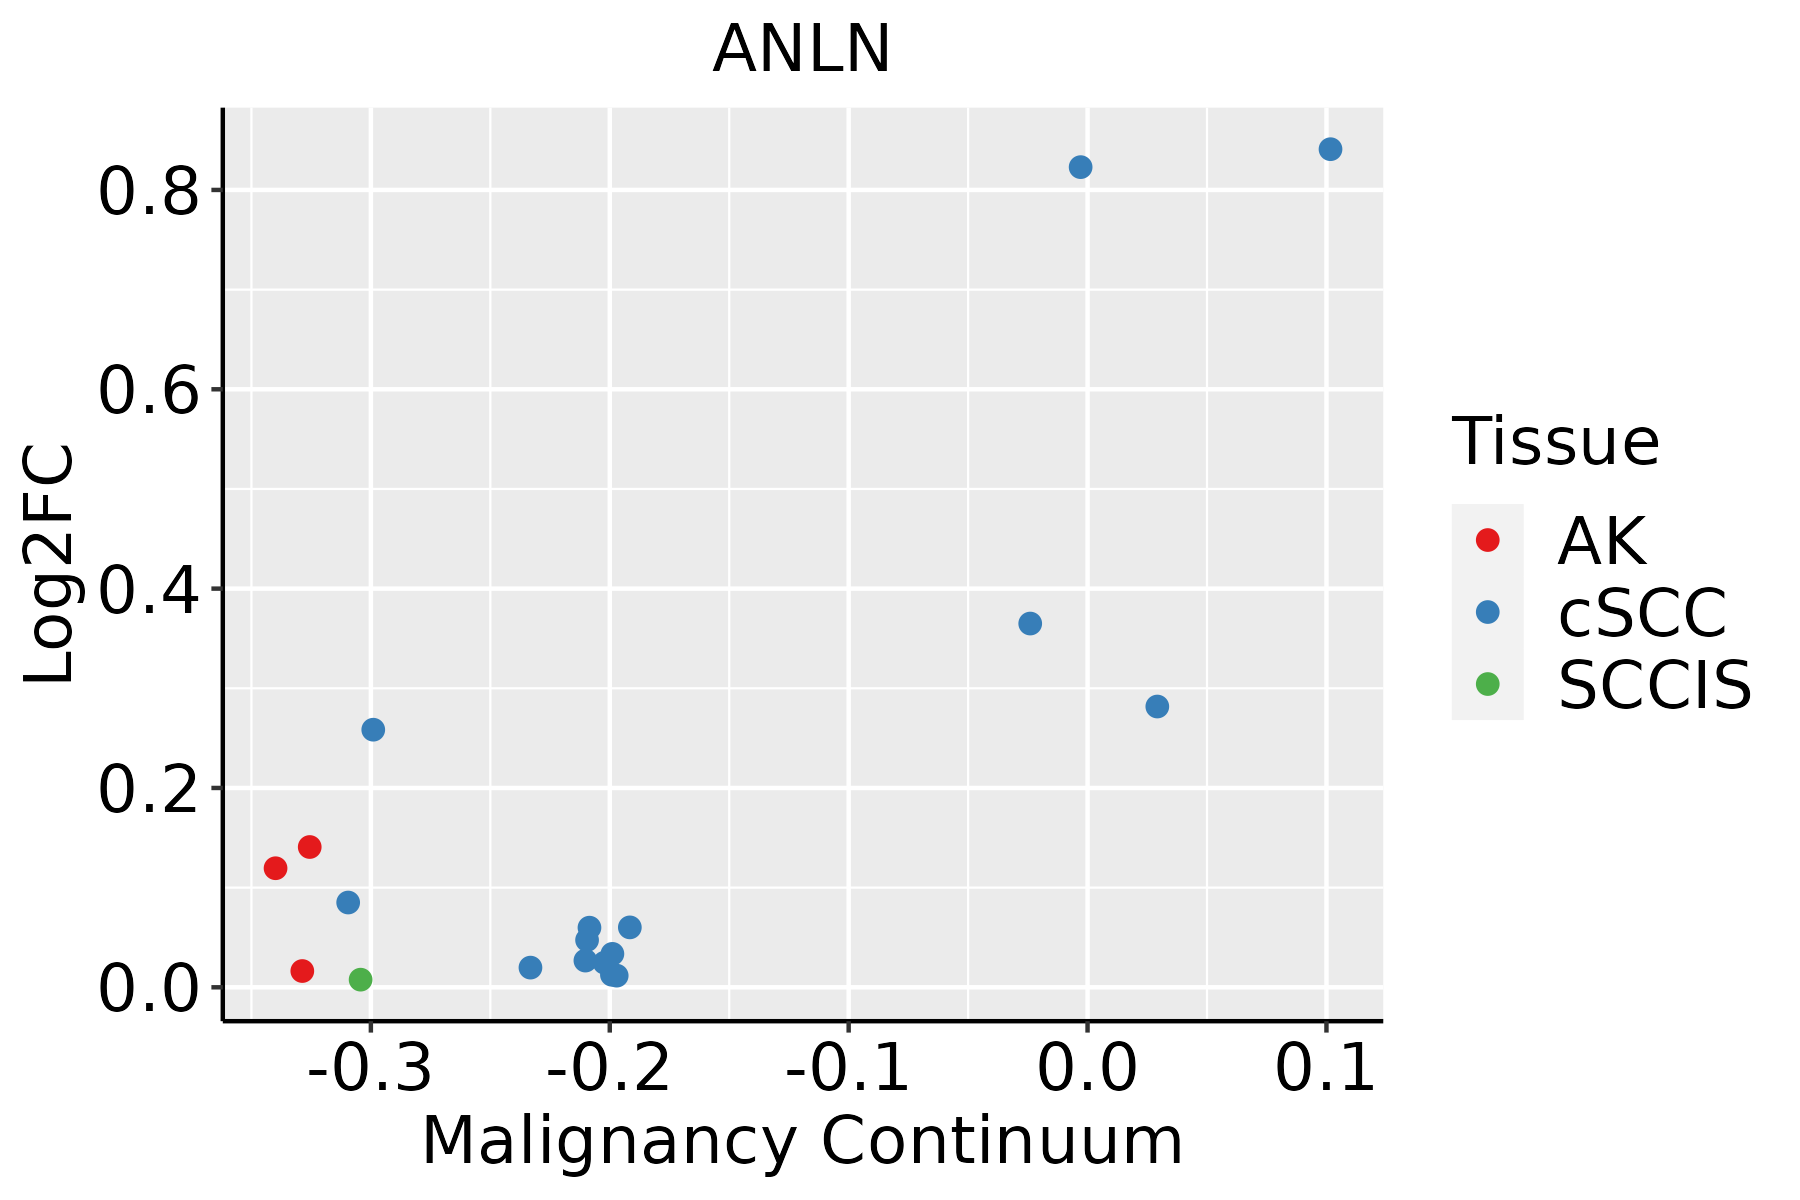
AK: Actinic keratosis
cSCC: Cutaneous squamous cell carcinoma
SCCIS:squamous cell carcinoma in situ
ThyroidThe image shows the transcriptomic changes along malignancy continuum.log2FC in expression of this searched gene in stem-like cells from each diseased tissue sample relative to stem-like cells in normal samples in each tissue plotted against the malignancy continuum. Samples are colored based on if they are from different disease stage.
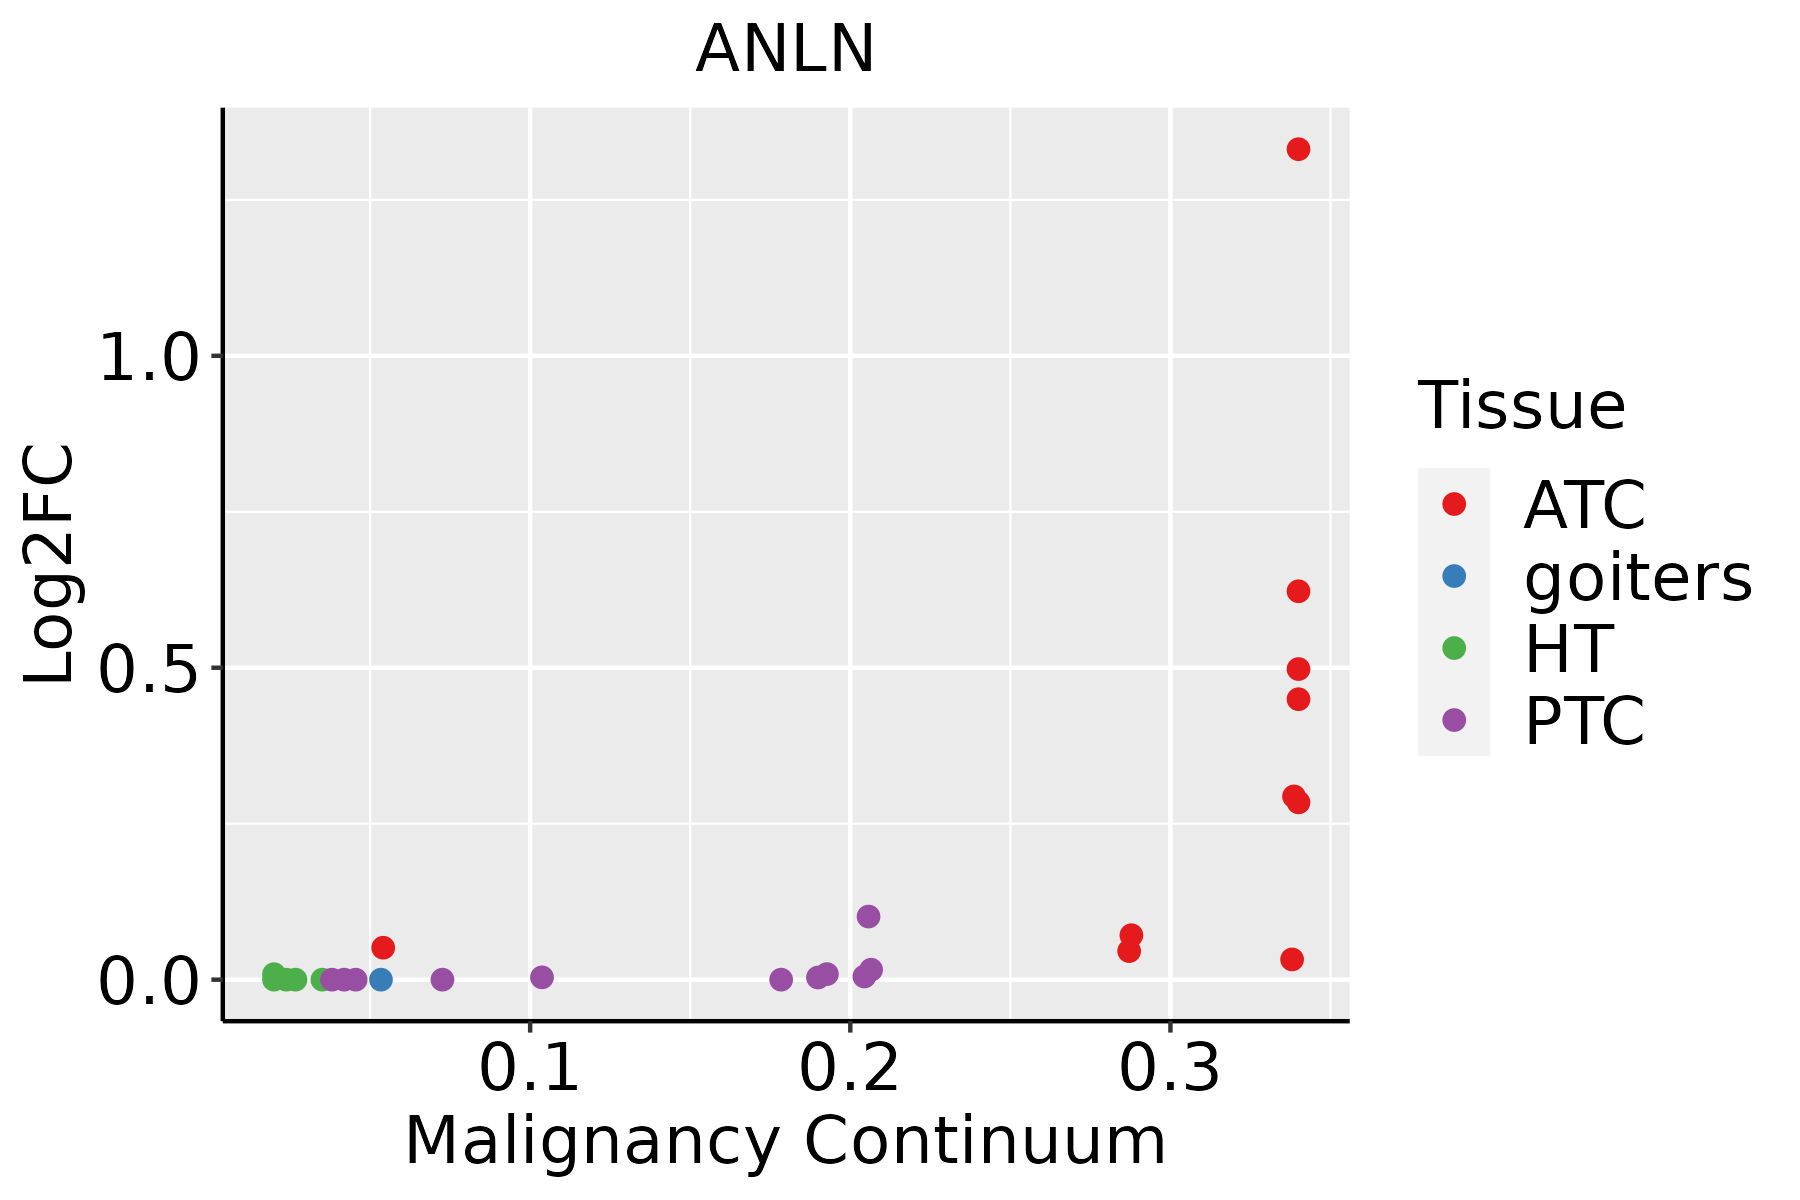
ATC: Anaplastic thyroid cancer
HT: Hashimoto's thyroiditis
PTC: Papillary thyroid cancer
∗log2FC in expression of this searched gene in stem-like cells from each diseased tissue sample relative to stem-like cells in normal samples in each tissue plotted against the malignancy continuum. Samples are colored based on if they are from different disease stage.

Top

Malignant transformation related pathway analysis

check buttonFind out the enriched GO biological processes and KEGG pathways involved in transition from healthy to precancer to cancer
check button Figure of enriched GO biological processes.
TissueDisease StageEnriched GO biological Processes
ColorectumADGO analysis - Figure of enriched GO biological processes: Top 15 enriched GO BP terms are showed in the bar plot of each disease state in each tissue. Each row represents a significant GO biological process which is colored according to the -log10(p.adjust).
ColorectumSERGO analysis - Figure of enriched GO biological processes: Top 15 enriched GO BP terms are showed in the bar plot of each disease state in each tissue. Each row represents a significant GO biological process which is colored according to the -log10(p.adjust).
ColorectumMSSGO analysis - Figure of enriched GO biological processes: Top 15 enriched GO BP terms are showed in the bar plot of each disease state in each tissue. Each row represents a significant GO biological process which is colored according to the -log10(p.adjust).
ColorectumMSI-HGO analysis - Figure of enriched GO biological processes: Top 15 enriched GO BP terms are showed in the bar plot of each disease state in each tissue. Each row represents a significant GO biological process which is colored according to the -log10(p.adjust).
ColorectumFAPGO analysis - Figure of enriched GO biological processes: Top 15 enriched GO BP terms are showed in the bar plot of each disease state in each tissue. Each row represents a significant GO biological process which is colored according to the -log10(p.adjust).
∗Top 15 enriched GO BP terms are showed in the bar plot of each disease state in each tissue. Each row represents a significant GO biological process which is colored according to the -log10(p.adjust).
Page: 1 2 3 4 5 6 7 8 9 

check button Enriched GO biological processes.
GO IDTissueDisease StageDescriptionGene RatioBg Ratiopvaluep.adjustCount
GO:014001414EsophagusESCCmitotic nuclear division218/8552287/187236.17e-261.78e-23218
GO:004477216EsophagusESCCmitotic cell cycle phase transition281/8552424/187234.63e-184.45e-16281
GO:000734615EsophagusESCCregulation of mitotic cell cycle293/8552457/187238.00e-165.64e-14293
GO:00482853EsophagusESCCorganelle fission301/8552488/187234.64e-132.12e-11301
GO:00002802EsophagusESCCnuclear division270/8552439/187231.17e-114.24e-10270
GO:190198713EsophagusESCCregulation of cell cycle phase transition242/8552390/187233.86e-111.26e-09242
GO:190199013EsophagusESCCregulation of mitotic cell cycle phase transition191/8552299/187231.35e-103.94e-09191
GO:000028115EsophagusESCCmitotic cytokinesis58/855271/187234.34e-101.15e-0858
GO:003250614EsophagusESCCcytokinetic process35/855239/187239.38e-091.90e-0735
GO:000091016EsophagusESCCcytokinesis115/8552173/187232.48e-084.68e-07115
GO:006164015EsophagusESCCcytoskeleton-dependent cytokinesis72/8552100/187238.10e-081.39e-0672
GO:003134616EsophagusESCCpositive regulation of cell projection organization201/8552353/187231.19e-051.11e-04201
GO:003086517EsophagusESCCcortical cytoskeleton organization44/855261/187232.50e-052.13e-0444
GO:006049118EsophagusESCCregulation of cell projection assembly110/8552188/187232.60e-041.58e-03110
GO:012003218EsophagusESCCregulation of plasma membrane bounded cell projection assembly108/8552186/187234.37e-042.46e-03108
GO:01200347EsophagusESCCpositive regulation of plasma membrane bounded cell projection assembly64/8552105/187231.15e-035.70e-0364
GO:000166720EsophagusESCCameboidal-type cell migration250/8552475/187231.22e-035.97e-03250
GO:003086610EsophagusESCCcortical actin cytoskeleton organization28/855240/187231.61e-037.50e-0328
GO:003103219EsophagusESCCactomyosin structure organization108/8552196/187234.86e-031.88e-02108
GO:001063120EsophagusESCCepithelial cell migration187/8552357/187236.05e-032.23e-02187
Page: 1 2 3 4 5 6 

check button Enriched KEGG pathways.
Pathway IDTissueDisease StageDescriptionGene RatioBg Ratiopvaluep.adjustqvalueCount
Page: 1 

Top

Cell-cell communication analysis

check buttonIdentification of potential cell-cell interactions between two cell types and their ligand-receptor pairs for different disease states
LigandReceptorLRpairPathwayTissueDisease Stage
Page: 1 

Top

Single-cell gene regulatory network inference analysis

check buttonFind out the significant the regulons (TFs) and the target genes of each regulon across cell types for different disease states
TFCell TypeTissueDisease StageTarget GeneRSSRegulon Activity
∗The dot plots of a searched regulon are shown for all cell subpopulations in each disease state of each tissue based on the regulon specific score inferred using pySCENIC and by calculating the average expression.
Page: 1 

Top

Somatic mutation of malignant transformation related genes

check buttonAnnotation of somatic variants for genes involved in malignant transformation
Hugo SymbolVariant ClassVariant ClassificationdbSNP RSHGVScHGVSpHGVSp ShortSWISSPROTBIOTYPESIFTPolyPhenTumor Sample BarcodeTissueHistologySexAgeStageTherapy TypesDrugsOutcome
ANLNSNVMissense_Mutationc.461G>Cp.Arg154Prop.R154PQ9NQW6protein_codingdeleterious(0)probably_damaging(0.949)TCGA-A7-A0CE-01Breastbreast invasive carcinomaFemale<65I/IIChemotherapyadriamycinSD
ANLNSNVMissense_Mutationc.2752A>Tp.Ser918Cysp.S918CQ9NQW6protein_codingdeleterious(0.01)probably_damaging(0.986)TCGA-A8-A08L-01Breastbreast invasive carcinomaFemale>=65III/IVUnknownUnknownSD
ANLNSNVMissense_Mutationnovelc.1971N>Tp.Glu657Aspp.E657DQ9NQW6protein_codingtolerated(0.15)benign(0.078)TCGA-AR-A0TU-01Breastbreast invasive carcinomaFemale<65I/IIUnspecificDoxorubicinSD
ANLNSNVMissense_Mutationnovelc.1971N>Tp.Glu657Aspp.E657DQ9NQW6protein_codingtolerated(0.15)benign(0.078)TCGA-AR-A0U0-01Breastbreast invasive carcinomaFemale>=65I/IIUnknownUnknownSD
ANLNSNVMissense_Mutationrs756975220c.932N>Ap.Gly311Glup.G311EQ9NQW6protein_codingtolerated(1)benign(0.03)TCGA-AR-A5QN-01Breastbreast invasive carcinomaFemale>=65III/IVChemotherapytaxotereSD
ANLNSNVMissense_Mutationnovelc.2761N>Tp.His921Tyrp.H921YQ9NQW6protein_codingtolerated(0.71)benign(0)TCGA-BH-A0B6-01Breastbreast invasive carcinomaFemale<65I/IIUnknownUnknownSD
ANLNSNVMissense_Mutationnovelc.886N>Tp.Pro296Serp.P296SQ9NQW6protein_codingtolerated(0.1)benign(0.424)TCGA-LL-A5YN-01Breastbreast invasive carcinomaFemale<65I/IIChemotherapycarboplatinSD
ANLNinsertionFrame_Shift_Insnovelc.1055_1056insCTCTCCAAATGAAGTAACTATGCAGAAAAACATTTGGp.Cys353SerfsTer19p.C353Sfs*19Q9NQW6protein_codingTCGA-A8-A09C-01Breastbreast invasive carcinomaFemale>=65I/IIUnknownUnknownSD
ANLNinsertionFrame_Shift_Insnovelc.1969_1970insCAGTTp.Glu657AlafsTer35p.E657Afs*35Q9NQW6protein_codingTCGA-AR-A0TU-01Breastbreast invasive carcinomaFemale<65I/IIUnspecificDoxorubicinSD
ANLNinsertionFrame_Shift_Insnovelc.1969_1970insCAGTTp.Glu657AlafsTer35p.E657Afs*35Q9NQW6protein_codingTCGA-AR-A0U0-01Breastbreast invasive carcinomaFemale>=65I/IIUnknownUnknownSD
Page: 1 2 3 4 5 6 7 8 9 10 11 12 

Top

Related drugs of malignant transformation related genes

check buttonIdentification of chemicals and drugs interact with genes involved in malignant transfromation
(DGIdb 4.0)
Entrez IDSymbolCategoryInteraction TypesDrug Claim NameDrug NamePMIDs
Page: 1