
|
|||||
|
 | |
| |
| |
| |
| |
| |
|
Gene: ANKZF1 |
Gene summary for ANKZF1 |
| Gene information | Species | Human | Gene symbol | ANKZF1 | Gene ID | 55139 |
| Gene name | ankyrin repeat and zinc finger peptidyl tRNA hydrolase 1 | |
| Gene Alias | Vms1 | |
| Cytomap | 2q35 | |
| Gene Type | protein-coding | GO ID | GO:0000302 | UniProtAcc | A0A024R464 |
Top |
Malignant transformation analysis |
| Identification of the aberrant gene expression in precancerous and cancerous lesions by comparing the gene expression of stem-like cells in diseased tissues with normal stem cells |
| Entrez ID | Symbol | Replicates | Species | Organ | Tissue | Adj P-value | Log2FC | Malignancy |
| 55139 | ANKZF1 | LZE4T | Human | Esophagus | ESCC | 1.56e-10 | 1.97e-01 | 0.0811 |
| 55139 | ANKZF1 | LZE7T | Human | Esophagus | ESCC | 6.67e-04 | 1.77e-01 | 0.0667 |
| 55139 | ANKZF1 | LZE8T | Human | Esophagus | ESCC | 4.59e-03 | 1.46e-01 | 0.067 |
| 55139 | ANKZF1 | LZE20T | Human | Esophagus | ESCC | 2.93e-02 | 1.54e-01 | 0.0662 |
| 55139 | ANKZF1 | LZE22D1 | Human | Esophagus | HGIN | 1.49e-04 | 2.02e-01 | 0.0595 |
| 55139 | ANKZF1 | LZE24T | Human | Esophagus | ESCC | 4.17e-09 | 2.50e-01 | 0.0596 |
| 55139 | ANKZF1 | LZE6T | Human | Esophagus | ESCC | 2.87e-03 | 1.18e-01 | 0.0845 |
| 55139 | ANKZF1 | P1T-E | Human | Esophagus | ESCC | 3.61e-05 | 1.68e-01 | 0.0875 |
| 55139 | ANKZF1 | P2T-E | Human | Esophagus | ESCC | 3.58e-12 | 2.12e-01 | 0.1177 |
| 55139 | ANKZF1 | P4T-E | Human | Esophagus | ESCC | 2.77e-13 | 1.29e-01 | 0.1323 |
| 55139 | ANKZF1 | P5T-E | Human | Esophagus | ESCC | 5.96e-11 | 2.01e-01 | 0.1327 |
| 55139 | ANKZF1 | P8T-E | Human | Esophagus | ESCC | 1.53e-04 | 1.10e-01 | 0.0889 |
| 55139 | ANKZF1 | P9T-E | Human | Esophagus | ESCC | 6.57e-08 | 1.08e-01 | 0.1131 |
| 55139 | ANKZF1 | P10T-E | Human | Esophagus | ESCC | 1.55e-16 | 3.45e-01 | 0.116 |
| 55139 | ANKZF1 | P11T-E | Human | Esophagus | ESCC | 7.25e-05 | 2.81e-01 | 0.1426 |
| 55139 | ANKZF1 | P12T-E | Human | Esophagus | ESCC | 7.03e-19 | 2.92e-01 | 0.1122 |
| 55139 | ANKZF1 | P15T-E | Human | Esophagus | ESCC | 4.29e-23 | 5.46e-01 | 0.1149 |
| 55139 | ANKZF1 | P16T-E | Human | Esophagus | ESCC | 2.93e-09 | 3.12e-01 | 0.1153 |
| 55139 | ANKZF1 | P20T-E | Human | Esophagus | ESCC | 1.24e-12 | 2.82e-01 | 0.1124 |
| 55139 | ANKZF1 | P21T-E | Human | Esophagus | ESCC | 1.20e-15 | 3.17e-01 | 0.1617 |
| Page: 1 2 3 4 5 |
| Tissue | Expression Dynamics | Abbreviation |
| Esophagus | 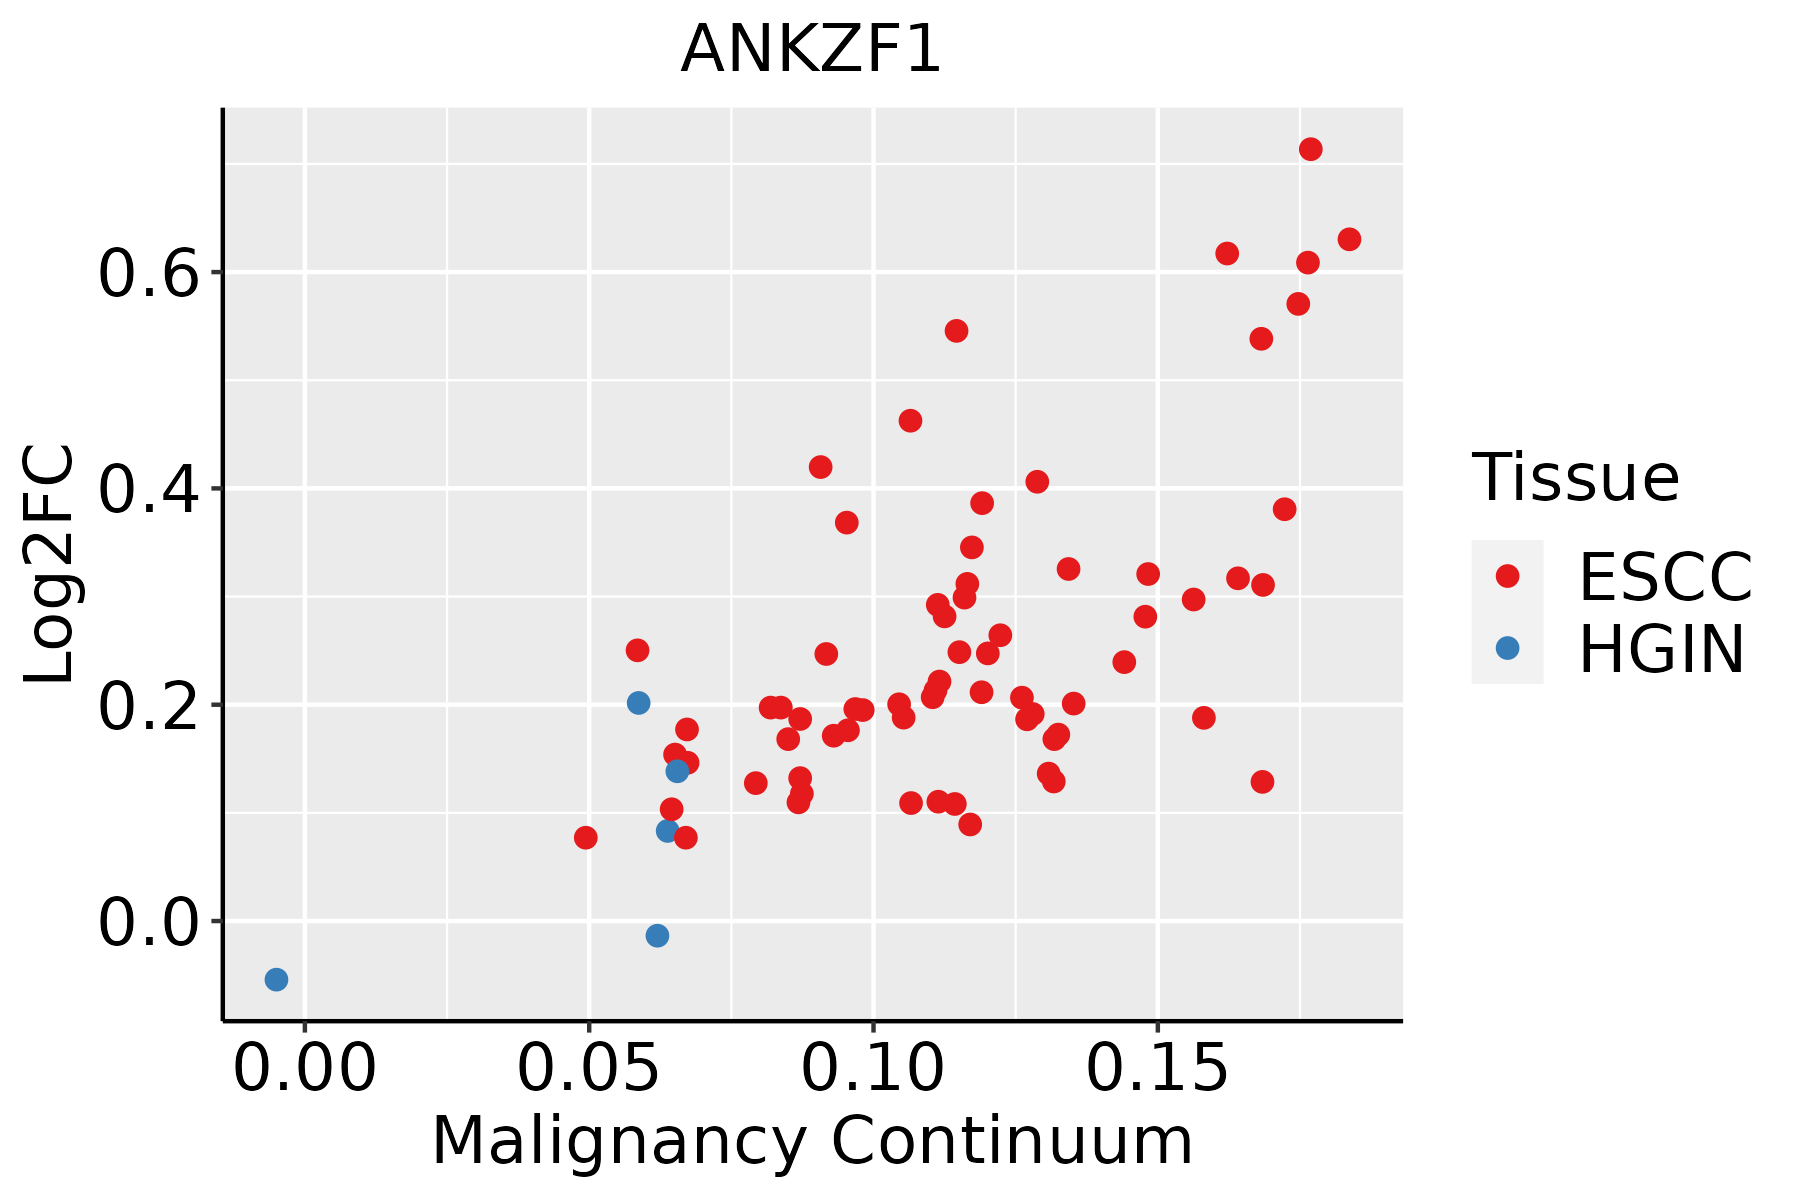 | ESCC: Esophageal squamous cell carcinoma |
| HGIN: High-grade intraepithelial neoplasias | ||
| LGIN: Low-grade intraepithelial neoplasias | ||
| Liver | 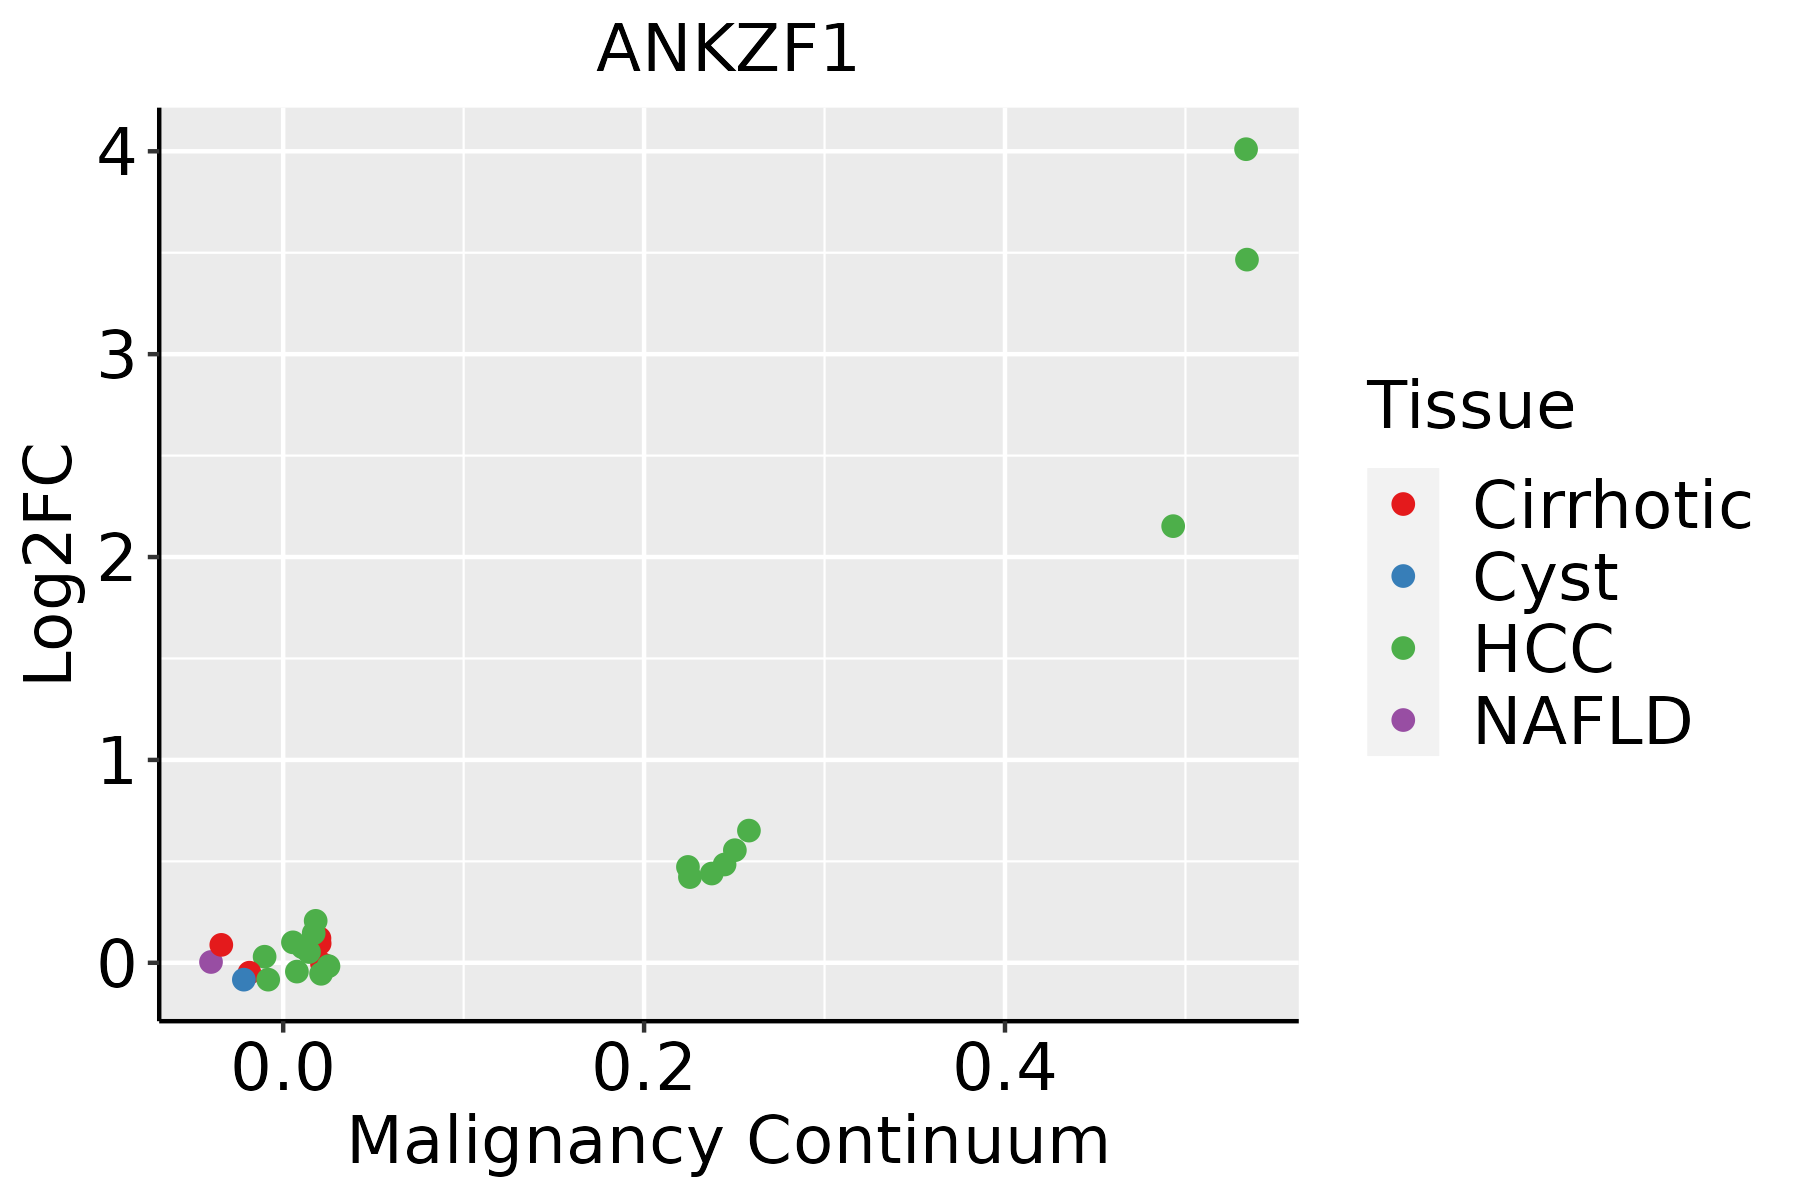 | HCC: Hepatocellular carcinoma |
| NAFLD: Non-alcoholic fatty liver disease | ||
| Thyroid | 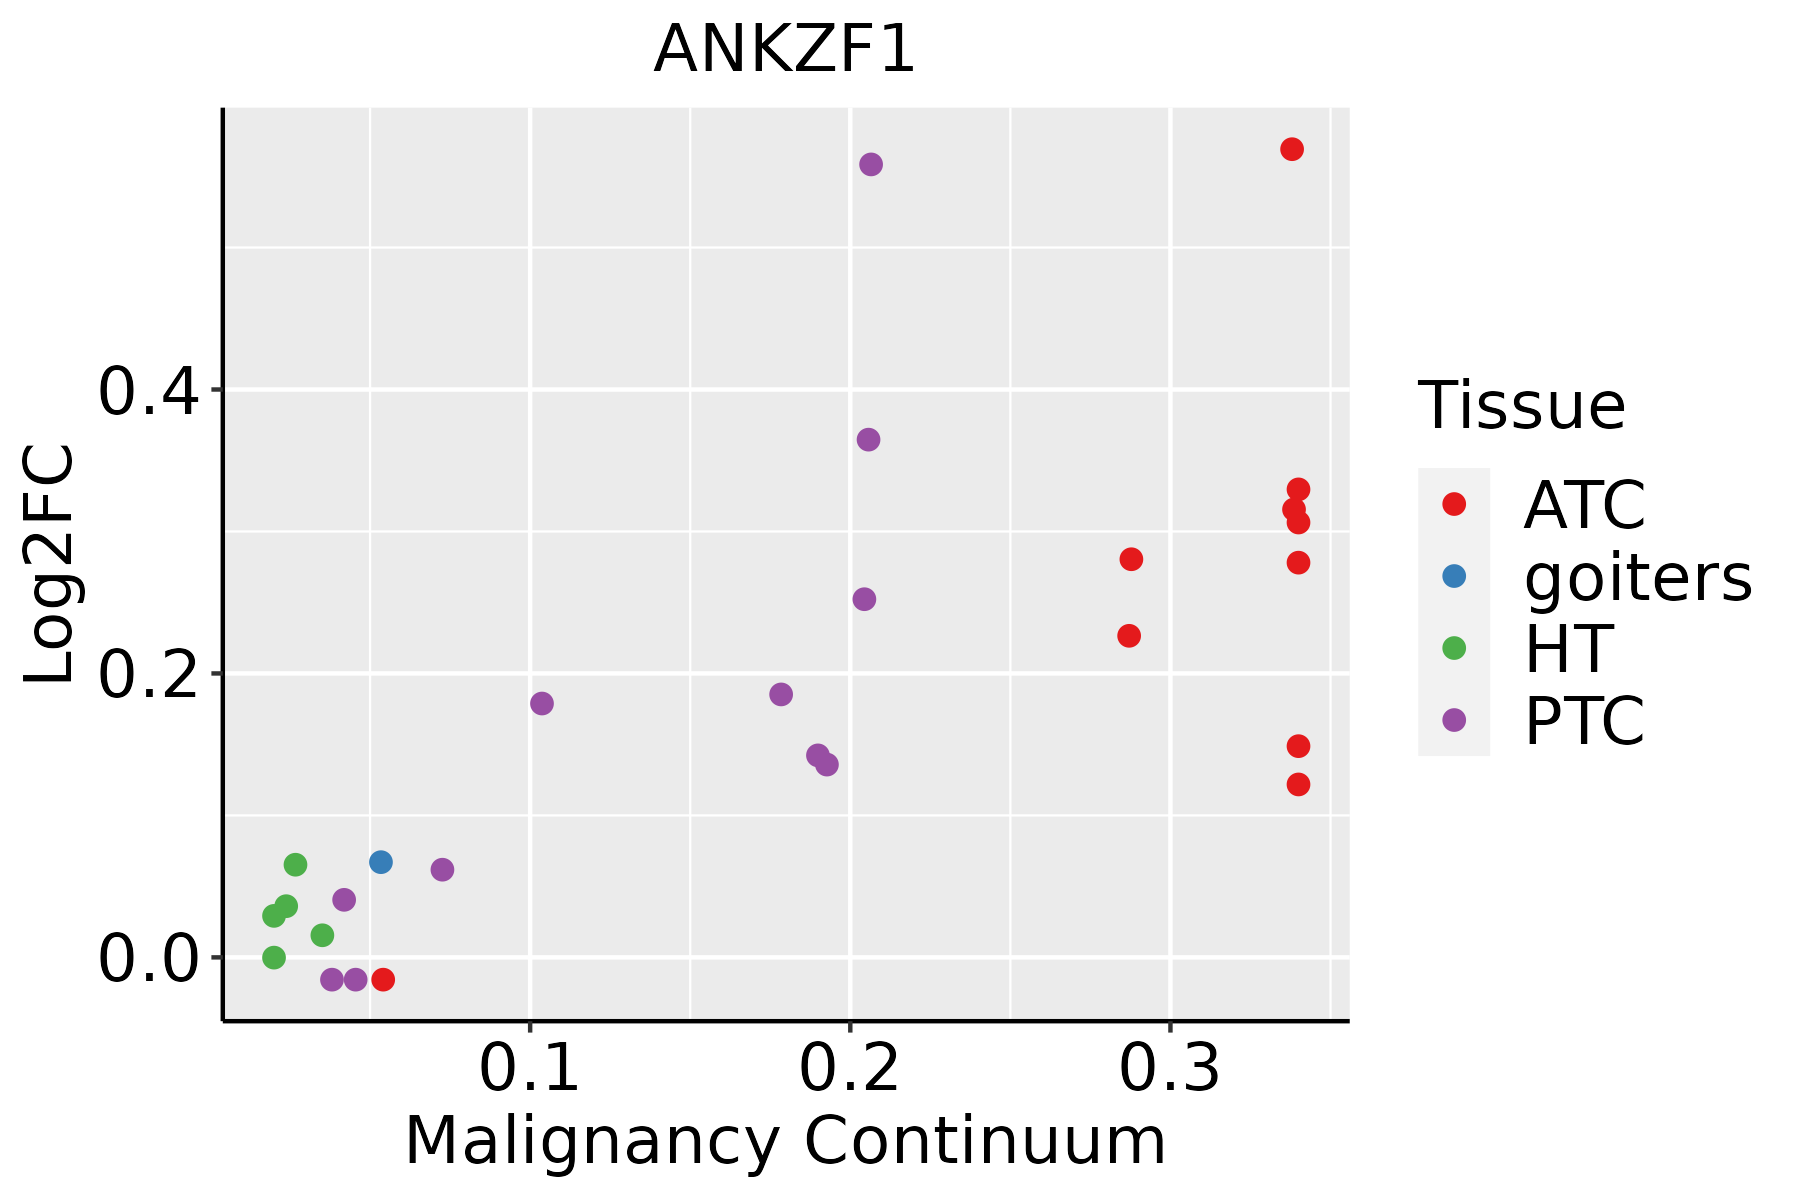 | ATC: Anaplastic thyroid cancer |
| HT: Hashimoto's thyroiditis | ||
| PTC: Papillary thyroid cancer |
| ∗log2FC in expression of this searched gene in stem-like cells from each diseased tissue sample relative to stem-like cells in normal samples in each tissue plotted against the malignancy continuum. Samples are colored based on if they are from different disease stage. |
Top |
Malignant transformation related pathway analysis |
| Find out the enriched GO biological processes and KEGG pathways involved in transition from healthy to precancer to cancer |
| Tissue | Disease Stage | Enriched GO biological Processes |
| Colorectum | AD |  |
| Colorectum | SER |  |
| Colorectum | MSS |  |
| Colorectum | MSI-H |  |
| Colorectum | FAP |  |
| ∗Top 15 enriched GO BP terms are showed in the bar plot of each disease state in each tissue. Each row represents a significant GO biological process which is colored according to the -log10(p.adjust). |
| Page: 1 2 3 4 5 6 7 8 9 |
| GO ID | Tissue | Disease Stage | Description | Gene Ratio | Bg Ratio | pvalue | p.adjust | Count |
| GO:001049826 | Esophagus | HGIN | proteasomal protein catabolic process | 139/2587 | 490/18723 | 1.20e-17 | 3.41e-15 | 139 |
| GO:004316126 | Esophagus | HGIN | proteasome-mediated ubiquitin-dependent protein catabolic process | 114/2587 | 412/18723 | 7.00e-14 | 1.20e-11 | 114 |
| GO:003497625 | Esophagus | HGIN | response to endoplasmic reticulum stress | 81/2587 | 256/18723 | 1.47e-13 | 2.32e-11 | 81 |
| GO:000697927 | Esophagus | HGIN | response to oxidative stress | 107/2587 | 446/18723 | 3.91e-09 | 2.76e-07 | 107 |
| GO:006219727 | Esophagus | HGIN | cellular response to chemical stress | 76/2587 | 337/18723 | 8.00e-06 | 2.41e-04 | 76 |
| GO:003459926 | Esophagus | HGIN | cellular response to oxidative stress | 65/2587 | 288/18723 | 3.42e-05 | 8.66e-04 | 65 |
| GO:000030226 | Esophagus | HGIN | response to reactive oxygen species | 52/2587 | 222/18723 | 7.30e-05 | 1.66e-03 | 52 |
| GO:004254220 | Esophagus | HGIN | response to hydrogen peroxide | 35/2587 | 146/18723 | 6.58e-04 | 9.01e-03 | 35 |
| GO:00365036 | Esophagus | HGIN | ERAD pathway | 27/2587 | 107/18723 | 1.15e-03 | 1.39e-02 | 27 |
| GO:00304335 | Esophagus | HGIN | ubiquitin-dependent ERAD pathway | 22/2587 | 85/18723 | 2.24e-03 | 2.31e-02 | 22 |
| GO:0010498111 | Esophagus | ESCC | proteasomal protein catabolic process | 369/8552 | 490/18723 | 1.13e-41 | 1.80e-38 | 369 |
| GO:0043161111 | Esophagus | ESCC | proteasome-mediated ubiquitin-dependent protein catabolic process | 312/8552 | 412/18723 | 3.53e-36 | 4.48e-33 | 312 |
| GO:0034976111 | Esophagus | ESCC | response to endoplasmic reticulum stress | 192/8552 | 256/18723 | 7.15e-22 | 1.30e-19 | 192 |
| GO:0006979111 | Esophagus | ESCC | response to oxidative stress | 303/8552 | 446/18723 | 7.15e-22 | 1.30e-19 | 303 |
| GO:0062197111 | Esophagus | ESCC | cellular response to chemical stress | 234/8552 | 337/18723 | 5.37e-19 | 5.97e-17 | 234 |
| GO:0034599111 | Esophagus | ESCC | cellular response to oxidative stress | 197/8552 | 288/18723 | 3.76e-15 | 2.15e-13 | 197 |
| GO:0000302111 | Esophagus | ESCC | response to reactive oxygen species | 150/8552 | 222/18723 | 3.06e-11 | 1.02e-09 | 150 |
| GO:003650315 | Esophagus | ESCC | ERAD pathway | 82/8552 | 107/18723 | 5.80e-11 | 1.84e-09 | 82 |
| GO:003043314 | Esophagus | ESCC | ubiquitin-dependent ERAD pathway | 66/8552 | 85/18723 | 1.64e-09 | 3.78e-08 | 66 |
| GO:0042542111 | Esophagus | ESCC | response to hydrogen peroxide | 102/8552 | 146/18723 | 2.64e-09 | 5.81e-08 | 102 |
| Page: 1 2 3 |
| Pathway ID | Tissue | Disease Stage | Description | Gene Ratio | Bg Ratio | pvalue | p.adjust | qvalue | Count |
| Page: 1 |
Top |
Cell-cell communication analysis |
| Identification of potential cell-cell interactions between two cell types and their ligand-receptor pairs for different disease states |
| Ligand | Receptor | LRpair | Pathway | Tissue | Disease Stage |
| Page: 1 |
Top |
Single-cell gene regulatory network inference analysis |
| Find out the significant the regulons (TFs) and the target genes of each regulon across cell types for different disease states |
| TF | Cell Type | Tissue | Disease Stage | Target Gene | RSS | Regulon Activity |
| ∗The dot plots of a searched regulon are shown for all cell subpopulations in each disease state of each tissue based on the regulon specific score inferred using pySCENIC and by calculating the average expression. |
| Page: 1 |
Top |
Somatic mutation of malignant transformation related genes |
| Annotation of somatic variants for genes involved in malignant transformation |
| Hugo Symbol | Variant Class | Variant Classification | dbSNP RS | HGVSc | HGVSp | HGVSp Short | SWISSPROT | BIOTYPE | SIFT | PolyPhen | Tumor Sample Barcode | Tissue | Histology | Sex | Age | Stage | Therapy Types | Drugs | Outcome |
| ANKZF1 | SNV | Missense_Mutation | rs750299159 | c.316G>A | p.Asp106Asn | p.D106N | Q9H8Y5 | protein_coding | tolerated(0.21) | benign(0) | TCGA-D8-A1Y3-01 | Breast | breast invasive carcinoma | Female | <65 | III/IV | Chemotherapy | doxorubicine+cyclophosphamide | SD |
| ANKZF1 | SNV | Missense_Mutation | novel | c.1330N>G | p.Lys444Glu | p.K444E | Q9H8Y5 | protein_coding | tolerated(0.16) | benign(0.015) | TCGA-E2-A56Z-01 | Breast | breast invasive carcinoma | Female | >=65 | I/II | Hormone Therapy | arimidex | SD |
| ANKZF1 | SNV | Missense_Mutation | novel | c.1951N>A | p.Ala651Thr | p.A651T | Q9H8Y5 | protein_coding | deleterious(0) | possibly_damaging(0.588) | TCGA-E9-A54X-01 | Breast | breast invasive carcinoma | Female | >=65 | I/II | Unknown | Unknown | SD |
| ANKZF1 | insertion | Frame_Shift_Ins | novel | c.1505_1506insTTGGCTTGCCTCCCCACACCCAGCCGCGGCGA | p.Arg503TrpfsTer19 | p.R503Wfs*19 | Q9H8Y5 | protein_coding | TCGA-A2-A04Y-01 | Breast | breast invasive carcinoma | Female | <65 | I/II | Chemotherapy | cytoxan | SD | ||
| ANKZF1 | insertion | In_Frame_Ins | novel | c.814_815insCCACTGAGGAGGACTTGCAGACACTGG | p.Tyr272delinsSerThrGluGluAspLeuGlnThrLeuAsp | p.Y272delinsSTEEDLQTLD | Q9H8Y5 | protein_coding | TCGA-A2-A0CX-01 | Breast | breast invasive carcinoma | Female | <65 | I/II | Chemotherapy | adriamycin | SD | ||
| ANKZF1 | insertion | Nonsense_Mutation | novel | c.532_533insTGGAATAAGCAAATAAATAAGGAAAA | p.Tyr178LeufsTer3 | p.Y178Lfs*3 | Q9H8Y5 | protein_coding | TCGA-A8-A07P-01 | Breast | breast invasive carcinoma | Female | >=65 | I/II | Chemotherapy | 5-fluorouracil | SD | ||
| ANKZF1 | SNV | Missense_Mutation | rs750701800 | c.1770N>C | p.Lys590Asn | p.K590N | Q9H8Y5 | protein_coding | deleterious(0.02) | possibly_damaging(0.551) | TCGA-C5-A8XJ-01 | Cervix | cervical & endocervical cancer | Female | >=65 | I/II | Chemotherapy | cisplatin | SD |
| ANKZF1 | SNV | Missense_Mutation | c.1240N>C | p.Glu414Gln | p.E414Q | Q9H8Y5 | protein_coding | tolerated(0.19) | benign(0.241) | TCGA-DR-A0ZM-01 | Cervix | cervical & endocervical cancer | Female | <65 | III/IV | Unspecific | Cisplatin | SD | |
| ANKZF1 | SNV | Missense_Mutation | rs768432915 | c.1849N>T | p.Arg617Trp | p.R617W | Q9H8Y5 | protein_coding | deleterious(0) | probably_damaging(0.992) | TCGA-AA-3672-01 | Colorectum | colon adenocarcinoma | Female | >=65 | III/IV | Unknown | Unknown | SD |
| ANKZF1 | SNV | Missense_Mutation | c.738N>T | p.Gln246His | p.Q246H | Q9H8Y5 | protein_coding | deleterious(0) | probably_damaging(0.997) | TCGA-AA-3715-01 | Colorectum | colon adenocarcinoma | Male | >=65 | I/II | Unknown | Unknown | PD |
| Page: 1 2 3 4 5 6 7 |
Top |
Related drugs of malignant transformation related genes |
| Identification of chemicals and drugs interact with genes involved in malignant transfromation |
| (DGIdb 4.0) |
| Entrez ID | Symbol | Category | Interaction Types | Drug Claim Name | Drug Name | PMIDs |
| Page: 1 |

Copyright 2023-Present -The University of Texas Health Science Center at Houston |