
|
|||||
|
 | |
| |
| |
| |
| |
| |
|
Gene: ANKS3 |
Gene summary for ANKS3 |
| Gene information | Species | Human | Gene symbol | ANKS3 | Gene ID | 124401 |
| Gene name | ankyrin repeat and sterile alpha motif domain containing 3 | |
| Gene Alias | ANKS3 | |
| Cytomap | 16p13.3 | |
| Gene Type | protein-coding | GO ID | GO:0005575 | UniProtAcc | F6WF08 |
Top |
Malignant transformation analysis |
| Identification of the aberrant gene expression in precancerous and cancerous lesions by comparing the gene expression of stem-like cells in diseased tissues with normal stem cells |
| Entrez ID | Symbol | Replicates | Species | Organ | Tissue | Adj P-value | Log2FC | Malignancy |
| 124401 | ANKS3 | PTC01 | Human | Thyroid | PTC | 8.17e-15 | 2.27e-01 | 0.1899 |
| 124401 | ANKS3 | PTC03 | Human | Thyroid | PTC | 3.54e-03 | 1.75e-01 | 0.1784 |
| 124401 | ANKS3 | PTC04 | Human | Thyroid | PTC | 1.18e-13 | 2.00e-01 | 0.1927 |
| 124401 | ANKS3 | PTC05 | Human | Thyroid | PTC | 3.72e-10 | 3.42e-01 | 0.2065 |
| 124401 | ANKS3 | PTC06 | Human | Thyroid | PTC | 1.13e-17 | 3.68e-01 | 0.2057 |
| 124401 | ANKS3 | PTC07 | Human | Thyroid | PTC | 4.01e-18 | 2.78e-01 | 0.2044 |
| 124401 | ANKS3 | ATC09 | Human | Thyroid | ATC | 6.68e-10 | 3.44e-01 | 0.2871 |
| 124401 | ANKS3 | ATC11 | Human | Thyroid | ATC | 1.60e-07 | 4.60e-01 | 0.3386 |
| 124401 | ANKS3 | ATC12 | Human | Thyroid | ATC | 2.53e-21 | 4.31e-01 | 0.34 |
| 124401 | ANKS3 | ATC13 | Human | Thyroid | ATC | 9.35e-33 | 5.07e-01 | 0.34 |
| 124401 | ANKS3 | ATC1 | Human | Thyroid | ATC | 2.08e-10 | 3.71e-01 | 0.2878 |
| 124401 | ANKS3 | ATC2 | Human | Thyroid | ATC | 3.34e-11 | 6.49e-01 | 0.34 |
| 124401 | ANKS3 | ATC3 | Human | Thyroid | ATC | 2.42e-14 | 5.73e-01 | 0.338 |
| 124401 | ANKS3 | ATC4 | Human | Thyroid | ATC | 2.52e-29 | 5.27e-01 | 0.34 |
| 124401 | ANKS3 | ATC5 | Human | Thyroid | ATC | 4.60e-30 | 5.35e-01 | 0.34 |
| Page: 1 |
| Tissue | Expression Dynamics | Abbreviation |
| Thyroid | 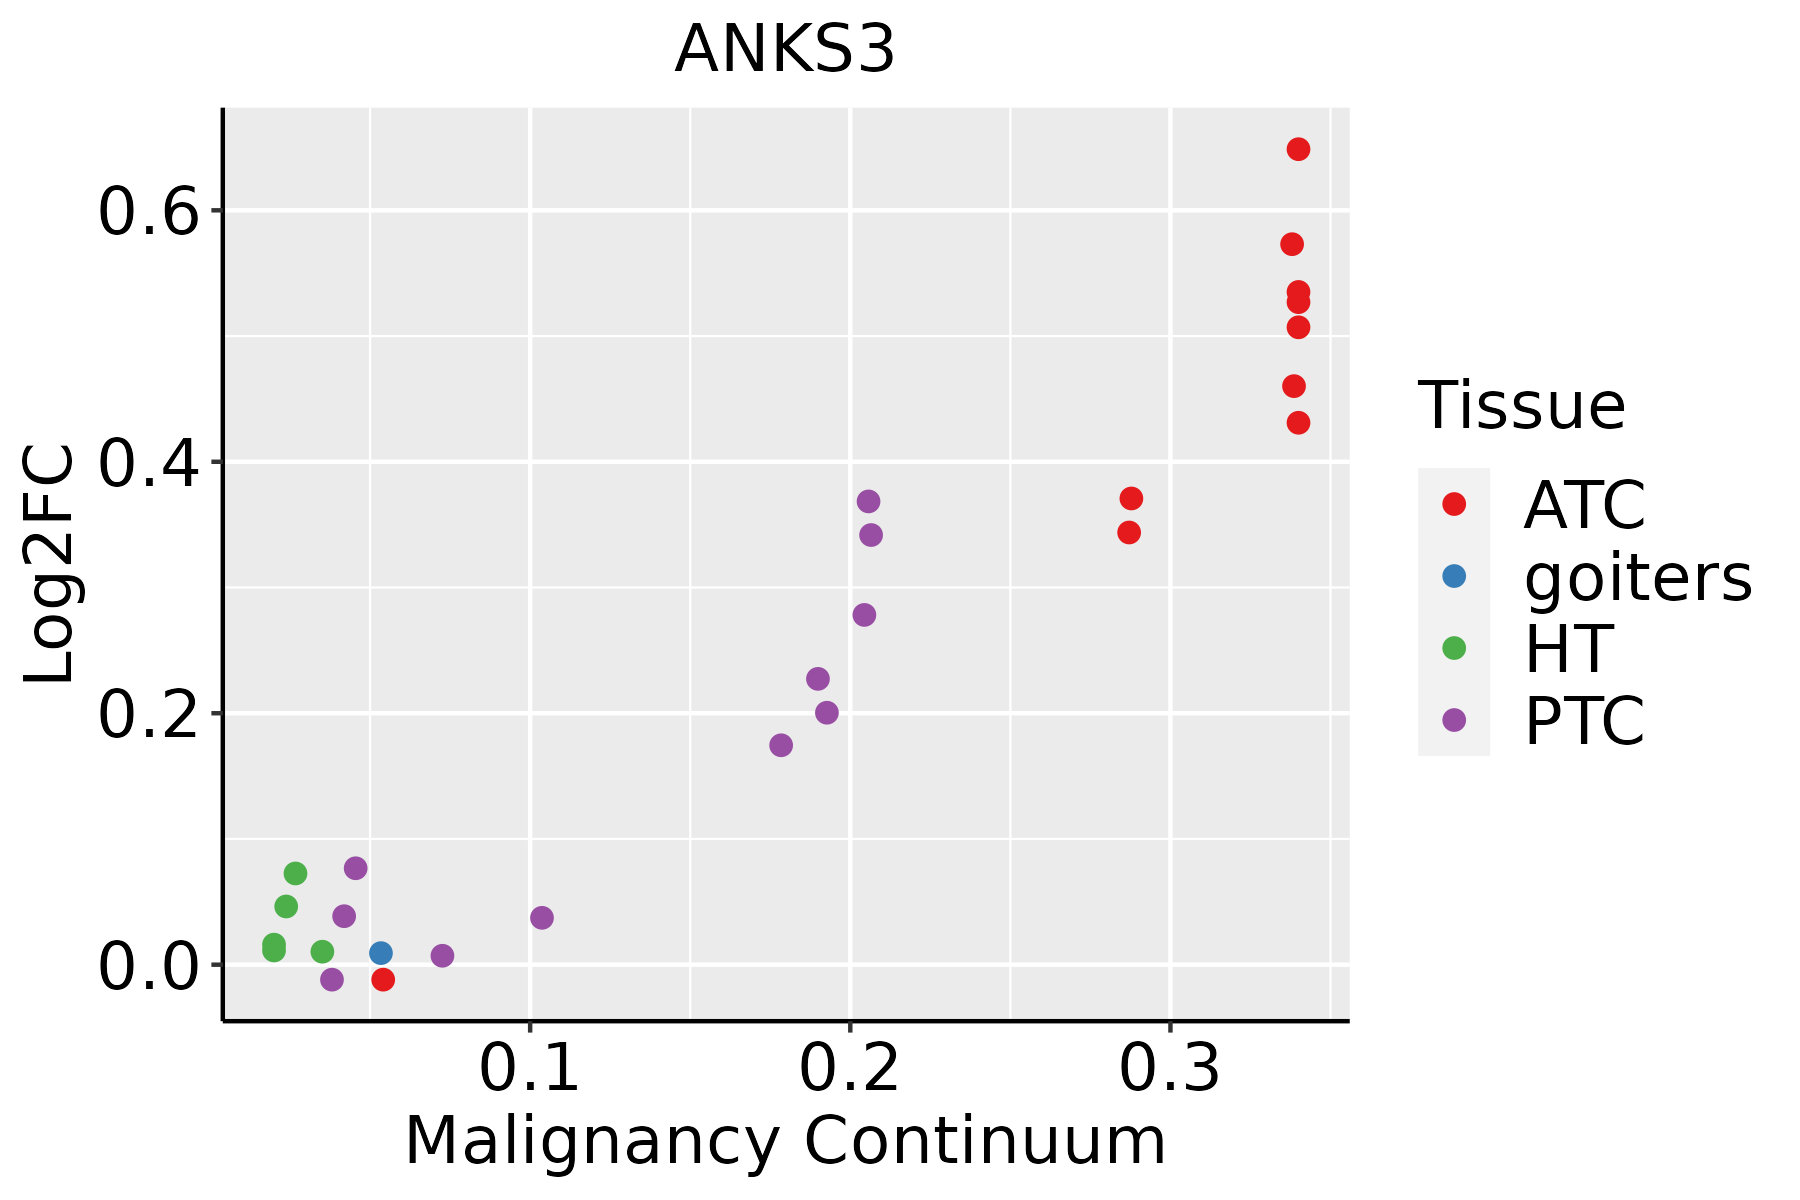 | ATC: Anaplastic thyroid cancer |
| HT: Hashimoto's thyroiditis | ||
| PTC: Papillary thyroid cancer |
| ∗log2FC in expression of this searched gene in stem-like cells from each diseased tissue sample relative to stem-like cells in normal samples in each tissue plotted against the malignancy continuum. Samples are colored based on if they are from different disease stage. |
Top |
Malignant transformation related pathway analysis |
| Find out the enriched GO biological processes and KEGG pathways involved in transition from healthy to precancer to cancer |
| Tissue | Disease Stage | Enriched GO biological Processes |
| Colorectum | AD |  |
| Colorectum | SER |  |
| Colorectum | MSS |  |
| Colorectum | MSI-H |  |
| Colorectum | FAP |  |
| ∗Top 15 enriched GO BP terms are showed in the bar plot of each disease state in each tissue. Each row represents a significant GO biological process which is colored according to the -log10(p.adjust). |
| Page: 1 2 3 4 5 6 7 8 9 |
| GO ID | Tissue | Disease Stage | Description | Gene Ratio | Bg Ratio | pvalue | p.adjust | Count |
| Page: 1 |
| Pathway ID | Tissue | Disease Stage | Description | Gene Ratio | Bg Ratio | pvalue | p.adjust | qvalue | Count |
| Page: 1 |
Top |
Cell-cell communication analysis |
| Identification of potential cell-cell interactions between two cell types and their ligand-receptor pairs for different disease states |
| Ligand | Receptor | LRpair | Pathway | Tissue | Disease Stage |
| Page: 1 |
Top |
Single-cell gene regulatory network inference analysis |
| Find out the significant the regulons (TFs) and the target genes of each regulon across cell types for different disease states |
| TF | Cell Type | Tissue | Disease Stage | Target Gene | RSS | Regulon Activity |
| ∗The dot plots of a searched regulon are shown for all cell subpopulations in each disease state of each tissue based on the regulon specific score inferred using pySCENIC and by calculating the average expression. |
| Page: 1 |
Top |
Somatic mutation of malignant transformation related genes |
| Annotation of somatic variants for genes involved in malignant transformation |
| Hugo Symbol | Variant Class | Variant Classification | dbSNP RS | HGVSc | HGVSp | HGVSp Short | SWISSPROT | BIOTYPE | SIFT | PolyPhen | Tumor Sample Barcode | Tissue | Histology | Sex | Age | Stage | Therapy Types | Drugs | Outcome |
| ANKS3 | insertion | In_Frame_Ins | novel | c.810_811insCACACCACAGATAGAGCCATGCCAGGTCGCAGGGGCAAG | p.Arg270_Ala271insHisThrThrAspArgAlaMetProGlyArgArgGlyLys | p.R270_A271insHTTDRAMPGRRGK | Q6ZW76 | protein_coding | TCGA-A8-A06P-01 | Breast | breast invasive carcinoma | Female | <65 | III/IV | Unspecific | SD | |||
| ANKS3 | insertion | Frame_Shift_Ins | novel | c.7_8insT | p.Glu3ValfsTer5 | p.E3Vfs*5 | Q6ZW76 | protein_coding | TCGA-A8-A09X-01 | Breast | breast invasive carcinoma | Female | <65 | III/IV | Unknown | Unknown | SD | ||
| ANKS3 | insertion | In_Frame_Ins | novel | c.6_7insAGCTGTGGCAACGAGAGCATCGCCTACTTTCTTCTCCAG | p.Ser2_Glu3insSerCysGlyAsnGluSerIleAlaTyrPheLeuLeuGln | p.S2_E3insSCGNESIAYFLLQ | Q6ZW76 | protein_coding | TCGA-A8-A09X-01 | Breast | breast invasive carcinoma | Female | <65 | III/IV | Unknown | Unknown | SD | ||
| ANKS3 | insertion | In_Frame_Ins | novel | c.1173_1174insCCC | p.Met391_Lys392insPro | p.M391_K392insP | Q6ZW76 | protein_coding | TCGA-AO-A0JB-01 | Breast | breast invasive carcinoma | Female | <65 | III/IV | Chemotherapy | cyclophosphamide | SD | ||
| ANKS3 | insertion | Frame_Shift_Ins | novel | c.1171_1172insGGCGTGAGCCACCACACCTGGCCTGGTGCCA | p.Met391ArgfsTer17 | p.M391Rfs*17 | Q6ZW76 | protein_coding | TCGA-AO-A0JB-01 | Breast | breast invasive carcinoma | Female | <65 | III/IV | Chemotherapy | cyclophosphamide | SD | ||
| ANKS3 | insertion | Frame_Shift_Ins | novel | c.1819_1820insACAATCAGGCACTC | p.Gly607AspfsTer14 | p.G607Dfs*14 | Q6ZW76 | protein_coding | TCGA-BH-A0AY-01 | Breast | breast invasive carcinoma | Female | <65 | I/II | Chemotherapy | SD | |||
| ANKS3 | deletion | Frame_Shift_Del | novel | c.1468delC | p.Arg490AlafsTer33 | p.R490Afs*33 | Q6ZW76 | protein_coding | TCGA-EW-A2FV-01 | Breast | breast invasive carcinoma | Female | <65 | III/IV | Chemotherapy | docetaxel | SD | ||
| ANKS3 | SNV | Missense_Mutation | rs113252244 | c.1354N>A | p.Asp452Asn | p.D452N | Q6ZW76 | protein_coding | deleterious(0.03) | benign(0.394) | TCGA-MA-AA41-01 | Cervix | cervical & endocervical cancer | Female | <65 | I/II | Unknown | Unknown | SD |
| ANKS3 | SNV | Missense_Mutation | novel | c.1738N>C | p.Glu580Gln | p.E580Q | Q6ZW76 | protein_coding | tolerated_low_confidence(0.06) | possibly_damaging(0.722) | TCGA-ZJ-A8QR-01 | Cervix | cervical & endocervical cancer | Female | <65 | I/II | Unknown | Unknown | SD |
| ANKS3 | SNV | Missense_Mutation | c.206N>A | p.Gly69Asp | p.G69D | Q6ZW76 | protein_coding | deleterious(0) | probably_damaging(0.98) | TCGA-AD-6964-01 | Colorectum | colon adenocarcinoma | Male | <65 | III/IV | Chemotherapy | folfox | PD |
| Page: 1 2 3 4 5 |
Top |
Related drugs of malignant transformation related genes |
| Identification of chemicals and drugs interact with genes involved in malignant transfromation |
| (DGIdb 4.0) |
| Entrez ID | Symbol | Category | Interaction Types | Drug Claim Name | Drug Name | PMIDs |
| Page: 1 |

Copyright 2023-Present -The University of Texas Health Science Center at Houston |