
|
|||||
|
 | |
| |
| |
| |
| |
| |
|
Gene: ANKS1A |
Gene summary for ANKS1A |
| Gene information | Species | Human | Gene symbol | ANKS1A | Gene ID | 23294 |
| Gene name | ankyrin repeat and sterile alpha motif domain containing 1A | |
| Gene Alias | ANKS1 | |
| Cytomap | 6p21.31 | |
| Gene Type | protein-coding | GO ID | GO:0006928 | UniProtAcc | Q05CP0 |
Top |
Malignant transformation analysis |
| Identification of the aberrant gene expression in precancerous and cancerous lesions by comparing the gene expression of stem-like cells in diseased tissues with normal stem cells |
| Entrez ID | Symbol | Replicates | Species | Organ | Tissue | Adj P-value | Log2FC | Malignancy |
| 23294 | ANKS1A | CCI_1 | Human | Cervix | CC | 2.89e-06 | 8.34e-01 | 0.528 |
| 23294 | ANKS1A | CCI_2 | Human | Cervix | CC | 7.99e-15 | 1.26e+00 | 0.5249 |
| 23294 | ANKS1A | CCI_3 | Human | Cervix | CC | 1.89e-18 | 1.03e+00 | 0.516 |
| 23294 | ANKS1A | HTA11_3410_2000001011 | Human | Colorectum | AD | 2.43e-14 | -5.34e-01 | 0.0155 |
| 23294 | ANKS1A | HTA11_2487_2000001011 | Human | Colorectum | SER | 2.51e-02 | -3.38e-01 | -0.1808 |
| 23294 | ANKS1A | HTA11_2951_2000001011 | Human | Colorectum | AD | 1.59e-02 | -6.84e-01 | 0.0216 |
| 23294 | ANKS1A | HTA11_1938_2000001011 | Human | Colorectum | AD | 2.71e-03 | -3.34e-01 | -0.0811 |
| 23294 | ANKS1A | HTA11_3361_2000001011 | Human | Colorectum | AD | 4.50e-03 | -3.77e-01 | -0.1207 |
| 23294 | ANKS1A | HTA11_866_3004761011 | Human | Colorectum | AD | 1.53e-02 | -3.70e-01 | 0.096 |
| 23294 | ANKS1A | HTA11_8622_2000001021 | Human | Colorectum | SER | 2.92e-02 | -5.99e-01 | 0.0528 |
| 23294 | ANKS1A | HTA11_10711_2000001011 | Human | Colorectum | AD | 7.36e-03 | -3.76e-01 | 0.0338 |
| 23294 | ANKS1A | HTA11_99999970781_79442 | Human | Colorectum | MSS | 2.44e-06 | -4.31e-01 | 0.294 |
| 23294 | ANKS1A | HTA11_99999974143_84620 | Human | Colorectum | MSS | 1.68e-12 | -5.24e-01 | 0.3005 |
| 23294 | ANKS1A | A002-C-010 | Human | Colorectum | FAP | 3.20e-04 | -2.22e-01 | 0.242 |
| 23294 | ANKS1A | A001-C-207 | Human | Colorectum | FAP | 2.28e-03 | -2.56e-01 | 0.1278 |
| 23294 | ANKS1A | A015-C-203 | Human | Colorectum | FAP | 5.06e-39 | -6.15e-01 | -0.1294 |
| 23294 | ANKS1A | A015-C-204 | Human | Colorectum | FAP | 6.75e-15 | -5.21e-01 | -0.0228 |
| 23294 | ANKS1A | A014-C-040 | Human | Colorectum | FAP | 8.70e-10 | -7.13e-01 | -0.1184 |
| 23294 | ANKS1A | A002-C-201 | Human | Colorectum | FAP | 6.57e-19 | -5.07e-01 | 0.0324 |
| 23294 | ANKS1A | A002-C-203 | Human | Colorectum | FAP | 3.35e-06 | -2.67e-01 | 0.2786 |
| Page: 1 2 3 4 |
| Tissue | Expression Dynamics | Abbreviation |
| Cervix |  | CC: Cervix cancer |
| HSIL_HPV: HPV-infected high-grade squamous intraepithelial lesions | ||
| N_HPV: HPV-infected normal cervix | ||
| Colorectum (GSE201348) |  | FAP: Familial adenomatous polyposis |
| CRC: Colorectal cancer | ||
| Colorectum (HTA11) |  | AD: Adenomas |
| SER: Sessile serrated lesions | ||
| MSI-H: Microsatellite-high colorectal cancer | ||
| MSS: Microsatellite stable colorectal cancer | ||
| Endometrium | 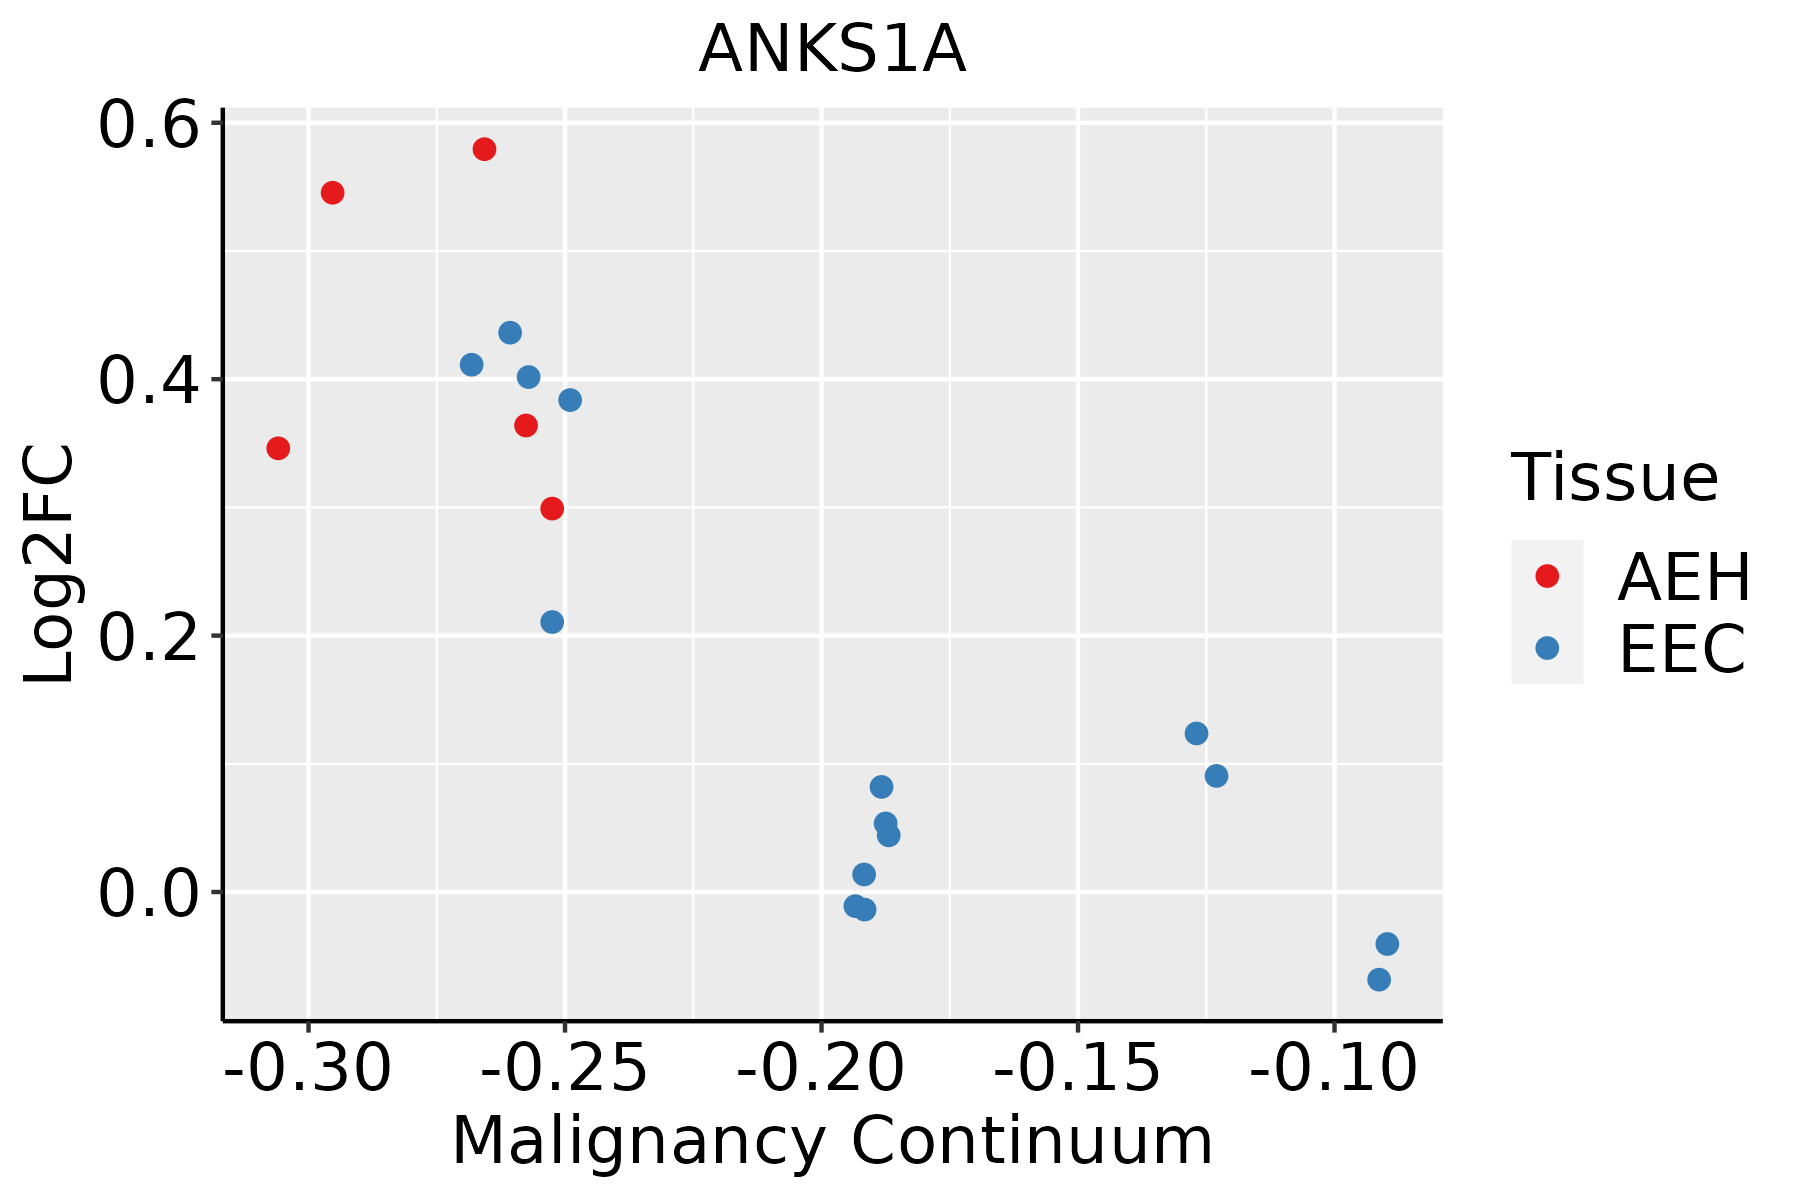 | AEH: Atypical endometrial hyperplasia |
| EEC: Endometrioid Cancer | ||
| Lung | 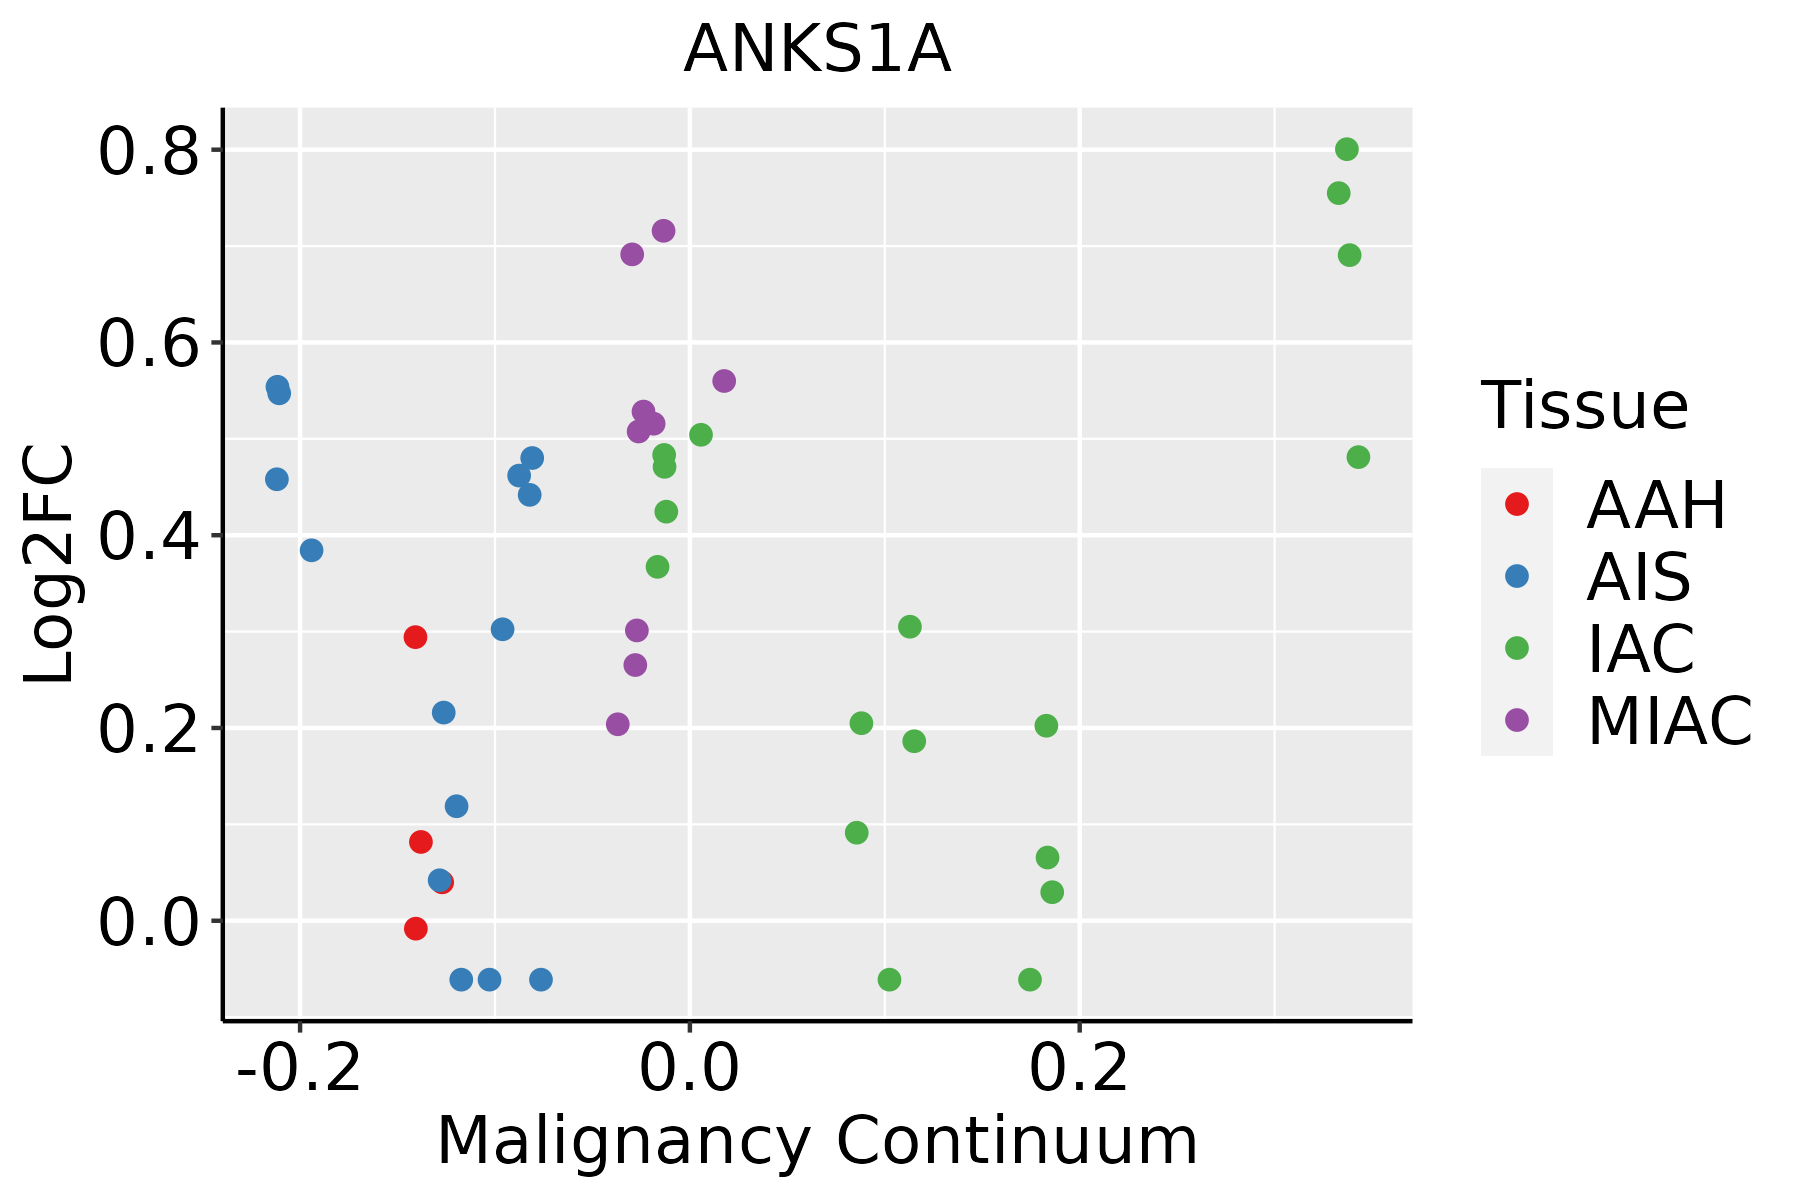 | AAH: Atypical adenomatous hyperplasia |
| AIS: Adenocarcinoma in situ | ||
| IAC: Invasive lung adenocarcinoma | ||
| MIA: Minimally invasive adenocarcinoma |
| ∗log2FC in expression of this searched gene in stem-like cells from each diseased tissue sample relative to stem-like cells in normal samples in each tissue plotted against the malignancy continuum. Samples are colored based on if they are from different disease stage. |
Top |
Malignant transformation related pathway analysis |
| Find out the enriched GO biological processes and KEGG pathways involved in transition from healthy to precancer to cancer |
| Tissue | Disease Stage | Enriched GO biological Processes |
| Colorectum | AD |  |
| Colorectum | SER |  |
| Colorectum | MSS |  |
| Colorectum | MSI-H |  |
| Colorectum | FAP |  |
| ∗Top 15 enriched GO BP terms are showed in the bar plot of each disease state in each tissue. Each row represents a significant GO biological process which is colored according to the -log10(p.adjust). |
| Page: 1 2 3 4 5 6 7 8 9 |
| GO ID | Tissue | Disease Stage | Description | Gene Ratio | Bg Ratio | pvalue | p.adjust | Count |
| GO:00069292 | Cervix | CC | substrate-dependent cell migration | 9/2311 | 23/18723 | 1.05e-03 | 8.76e-03 | 9 |
| GO:00480131 | Cervix | CC | ephrin receptor signaling pathway | 14/2311 | 51/18723 | 2.78e-03 | 1.87e-02 | 14 |
| GO:0048013 | Colorectum | MSS | ephrin receptor signaling pathway | 17/3467 | 51/18723 | 8.28e-03 | 4.99e-02 | 17 |
| GO:0021700 | Colorectum | FAP | developmental maturation | 57/2622 | 280/18723 | 2.08e-03 | 1.72e-02 | 57 |
| GO:00217001 | Colorectum | CRC | developmental maturation | 47/2078 | 280/18723 | 2.52e-03 | 2.38e-02 | 47 |
| GO:0006929 | Lung | IAC | substrate-dependent cell migration | 8/2061 | 23/18723 | 2.28e-03 | 2.22e-02 | 8 |
| GO:00069291 | Lung | AIS | substrate-dependent cell migration | 9/1849 | 23/18723 | 1.98e-04 | 4.07e-03 | 9 |
| Page: 1 |
| Pathway ID | Tissue | Disease Stage | Description | Gene Ratio | Bg Ratio | pvalue | p.adjust | qvalue | Count |
| Page: 1 |
Top |
Cell-cell communication analysis |
| Identification of potential cell-cell interactions between two cell types and their ligand-receptor pairs for different disease states |
| Ligand | Receptor | LRpair | Pathway | Tissue | Disease Stage |
| Page: 1 |
Top |
Single-cell gene regulatory network inference analysis |
| Find out the significant the regulons (TFs) and the target genes of each regulon across cell types for different disease states |
| TF | Cell Type | Tissue | Disease Stage | Target Gene | RSS | Regulon Activity |
| ∗The dot plots of a searched regulon are shown for all cell subpopulations in each disease state of each tissue based on the regulon specific score inferred using pySCENIC and by calculating the average expression. |
| Page: 1 |
Top |
Somatic mutation of malignant transformation related genes |
| Annotation of somatic variants for genes involved in malignant transformation |
| Hugo Symbol | Variant Class | Variant Classification | dbSNP RS | HGVSc | HGVSp | HGVSp Short | SWISSPROT | BIOTYPE | SIFT | PolyPhen | Tumor Sample Barcode | Tissue | Histology | Sex | Age | Stage | Therapy Types | Drugs | Outcome |
| ANKS1A | SNV | Missense_Mutation | rs140739340 | c.2270G>A | p.Arg757His | p.R757H | Q92625 | protein_coding | deleterious(0.03) | possibly_damaging(0.742) | TCGA-A8-A081-01 | Breast | breast invasive carcinoma | Female | >=65 | I/II | Unknown | Unknown | SD |
| ANKS1A | SNV | Missense_Mutation | rs769495288 | c.814G>C | p.Asp272His | p.D272H | Q92625 | protein_coding | deleterious(0) | probably_damaging(0.999) | TCGA-AC-A23H-01 | Breast | breast invasive carcinoma | Female | >=65 | I/II | Unknown | Unknown | PD |
| ANKS1A | SNV | Missense_Mutation | c.2912N>G | p.Ser971Cys | p.S971C | Q92625 | protein_coding | deleterious(0) | probably_damaging(0.999) | TCGA-C8-A27B-01 | Breast | breast invasive carcinoma | Female | <65 | I/II | Chemotherapy | 5-fluorouracil | CR | |
| ANKS1A | SNV | Missense_Mutation | c.470C>T | p.Ala157Val | p.A157V | Q92625 | protein_coding | deleterious(0) | probably_damaging(0.968) | TCGA-D8-A73W-01 | Breast | breast invasive carcinoma | Female | >=65 | III/IV | Hormone Therapy | tamoxiphen | PD | |
| ANKS1A | insertion | Nonsense_Mutation | novel | c.528_529insTTCCTTCATGGCACACAGGGCATTGCCAGTGTTTAAG | p.Met177PhefsTer12 | p.M177Ffs*12 | Q92625 | protein_coding | TCGA-B6-A0IA-01 | Breast | breast invasive carcinoma | Female | <65 | I/II | Unknown | Unknown | SD | ||
| ANKS1A | deletion | In_Frame_Del | rs773416236 | c.2119_2124delNNNNNN | p.Ser707_Ile708del | p.S707_I708del | Q92625 | protein_coding | TCGA-B6-A1KF-01 | Breast | breast invasive carcinoma | Female | >=65 | I/II | Unknown | Unknown | SD | ||
| ANKS1A | deletion | Frame_Shift_Del | novel | c.1050delN | p.Phe351LeufsTer46 | p.F351Lfs*46 | Q92625 | protein_coding | TCGA-EW-A2FV-01 | Breast | breast invasive carcinoma | Female | <65 | III/IV | Chemotherapy | docetaxel | SD | ||
| ANKS1A | SNV | Missense_Mutation | c.992N>G | p.Ser331Cys | p.S331C | Q92625 | protein_coding | deleterious(0) | benign(0.319) | TCGA-C5-A7UH-01 | Cervix | cervical & endocervical cancer | Female | <65 | III/IV | Chemotherapy | cisplatin | SD | |
| ANKS1A | SNV | Missense_Mutation | c.1901C>T | p.Ser634Leu | p.S634L | Q92625 | protein_coding | tolerated(0.43) | probably_damaging(0.977) | TCGA-DR-A0ZM-01 | Cervix | cervical & endocervical cancer | Female | <65 | III/IV | Unspecific | Cisplatin | SD | |
| ANKS1A | SNV | Missense_Mutation | c.2209G>A | p.Asp737Asn | p.D737N | Q92625 | protein_coding | deleterious(0.02) | probably_damaging(0.999) | TCGA-DR-A0ZM-01 | Cervix | cervical & endocervical cancer | Female | <65 | III/IV | Unspecific | Cisplatin | SD |
| Page: 1 2 3 4 5 6 7 8 9 10 11 |
Top |
Related drugs of malignant transformation related genes |
| Identification of chemicals and drugs interact with genes involved in malignant transfromation |
| (DGIdb 4.0) |
| Entrez ID | Symbol | Category | Interaction Types | Drug Claim Name | Drug Name | PMIDs |
| Page: 1 |

Copyright 2023-Present -The University of Texas Health Science Center at Houston |