
|
|||||
|
 | |
| |
| |
| |
| |
| |
|
Gene: ANKRD65 |
Gene summary for ANKRD65 |
| Gene information | Species | Human | Gene symbol | ANKRD65 | Gene ID | 441869 |
| Gene name | ankyrin repeat domain 65 | |
| Gene Alias | ANKRD65 | |
| Cytomap | 1p36.33 | |
| Gene Type | protein-coding | GO ID | NA | UniProtAcc | E5RJM6 |
Top |
Malignant transformation analysis |
| Identification of the aberrant gene expression in precancerous and cancerous lesions by comparing the gene expression of stem-like cells in diseased tissues with normal stem cells |
| Entrez ID | Symbol | Replicates | Species | Organ | Tissue | Adj P-value | Log2FC | Malignancy |
| 441869 | ANKRD65 | LZE4T | Human | Esophagus | ESCC | 4.94e-04 | 1.98e-01 | 0.0811 |
| 441869 | ANKRD65 | LZE7T | Human | Esophagus | ESCC | 2.56e-09 | 6.09e-01 | 0.0667 |
| 441869 | ANKRD65 | LZE8T | Human | Esophagus | ESCC | 1.46e-09 | 3.42e-01 | 0.067 |
| 441869 | ANKRD65 | LZE22D1 | Human | Esophagus | HGIN | 2.89e-02 | 1.58e-01 | 0.0595 |
| 441869 | ANKRD65 | LZE22T | Human | Esophagus | ESCC | 5.70e-03 | 3.65e-01 | 0.068 |
| 441869 | ANKRD65 | P1T-E | Human | Esophagus | ESCC | 1.80e-06 | 2.71e-01 | 0.0875 |
| 441869 | ANKRD65 | P2T-E | Human | Esophagus | ESCC | 3.62e-37 | 7.28e-01 | 0.1177 |
| 441869 | ANKRD65 | P4T-E | Human | Esophagus | ESCC | 7.02e-17 | 3.85e-01 | 0.1323 |
| 441869 | ANKRD65 | P5T-E | Human | Esophagus | ESCC | 7.90e-11 | 2.69e-01 | 0.1327 |
| 441869 | ANKRD65 | P8T-E | Human | Esophagus | ESCC | 1.46e-70 | 1.22e+00 | 0.0889 |
| 441869 | ANKRD65 | P9T-E | Human | Esophagus | ESCC | 3.63e-12 | 2.29e-01 | 0.1131 |
| 441869 | ANKRD65 | P10T-E | Human | Esophagus | ESCC | 1.11e-09 | 2.20e-01 | 0.116 |
| 441869 | ANKRD65 | P11T-E | Human | Esophagus | ESCC | 2.63e-05 | 2.13e-01 | 0.1426 |
| 441869 | ANKRD65 | P12T-E | Human | Esophagus | ESCC | 1.29e-09 | 2.23e-01 | 0.1122 |
| 441869 | ANKRD65 | P15T-E | Human | Esophagus | ESCC | 4.03e-12 | 3.07e-01 | 0.1149 |
| 441869 | ANKRD65 | P16T-E | Human | Esophagus | ESCC | 9.26e-17 | 2.90e-01 | 0.1153 |
| 441869 | ANKRD65 | P20T-E | Human | Esophagus | ESCC | 1.76e-09 | 1.90e-01 | 0.1124 |
| 441869 | ANKRD65 | P22T-E | Human | Esophagus | ESCC | 9.26e-17 | 3.40e-01 | 0.1236 |
| 441869 | ANKRD65 | P23T-E | Human | Esophagus | ESCC | 4.78e-07 | 2.32e-01 | 0.108 |
| 441869 | ANKRD65 | P24T-E | Human | Esophagus | ESCC | 4.56e-05 | 1.28e-01 | 0.1287 |
| Page: 1 2 3 4 |
| Tissue | Expression Dynamics | Abbreviation |
| Esophagus | 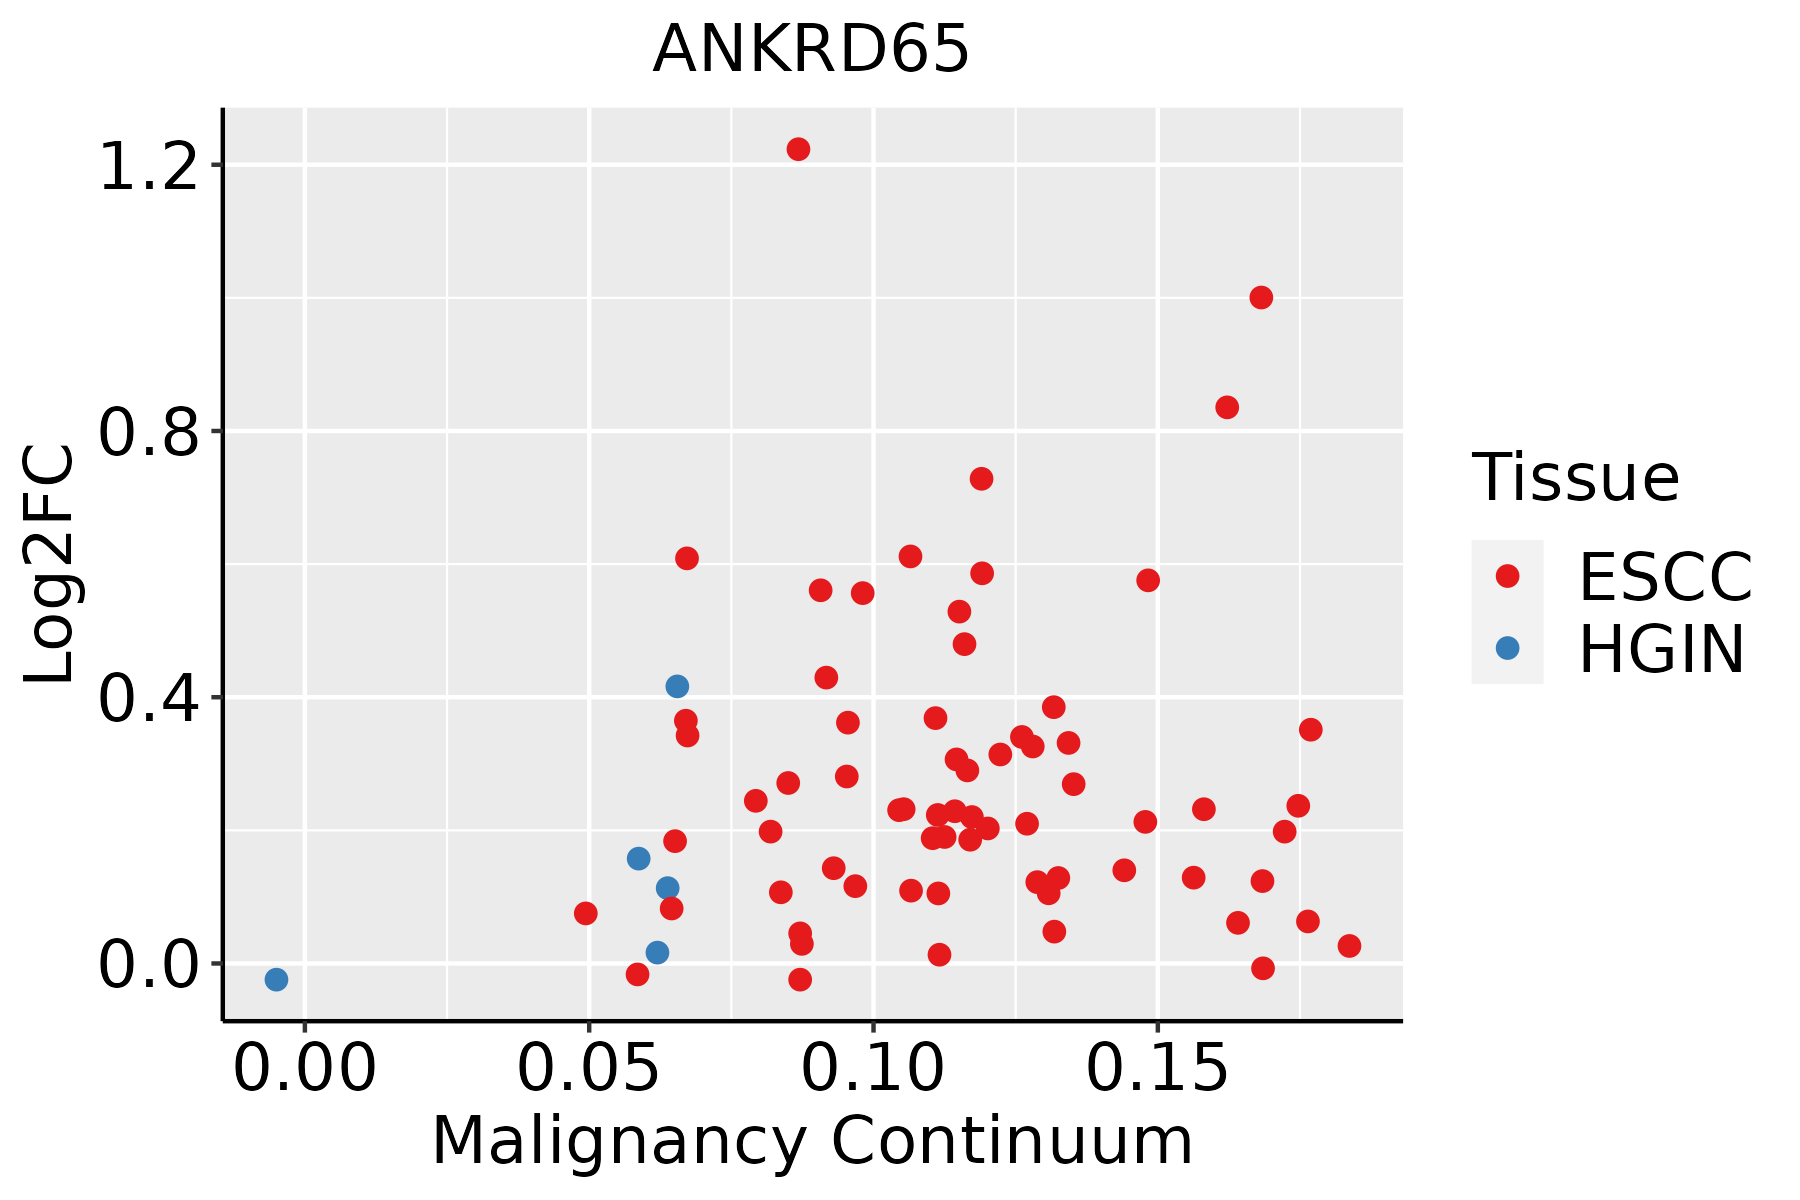 | ESCC: Esophageal squamous cell carcinoma |
| HGIN: High-grade intraepithelial neoplasias | ||
| LGIN: Low-grade intraepithelial neoplasias | ||
| Liver | 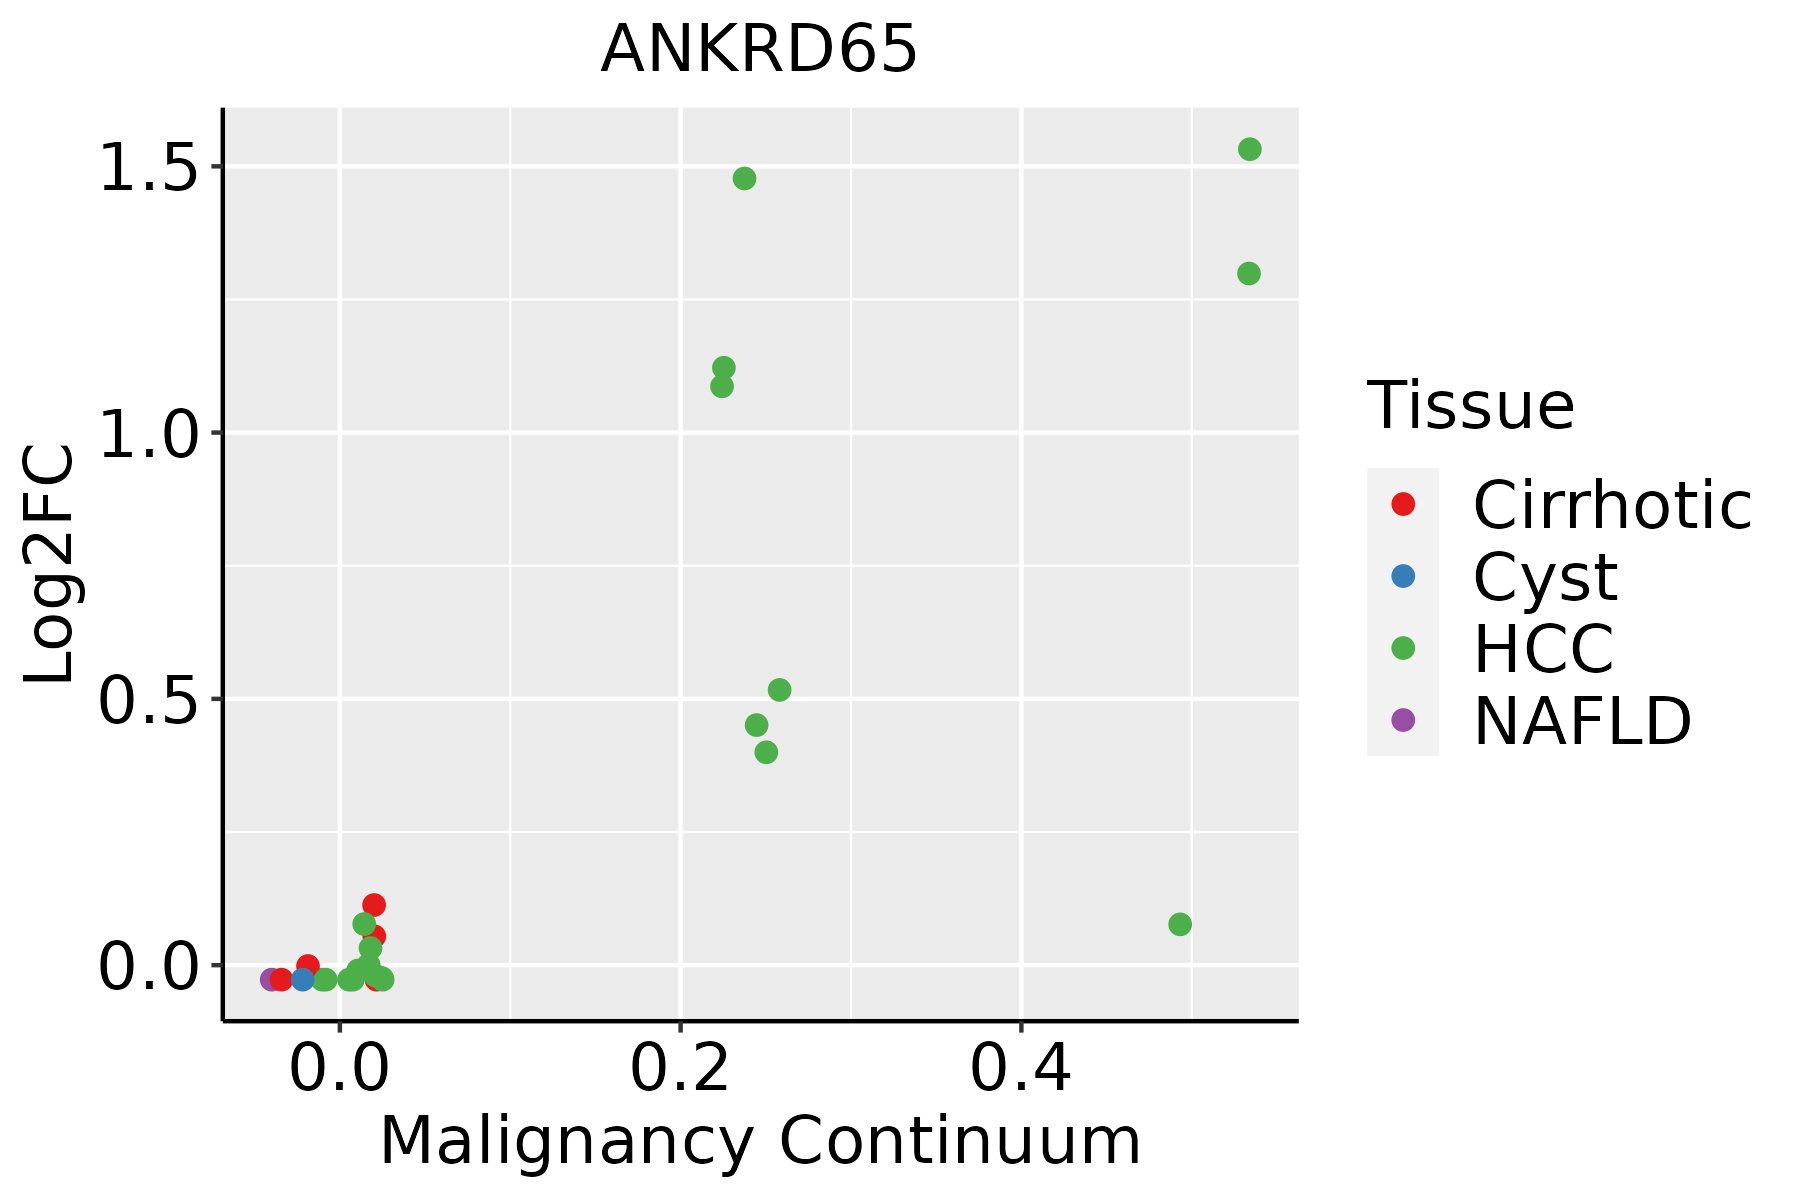 | HCC: Hepatocellular carcinoma |
| NAFLD: Non-alcoholic fatty liver disease | ||
| Oral Cavity | 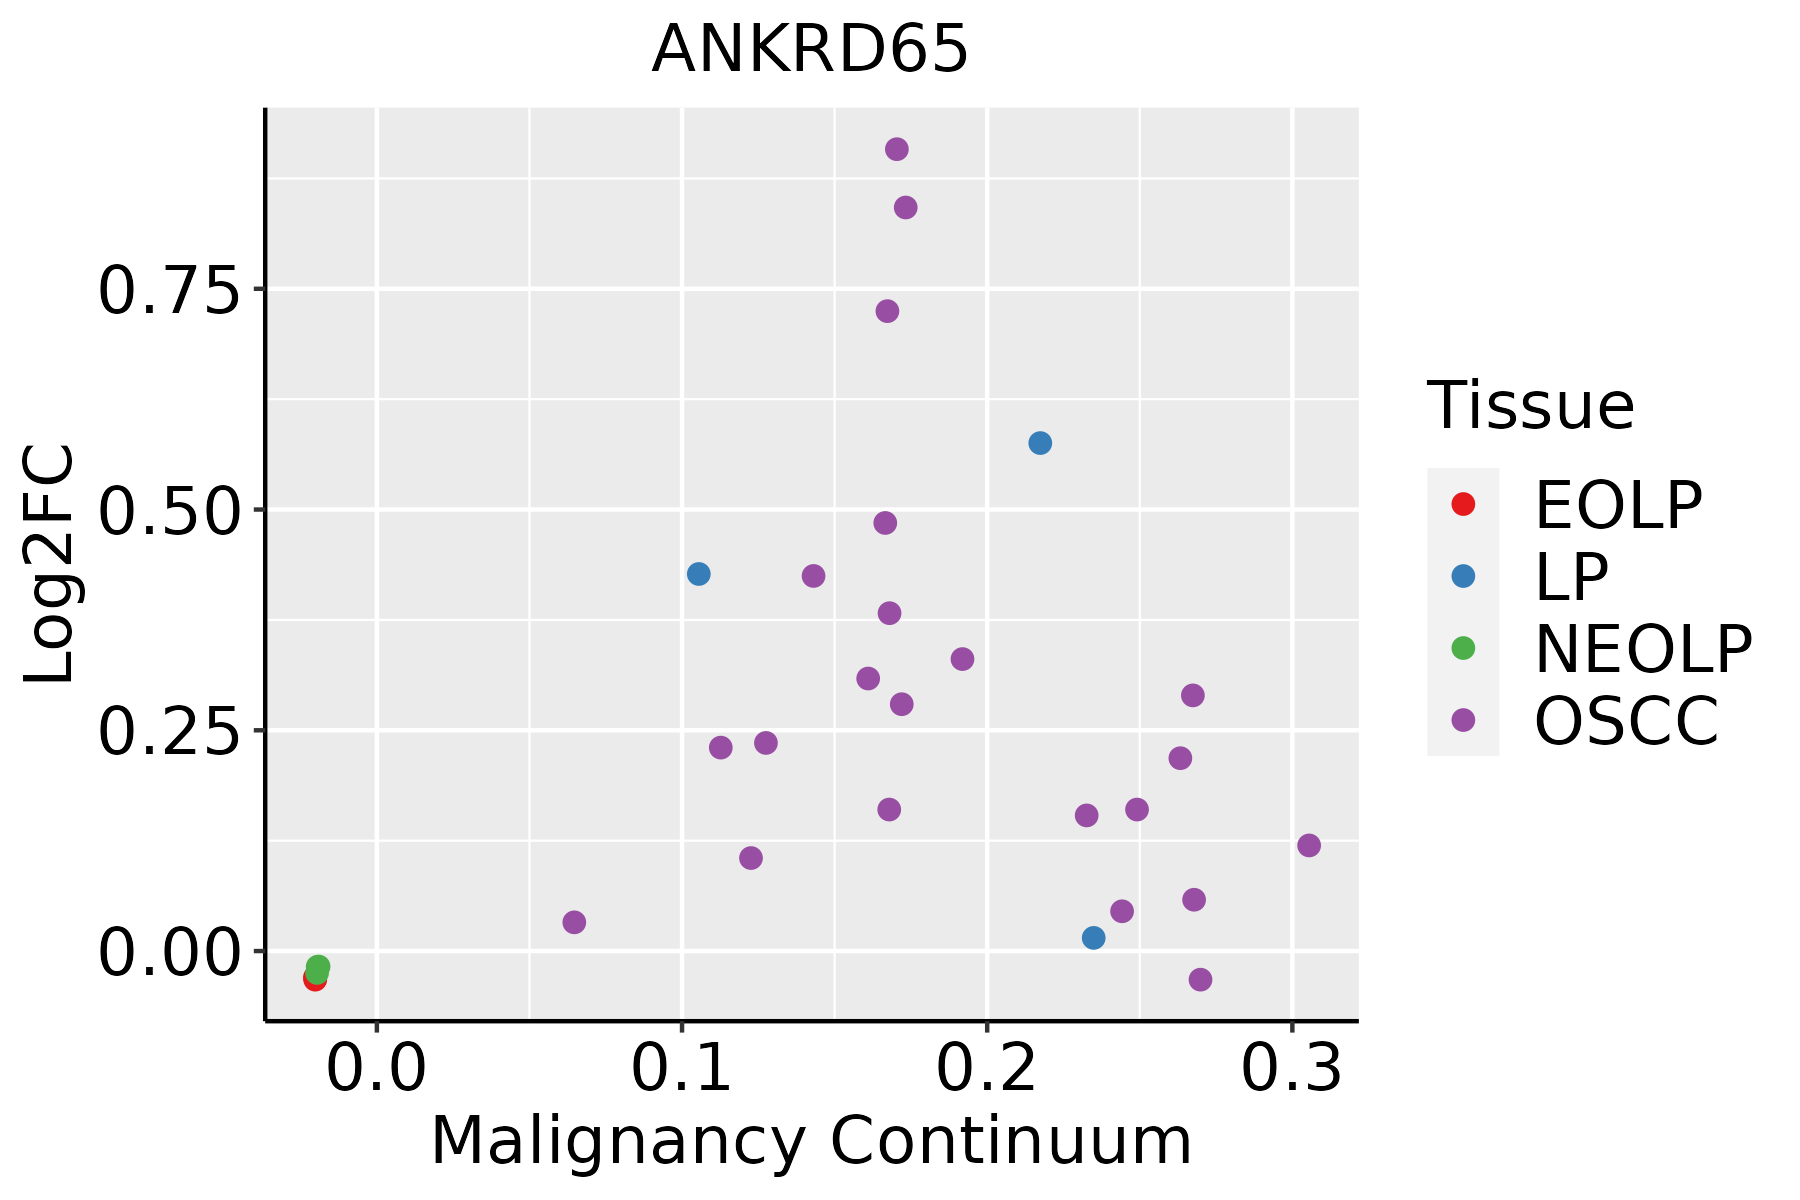 | EOLP: Erosive Oral lichen planus |
| LP: leukoplakia | ||
| NEOLP: Non-erosive oral lichen planus | ||
| OSCC: Oral squamous cell carcinoma |
| ∗log2FC in expression of this searched gene in stem-like cells from each diseased tissue sample relative to stem-like cells in normal samples in each tissue plotted against the malignancy continuum. Samples are colored based on if they are from different disease stage. |
Top |
Malignant transformation related pathway analysis |
| Find out the enriched GO biological processes and KEGG pathways involved in transition from healthy to precancer to cancer |
| Tissue | Disease Stage | Enriched GO biological Processes |
| Colorectum | AD |  |
| Colorectum | SER |  |
| Colorectum | MSS |  |
| Colorectum | MSI-H |  |
| Colorectum | FAP |  |
| ∗Top 15 enriched GO BP terms are showed in the bar plot of each disease state in each tissue. Each row represents a significant GO biological process which is colored according to the -log10(p.adjust). |
| Page: 1 2 3 4 5 6 7 8 9 |
| GO ID | Tissue | Disease Stage | Description | Gene Ratio | Bg Ratio | pvalue | p.adjust | Count |
| Page: 1 |
| Pathway ID | Tissue | Disease Stage | Description | Gene Ratio | Bg Ratio | pvalue | p.adjust | qvalue | Count |
| Page: 1 |
Top |
Cell-cell communication analysis |
| Identification of potential cell-cell interactions between two cell types and their ligand-receptor pairs for different disease states |
| Ligand | Receptor | LRpair | Pathway | Tissue | Disease Stage |
| Page: 1 |
Top |
Single-cell gene regulatory network inference analysis |
| Find out the significant the regulons (TFs) and the target genes of each regulon across cell types for different disease states |
| TF | Cell Type | Tissue | Disease Stage | Target Gene | RSS | Regulon Activity |
| ∗The dot plots of a searched regulon are shown for all cell subpopulations in each disease state of each tissue based on the regulon specific score inferred using pySCENIC and by calculating the average expression. |
| Page: 1 |
Top |
Somatic mutation of malignant transformation related genes |
| Annotation of somatic variants for genes involved in malignant transformation |
| Hugo Symbol | Variant Class | Variant Classification | dbSNP RS | HGVSc | HGVSp | HGVSp Short | SWISSPROT | BIOTYPE | SIFT | PolyPhen | Tumor Sample Barcode | Tissue | Histology | Sex | Age | Stage | Therapy Types | Drugs | Outcome |
| ANKRD65 | SNV | Missense_Mutation | rs751226837 | c.931C>T | p.Arg311Trp | p.R311W | E5RJM6 | protein_coding | tolerated(0.15) | benign(0.073) | TCGA-AC-A3W7-01 | Breast | breast invasive carcinoma | Female | >=65 | I/II | Hormone Therapy | femara | SD |
| ANKRD65 | SNV | Missense_Mutation | novel | c.1004N>A | p.Arg335Gln | p.R335Q | E5RJM6 | protein_coding | tolerated(0.25) | benign(0.003) | TCGA-LP-A4AV-01 | Cervix | cervical & endocervical cancer | Female | <65 | I/II | Unknown | Unknown | SD |
| ANKRD65 | SNV | Missense_Mutation | novel | c.100N>A | p.Glu34Lys | p.E34K | E5RJM6 | protein_coding | tolerated(0.12) | benign(0.086) | TCGA-VS-A8EL-01 | Cervix | cervical & endocervical cancer | Female | <65 | I/II | Chemotherapy | cisplatin | CR |
| ANKRD65 | SNV | Missense_Mutation | novel | c.1008G>T | p.Lys336Asn | p.K336N | E5RJM6 | protein_coding | deleterious(0.01) | benign(0.165) | TCGA-AA-A00N-01 | Colorectum | colon adenocarcinoma | Male | >=65 | I/II | Unknown | Unknown | PD |
| ANKRD65 | SNV | Missense_Mutation | c.981N>T | p.Gln327His | p.Q327H | E5RJM6 | protein_coding | tolerated(0.1) | benign(0.001) | TCGA-AD-6889-01 | Colorectum | colon adenocarcinoma | Male | >=65 | I/II | Chemotherapy | xeloda | PD | |
| ANKRD65 | SNV | Missense_Mutation | c.890N>T | p.Ala297Val | p.A297V | E5RJM6 | protein_coding | tolerated(0.06) | possibly_damaging(0.88) | TCGA-G4-6302-01 | Colorectum | colon adenocarcinoma | Female | >=65 | I/II | Unknown | Unknown | SD | |
| ANKRD65 | SNV | Missense_Mutation | rs185838741 | c.1142C>T | p.Ala381Val | p.A381V | E5RJM6 | protein_coding | tolerated(0.68) | benign(0) | TCGA-G4-6304-01 | Colorectum | colon adenocarcinoma | Female | >=65 | I/II | Chemotherapy | fluorouracil | PD |
| ANKRD65 | SNV | Missense_Mutation | novel | c.1036N>T | p.Gly346Trp | p.G346W | E5RJM6 | protein_coding | deleterious(0) | possibly_damaging(0.875) | TCGA-A5-A0G1-01 | Endometrium | uterine corpus endometrioid carcinoma | Female | >=65 | I/II | Unknown | Unknown | SD |
| ANKRD65 | SNV | Missense_Mutation | c.776G>T | p.Gly259Val | p.G259V | E5RJM6 | protein_coding | deleterious(0) | possibly_damaging(0.643) | TCGA-A5-A1OF-01 | Endometrium | uterine corpus endometrioid carcinoma | Female | <65 | I/II | Unknown | Unknown | SD | |
| ANKRD65 | SNV | Missense_Mutation | novel | c.775G>A | p.Gly259Arg | p.G259R | E5RJM6 | protein_coding | deleterious(0.02) | benign(0.144) | TCGA-A5-A1OF-01 | Endometrium | uterine corpus endometrioid carcinoma | Female | <65 | I/II | Unknown | Unknown | SD |
| Page: 1 2 |
Top |
Related drugs of malignant transformation related genes |
| Identification of chemicals and drugs interact with genes involved in malignant transfromation |
| (DGIdb 4.0) |
| Entrez ID | Symbol | Category | Interaction Types | Drug Claim Name | Drug Name | PMIDs |
| Page: 1 |

Copyright 2023-Present -The University of Texas Health Science Center at Houston |