| Tissue | Expression Dynamics | Abbreviation |
| Esophagus |  | ESCC: Esophageal squamous cell carcinoma |
| HGIN: High-grade intraepithelial neoplasias |
| LGIN: Low-grade intraepithelial neoplasias |
| Liver | 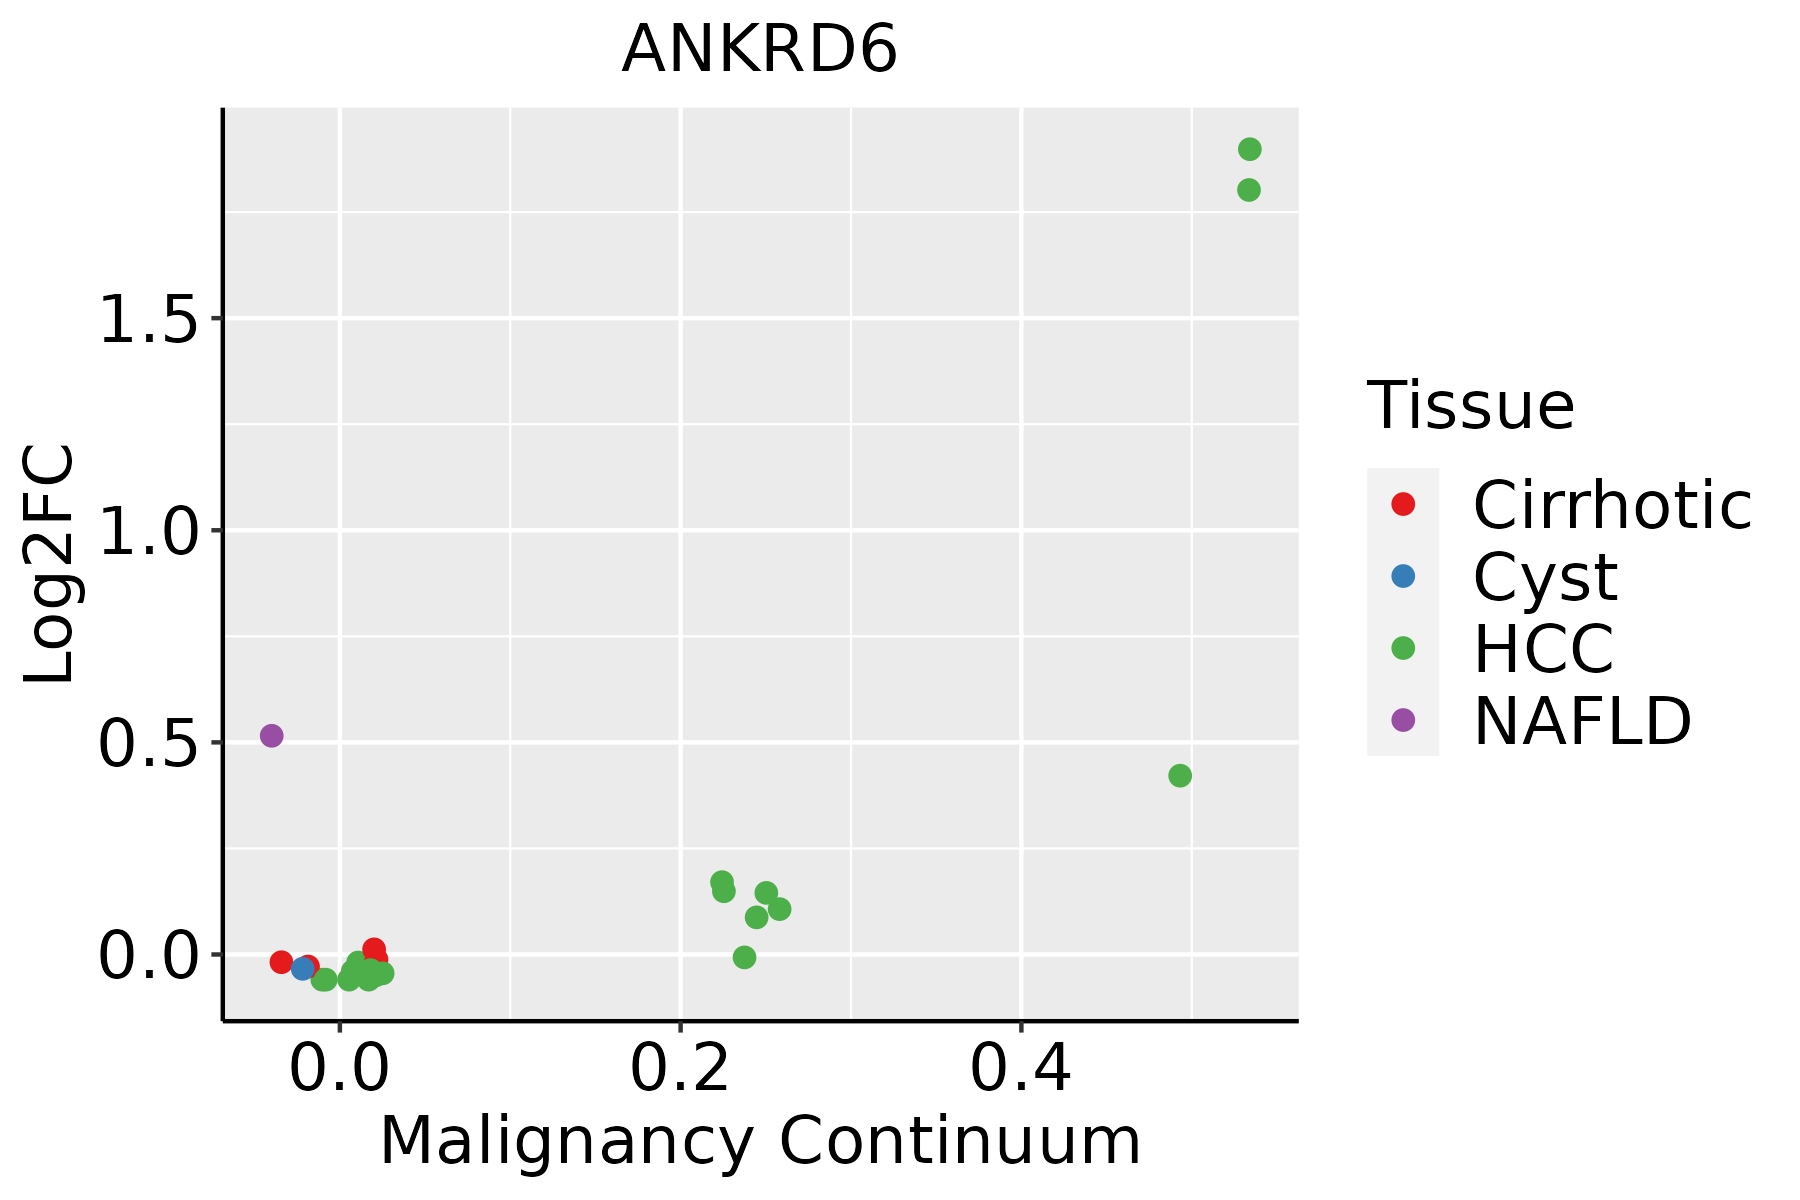 | HCC: Hepatocellular carcinoma |
| NAFLD: Non-alcoholic fatty liver disease |
| Lung | 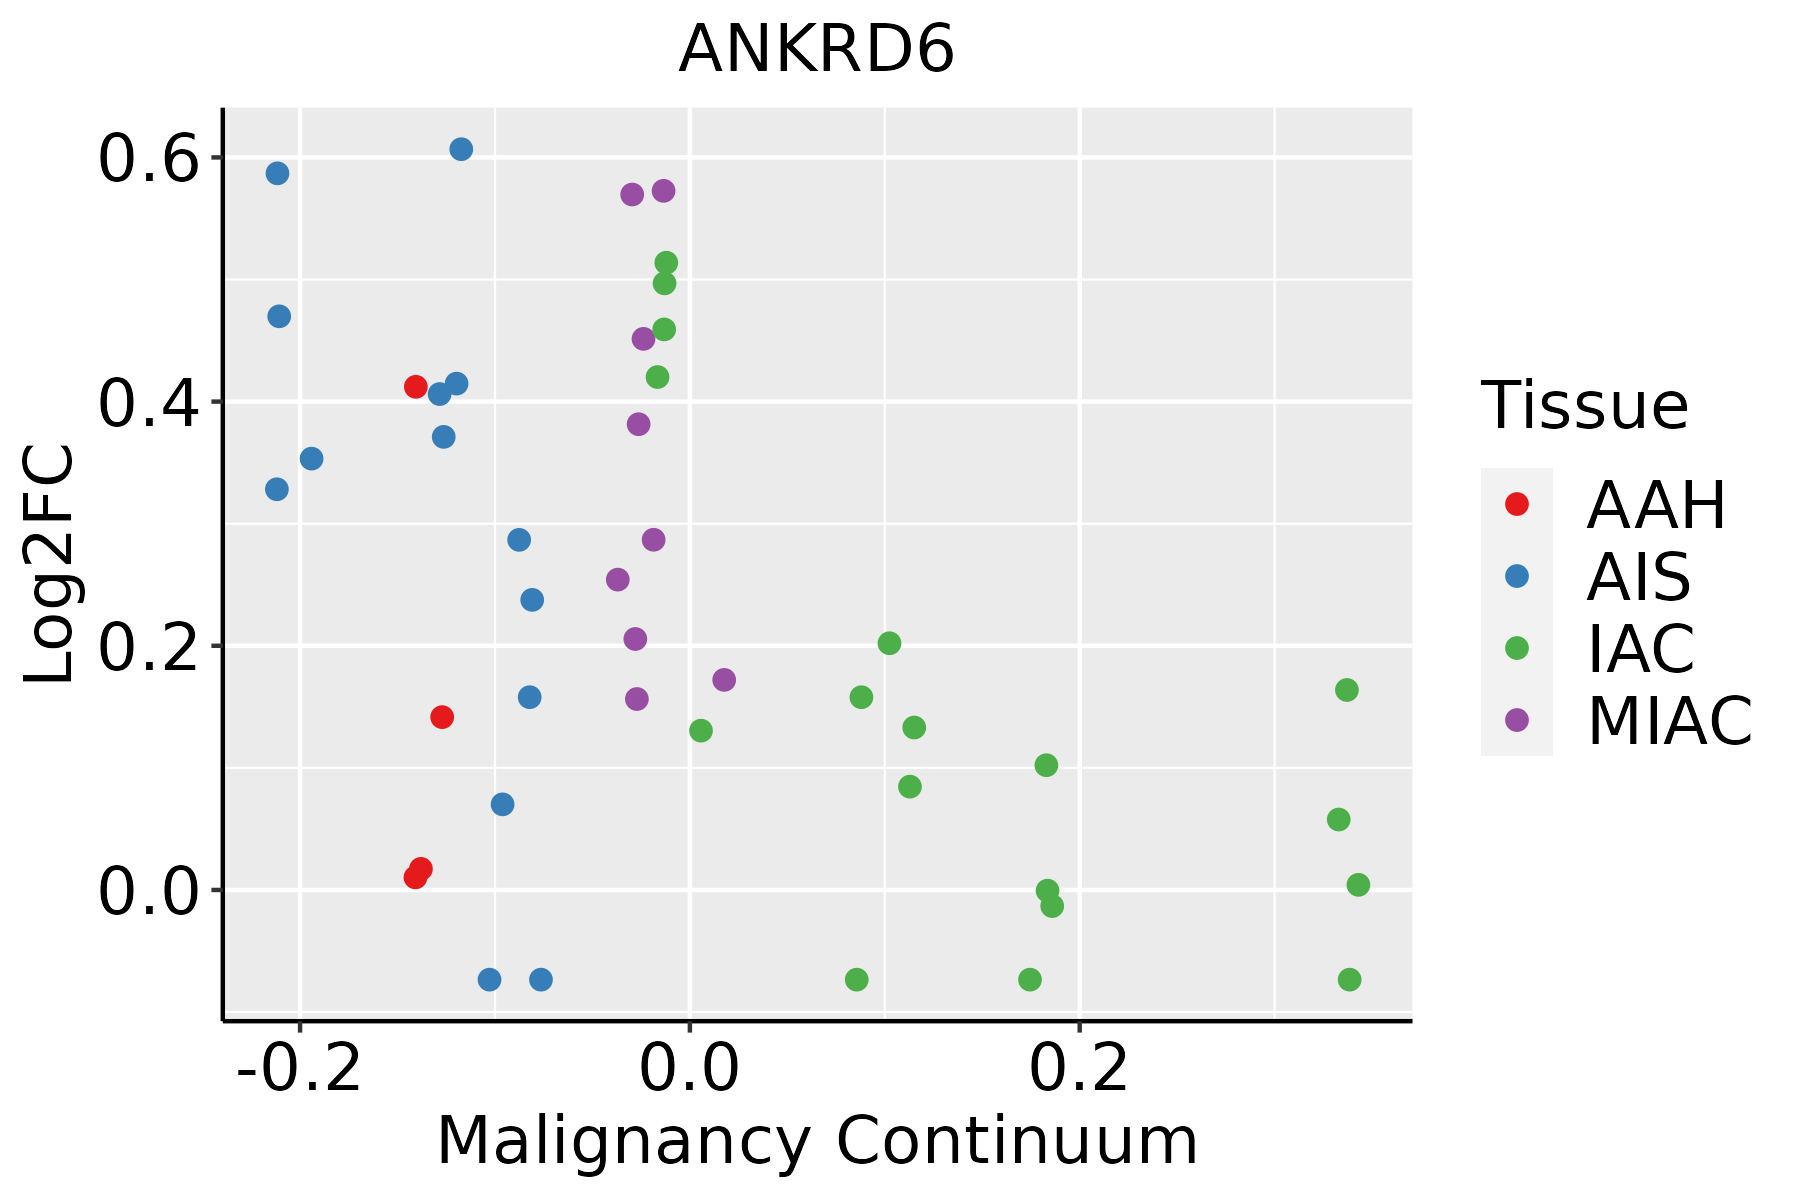 | AAH: Atypical adenomatous hyperplasia |
| AIS: Adenocarcinoma in situ |
| IAC: Invasive lung adenocarcinoma |
| MIA: Minimally invasive adenocarcinoma |
| GO ID | Tissue | Disease Stage | Description | Gene Ratio | Bg Ratio | pvalue | p.adjust | Count |
| GO:001605517 | Esophagus | ESCC | Wnt signaling pathway | 268/8552 | 444/18723 | 2.32e-10 | 6.58e-09 | 268 |
| GO:019873817 | Esophagus | ESCC | cell-cell signaling by wnt | 269/8552 | 446/18723 | 2.41e-10 | 6.79e-09 | 269 |
| GO:003109818 | Esophagus | ESCC | stress-activated protein kinase signaling cascade | 154/8552 | 247/18723 | 8.53e-08 | 1.44e-06 | 154 |
| GO:003011117 | Esophagus | ESCC | regulation of Wnt signaling pathway | 194/8552 | 328/18723 | 5.39e-07 | 7.14e-06 | 194 |
| GO:005140318 | Esophagus | ESCC | stress-activated MAPK cascade | 147/8552 | 239/18723 | 5.43e-07 | 7.18e-06 | 147 |
| GO:006007016 | Esophagus | ESCC | canonical Wnt signaling pathway | 180/8552 | 303/18723 | 9.15e-07 | 1.17e-05 | 180 |
| GO:006082817 | Esophagus | ESCC | regulation of canonical Wnt signaling pathway | 153/8552 | 253/18723 | 1.38e-06 | 1.67e-05 | 153 |
| GO:007030217 | Esophagus | ESCC | regulation of stress-activated protein kinase signaling cascade | 119/8552 | 195/18723 | 1.07e-05 | 1.01e-04 | 119 |
| GO:00017387 | Esophagus | ESCC | morphogenesis of a polarized epithelium | 63/8552 | 94/18723 | 2.34e-05 | 2.00e-04 | 63 |
| GO:003287217 | Esophagus | ESCC | regulation of stress-activated MAPK cascade | 116/8552 | 192/18723 | 2.63e-05 | 2.21e-04 | 116 |
| GO:00072549 | Esophagus | ESCC | JNK cascade | 102/8552 | 167/18723 | 4.22e-05 | 3.39e-04 | 102 |
| GO:003017716 | Esophagus | ESCC | positive regulation of Wnt signaling pathway | 87/8552 | 140/18723 | 6.18e-05 | 4.73e-04 | 87 |
| GO:00600714 | Esophagus | ESCC | Wnt signaling pathway, planar cell polarity pathway | 36/8552 | 52/18723 | 5.05e-04 | 2.79e-03 | 36 |
| GO:00463289 | Esophagus | ESCC | regulation of JNK cascade | 80/8552 | 133/18723 | 5.35e-04 | 2.95e-03 | 80 |
| GO:00901753 | Esophagus | ESCC | regulation of establishment of planar polarity | 37/8552 | 56/18723 | 1.65e-03 | 7.65e-03 | 37 |
| GO:00301788 | Esophagus | ESCC | negative regulation of Wnt signaling pathway | 97/8552 | 170/18723 | 1.81e-03 | 8.31e-03 | 97 |
| GO:00017361 | Esophagus | ESCC | establishment of planar polarity | 45/8552 | 72/18723 | 2.97e-03 | 1.24e-02 | 45 |
| GO:00071641 | Esophagus | ESCC | establishment of tissue polarity | 45/8552 | 72/18723 | 2.97e-03 | 1.24e-02 | 45 |
| GO:00355671 | Esophagus | ESCC | non-canonical Wnt signaling pathway | 45/8552 | 72/18723 | 2.97e-03 | 1.24e-02 | 45 |
| GO:00703046 | Esophagus | ESCC | positive regulation of stress-activated protein kinase signaling cascade | 74/8552 | 128/18723 | 3.77e-03 | 1.53e-02 | 74 |
| Hugo Symbol | Variant Class | Variant Classification | dbSNP RS | HGVSc | HGVSp | HGVSp Short | SWISSPROT | BIOTYPE | SIFT | PolyPhen | Tumor Sample Barcode | Tissue | Histology | Sex | Age | Stage | Therapy Types | Drugs | Outcome |
| ANKRD6 | SNV | Missense_Mutation | novel | c.943N>T | p.Ala315Ser | p.A315S | Q9Y2G4 | protein_coding | tolerated(0.79) | benign(0.013) | TCGA-A2-A25A-01 | Breast | breast invasive carcinoma | Female | <65 | I/II | Unspecific | Cytoxan | SD |
| ANKRD6 | SNV | Missense_Mutation | rs200296488 | c.1840N>A | p.Val614Ile | p.V614I | Q9Y2G4 | protein_coding | tolerated(0.5) | benign(0.003) | TCGA-A8-A08R-01 | Breast | breast invasive carcinoma | Female | <65 | I/II | Unknown | Unknown | SD |
| ANKRD6 | SNV | Missense_Mutation | | c.20T>C | p.Val7Ala | p.V7A | Q9Y2G4 | protein_coding | tolerated(0.08) | benign(0.027) | TCGA-BH-A0C7-01 | Breast | breast invasive carcinoma | Female | <65 | I/II | Chemotherapy | adriamycin | CR |
| ANKRD6 | SNV | Missense_Mutation | | c.32C>T | p.Ser11Leu | p.S11L | Q9Y2G4 | protein_coding | deleterious(0) | probably_damaging(0.994) | TCGA-D8-A1JA-01 | Breast | breast invasive carcinoma | Female | <65 | III/IV | Chemotherapy | adriamycin | PD |
| ANKRD6 | SNV | Missense_Mutation | | c.1607N>G | p.Ser536Cys | p.S536C | Q9Y2G4 | protein_coding | tolerated(0.08) | benign(0.315) | TCGA-E2-A14W-01 | Breast | breast invasive carcinoma | Male | >=65 | I/II | Chemotherapy | cytoxan | SD |
| ANKRD6 | SNV | Missense_Mutation | novel | c.142N>A | p.Leu48Ile | p.L48I | Q9Y2G4 | protein_coding | deleterious(0) | probably_damaging(0.999) | TCGA-E9-A2JT-01 | Breast | breast invasive carcinoma | Female | <65 | I/II | Hormone Therapy | tamoxiphen | SD |
| ANKRD6 | insertion | Nonsense_Mutation | novel | c.1210_1211insGGCTAACATCAGACATAAGGTGAATGTGCTGATATATTTCT | p.Val404GlyfsTer8 | p.V404Gfs*8 | Q9Y2G4 | protein_coding | | | TCGA-A7-A0CJ-01 | Breast | breast invasive carcinoma | Female | <65 | I/II | Chemotherapy | cytoxan | SD |
| ANKRD6 | insertion | Nonsense_Mutation | novel | c.1853_1854insGACTGTGTGAATGTGGATTTGCTCTCACGT | p.Thr618_Gln619insThrValTerMetTrpIleCysSerHisVal | p.T618_Q619insTV*MWICSHV | Q9Y2G4 | protein_coding | | | TCGA-AN-A0FS-01 | Breast | breast invasive carcinoma | Female | <65 | I/II | Unknown | Unknown | SD |
| ANKRD6 | insertion | In_Frame_Ins | novel | c.1343_1344insCCTTATGACATACTTGGTGCTGGGTCTTATTCTCCATCT | p.Gly448_Gln449insLeuMetThrTyrLeuValLeuGlyLeuIleLeuHisLeu | p.G448_Q449insLMTYLVLGLILHL | Q9Y2G4 | protein_coding | | | TCGA-AQ-A04J-01 | Breast | breast invasive carcinoma | Female | <65 | I/II | Chemotherapy | cytoxan | SD |
| ANKRD6 | deletion | Frame_Shift_Del | | c.1475delN | p.Glu492GlyfsTer11 | p.E492Gfs*11 | Q9Y2G4 | protein_coding | | | TCGA-B6-A0IJ-01 | Breast | breast invasive carcinoma | Female | <65 | I/II | Unknown | Unknown | SD |


