
|
|||||
|
 | |
| |
| |
| |
| |
| |
|
Gene: ANKRD54 |
Gene summary for ANKRD54 |
| Gene information | Species | Human | Gene symbol | ANKRD54 | Gene ID | 129138 |
| Gene name | ankyrin repeat domain 54 | |
| Gene Alias | LIAR | |
| Cytomap | 22q13.1 | |
| Gene Type | protein-coding | GO ID | GO:0001932 | UniProtAcc | Q6NXT1 |
Top |
Malignant transformation analysis |
| Identification of the aberrant gene expression in precancerous and cancerous lesions by comparing the gene expression of stem-like cells in diseased tissues with normal stem cells |
| Entrez ID | Symbol | Replicates | Species | Organ | Tissue | Adj P-value | Log2FC | Malignancy |
| 129138 | ANKRD54 | LZE4T | Human | Esophagus | ESCC | 3.86e-02 | 1.35e-01 | 0.0811 |
| 129138 | ANKRD54 | LZE24T | Human | Esophagus | ESCC | 7.22e-17 | 4.37e-01 | 0.0596 |
| 129138 | ANKRD54 | LZE6T | Human | Esophagus | ESCC | 3.95e-03 | 1.25e-01 | 0.0845 |
| 129138 | ANKRD54 | P1T-E | Human | Esophagus | ESCC | 2.16e-08 | 3.35e-01 | 0.0875 |
| 129138 | ANKRD54 | P2T-E | Human | Esophagus | ESCC | 1.70e-25 | 4.08e-01 | 0.1177 |
| 129138 | ANKRD54 | P4T-E | Human | Esophagus | ESCC | 7.06e-20 | 3.62e-01 | 0.1323 |
| 129138 | ANKRD54 | P5T-E | Human | Esophagus | ESCC | 6.57e-18 | 3.40e-01 | 0.1327 |
| 129138 | ANKRD54 | P8T-E | Human | Esophagus | ESCC | 4.17e-16 | 2.26e-01 | 0.0889 |
| 129138 | ANKRD54 | P9T-E | Human | Esophagus | ESCC | 6.11e-09 | 1.55e-01 | 0.1131 |
| 129138 | ANKRD54 | P10T-E | Human | Esophagus | ESCC | 9.74e-27 | 4.89e-01 | 0.116 |
| 129138 | ANKRD54 | P11T-E | Human | Esophagus | ESCC | 3.47e-17 | 5.49e-01 | 0.1426 |
| 129138 | ANKRD54 | P12T-E | Human | Esophagus | ESCC | 1.26e-20 | 4.04e-01 | 0.1122 |
| 129138 | ANKRD54 | P15T-E | Human | Esophagus | ESCC | 5.02e-23 | 4.70e-01 | 0.1149 |
| 129138 | ANKRD54 | P16T-E | Human | Esophagus | ESCC | 2.76e-47 | 7.54e-01 | 0.1153 |
| 129138 | ANKRD54 | P17T-E | Human | Esophagus | ESCC | 9.52e-11 | 3.82e-01 | 0.1278 |
| 129138 | ANKRD54 | P19T-E | Human | Esophagus | ESCC | 6.84e-07 | 4.44e-01 | 0.1662 |
| 129138 | ANKRD54 | P20T-E | Human | Esophagus | ESCC | 1.28e-17 | 4.11e-01 | 0.1124 |
| 129138 | ANKRD54 | P21T-E | Human | Esophagus | ESCC | 2.98e-36 | 6.53e-01 | 0.1617 |
| 129138 | ANKRD54 | P22T-E | Human | Esophagus | ESCC | 5.23e-30 | 4.89e-01 | 0.1236 |
| 129138 | ANKRD54 | P23T-E | Human | Esophagus | ESCC | 1.18e-20 | 5.13e-01 | 0.108 |
| Page: 1 2 3 4 5 |
| Tissue | Expression Dynamics | Abbreviation |
| Esophagus | 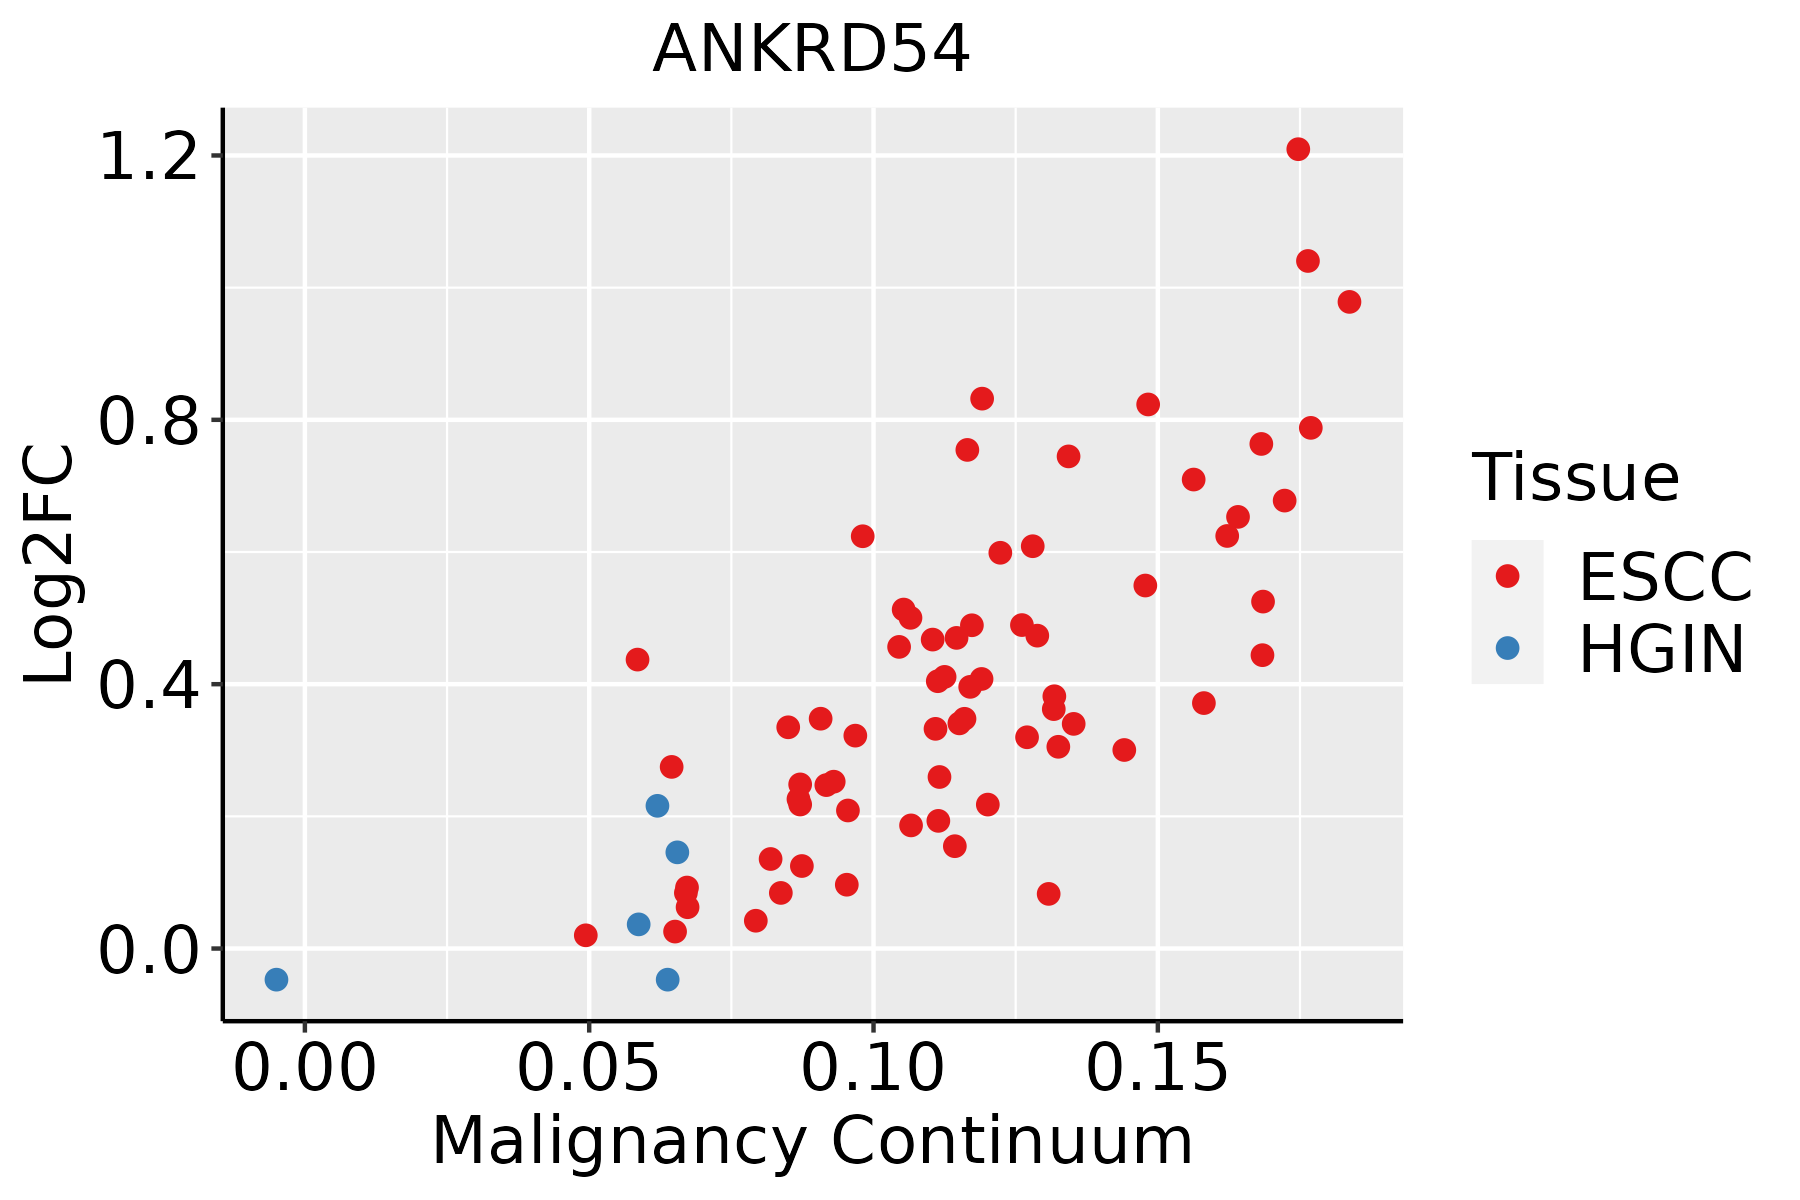 | ESCC: Esophageal squamous cell carcinoma |
| HGIN: High-grade intraepithelial neoplasias | ||
| LGIN: Low-grade intraepithelial neoplasias | ||
| Liver |  | HCC: Hepatocellular carcinoma |
| NAFLD: Non-alcoholic fatty liver disease | ||
| Oral Cavity | 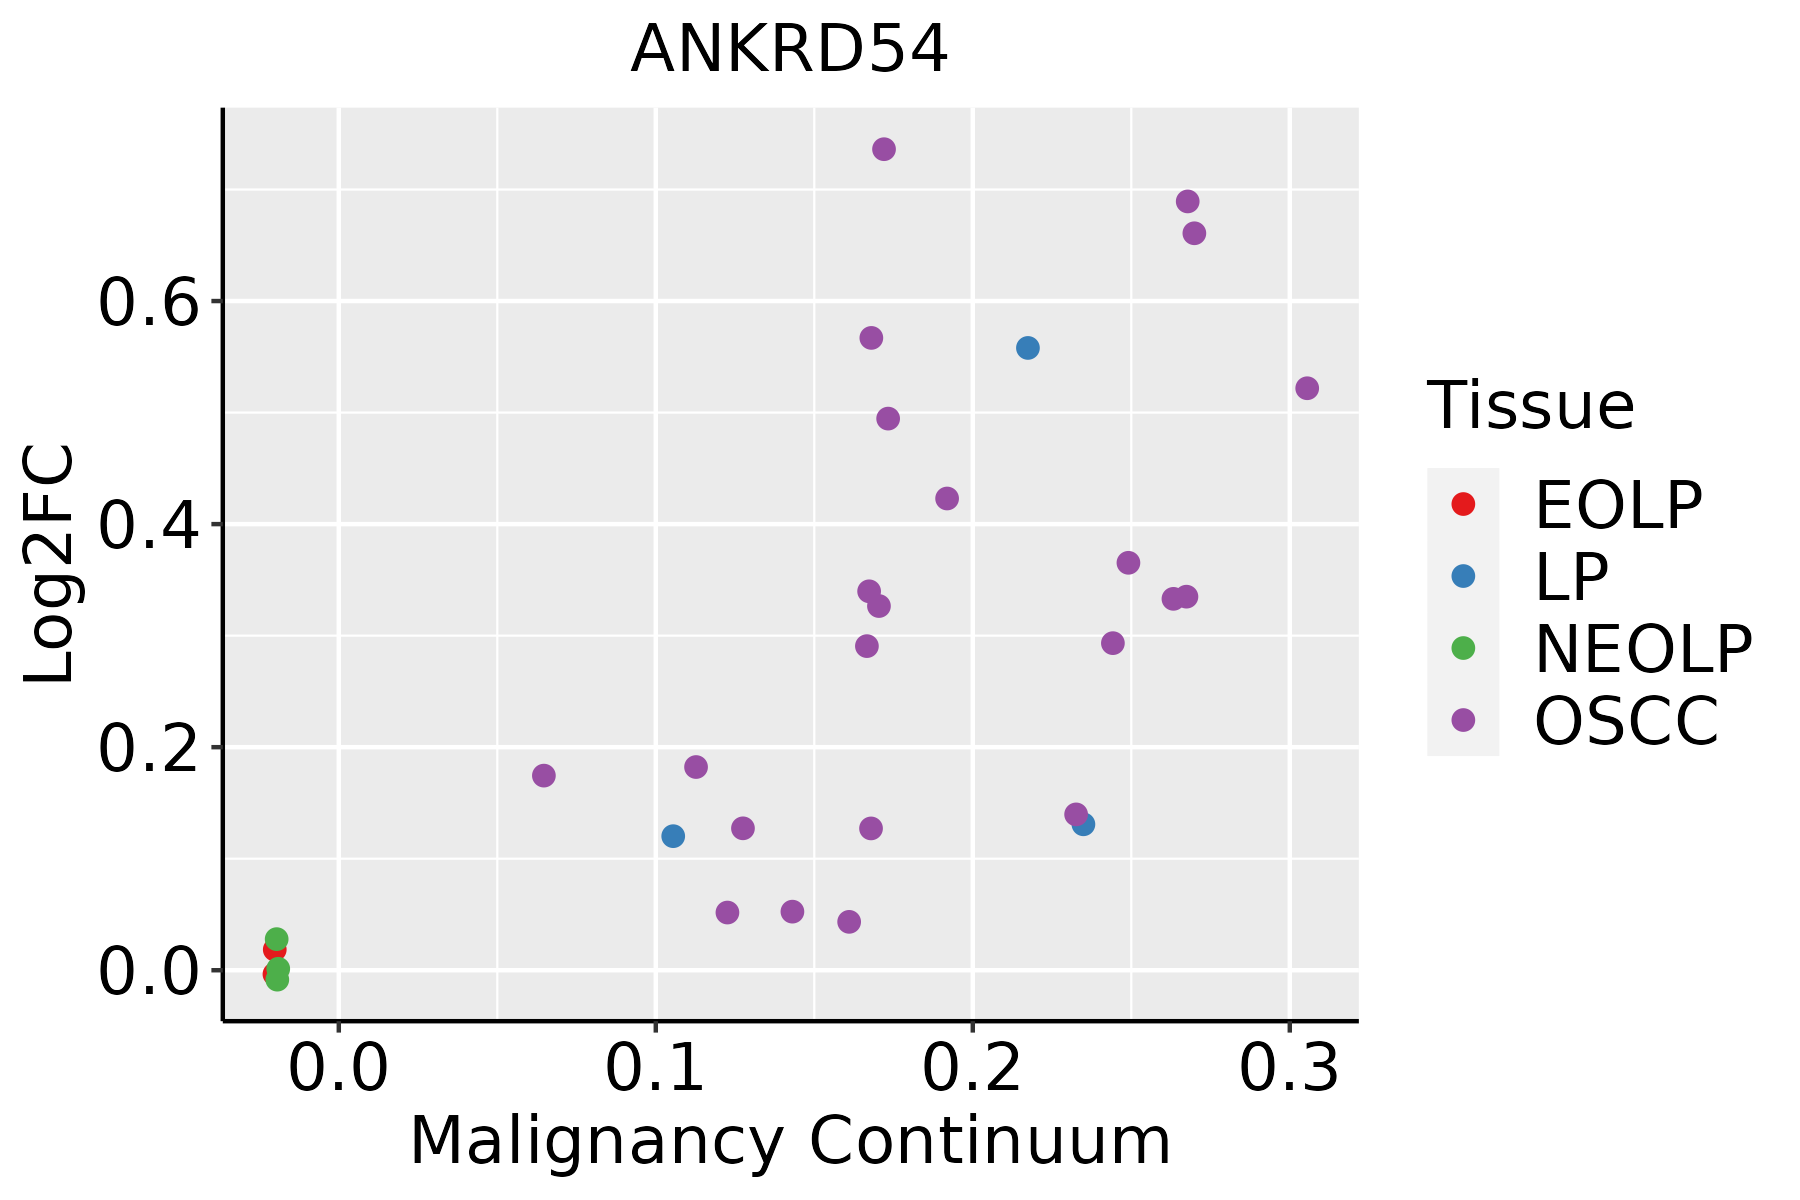 | EOLP: Erosive Oral lichen planus |
| LP: leukoplakia | ||
| NEOLP: Non-erosive oral lichen planus | ||
| OSCC: Oral squamous cell carcinoma |
| ∗log2FC in expression of this searched gene in stem-like cells from each diseased tissue sample relative to stem-like cells in normal samples in each tissue plotted against the malignancy continuum. Samples are colored based on if they are from different disease stage. |
Top |
Malignant transformation related pathway analysis |
| Find out the enriched GO biological processes and KEGG pathways involved in transition from healthy to precancer to cancer |
| Tissue | Disease Stage | Enriched GO biological Processes |
| Colorectum | AD |  |
| Colorectum | SER |  |
| Colorectum | MSS |  |
| Colorectum | MSI-H |  |
| Colorectum | FAP |  |
| ∗Top 15 enriched GO BP terms are showed in the bar plot of each disease state in each tissue. Each row represents a significant GO biological process which is colored according to the -log10(p.adjust). |
| Page: 1 2 3 4 5 6 7 8 9 |
| GO ID | Tissue | Disease Stage | Description | Gene Ratio | Bg Ratio | pvalue | p.adjust | Count |
| GO:0006913110 | Esophagus | ESCC | nucleocytoplasmic transport | 230/8552 | 301/18723 | 6.04e-28 | 2.02e-25 | 230 |
| GO:0051169110 | Esophagus | ESCC | nuclear transport | 230/8552 | 301/18723 | 6.04e-28 | 2.02e-25 | 230 |
| GO:0030099111 | Esophagus | ESCC | myeloid cell differentiation | 232/8552 | 381/18723 | 1.22e-09 | 2.90e-08 | 232 |
| GO:0002262111 | Esophagus | ESCC | myeloid cell homeostasis | 104/8552 | 157/18723 | 1.49e-07 | 2.36e-06 | 104 |
| GO:0034101111 | Esophagus | ESCC | erythrocyte homeostasis | 88/8552 | 129/18723 | 1.81e-07 | 2.84e-06 | 88 |
| GO:0048872111 | Esophagus | ESCC | homeostasis of number of cells | 163/8552 | 272/18723 | 1.40e-06 | 1.69e-05 | 163 |
| GO:0030218111 | Esophagus | ESCC | erythrocyte differentiation | 80/8552 | 120/18723 | 2.69e-06 | 3.08e-05 | 80 |
| GO:1903706110 | Esophagus | ESCC | regulation of hemopoiesis | 201/8552 | 367/18723 | 2.60e-04 | 1.58e-03 | 201 |
| GO:004563918 | Esophagus | ESCC | positive regulation of myeloid cell differentiation | 64/8552 | 103/18723 | 5.54e-04 | 3.03e-03 | 64 |
| GO:0045637111 | Esophagus | ESCC | regulation of myeloid cell differentiation | 118/8552 | 210/18723 | 1.35e-03 | 6.43e-03 | 118 |
| GO:004564619 | Esophagus | ESCC | regulation of erythrocyte differentiation | 32/8552 | 47/18723 | 1.59e-03 | 7.43e-03 | 32 |
| GO:000691322 | Liver | HCC | nucleocytoplasmic transport | 208/7958 | 301/18723 | 5.51e-21 | 8.12e-19 | 208 |
| GO:005116922 | Liver | HCC | nuclear transport | 208/7958 | 301/18723 | 5.51e-21 | 8.12e-19 | 208 |
| GO:003410122 | Liver | HCC | erythrocyte homeostasis | 79/7958 | 129/18723 | 1.32e-05 | 1.47e-04 | 79 |
| GO:000226222 | Liver | HCC | myeloid cell homeostasis | 93/7958 | 157/18723 | 1.67e-05 | 1.81e-04 | 93 |
| GO:003021812 | Liver | HCC | erythrocyte differentiation | 73/7958 | 120/18723 | 3.82e-05 | 3.80e-04 | 73 |
| GO:003009922 | Liver | HCC | myeloid cell differentiation | 200/7958 | 381/18723 | 4.64e-05 | 4.49e-04 | 200 |
| GO:004887222 | Liver | HCC | homeostasis of number of cells | 147/7958 | 272/18723 | 7.48e-05 | 6.70e-04 | 147 |
| GO:00456465 | Liver | HCC | regulation of erythrocyte differentiation | 28/7958 | 47/18723 | 1.36e-02 | 4.83e-02 | 28 |
| GO:000691317 | Oral cavity | OSCC | nucleocytoplasmic transport | 204/7305 | 301/18723 | 2.65e-24 | 6.98e-22 | 204 |
| Page: 1 2 |
| Pathway ID | Tissue | Disease Stage | Description | Gene Ratio | Bg Ratio | pvalue | p.adjust | qvalue | Count |
| Page: 1 |
Top |
Cell-cell communication analysis |
| Identification of potential cell-cell interactions between two cell types and their ligand-receptor pairs for different disease states |
| Ligand | Receptor | LRpair | Pathway | Tissue | Disease Stage |
| Page: 1 |
Top |
Single-cell gene regulatory network inference analysis |
| Find out the significant the regulons (TFs) and the target genes of each regulon across cell types for different disease states |
| TF | Cell Type | Tissue | Disease Stage | Target Gene | RSS | Regulon Activity |
| ∗The dot plots of a searched regulon are shown for all cell subpopulations in each disease state of each tissue based on the regulon specific score inferred using pySCENIC and by calculating the average expression. |
| Page: 1 |
Top |
Somatic mutation of malignant transformation related genes |
| Annotation of somatic variants for genes involved in malignant transformation |
| Hugo Symbol | Variant Class | Variant Classification | dbSNP RS | HGVSc | HGVSp | HGVSp Short | SWISSPROT | BIOTYPE | SIFT | PolyPhen | Tumor Sample Barcode | Tissue | Histology | Sex | Age | Stage | Therapy Types | Drugs | Outcome |
| ANKRD54 | insertion | Frame_Shift_Ins | novel | c.334_335insCATTTACTTTTTGT | p.Lys112ThrfsTer8 | p.K112Tfs*8 | Q6NXT1 | protein_coding | TCGA-A8-A06P-01 | Breast | breast invasive carcinoma | Female | <65 | III/IV | Unspecific | SD | |||
| ANKRD54 | insertion | Nonsense_Mutation | novel | c.712_713insCTTCAAAGCCTCCGTTCACTTCCTTTGAAGTTGCCAGTGGCTAGT | p.Val238delinsAlaSerLysProProPheThrSerPheGluValAlaSerGlyTerLeu | p.V238delinsASKPPFTSFEVASG*L | Q6NXT1 | protein_coding | TCGA-A8-A0A1-01 | Breast | breast invasive carcinoma | Female | >=65 | I/II | Hormone Therapy | tamoxiphen | SD | ||
| ANKRD54 | SNV | Missense_Mutation | novel | c.729N>G | p.His243Gln | p.H243Q | Q6NXT1 | protein_coding | tolerated(1) | benign(0.001) | TCGA-2W-A8YY-01 | Cervix | cervical & endocervical cancer | Female | <65 | I/II | Chemotherapy | cisplatin | CR |
| ANKRD54 | SNV | Missense_Mutation | rs776362092 | c.847N>G | p.Leu283Val | p.L283V | Q6NXT1 | protein_coding | deleterious(0) | probably_damaging(0.987) | TCGA-IR-A3LA-01 | Cervix | cervical & endocervical cancer | Female | <65 | I/II | Chemotherapy | cisplatin | CR |
| ANKRD54 | SNV | Missense_Mutation | novel | c.485N>C | p.Leu162Pro | p.L162P | Q6NXT1 | protein_coding | deleterious(0) | probably_damaging(1) | TCGA-EI-6511-01 | Colorectum | rectum adenocarcinoma | Male | <65 | III/IV | Chemotherapy | oxaliplatinum+5-fu | SD |
| ANKRD54 | SNV | Missense_Mutation | novel | c.626N>A | p.Gly209Asp | p.G209D | Q6NXT1 | protein_coding | deleterious(0) | probably_damaging(0.994) | TCGA-A5-A0G1-01 | Endometrium | uterine corpus endometrioid carcinoma | Female | >=65 | I/II | Unknown | Unknown | SD |
| ANKRD54 | SNV | Missense_Mutation | novel | c.341N>C | p.Leu114Pro | p.L114P | Q6NXT1 | protein_coding | deleterious(0) | probably_damaging(0.993) | TCGA-AP-A1DK-01 | Endometrium | uterine corpus endometrioid carcinoma | Female | <65 | I/II | Unknown | Unknown | SD |
| ANKRD54 | SNV | Missense_Mutation | novel | c.403N>T | p.Asp135Tyr | p.D135Y | Q6NXT1 | protein_coding | deleterious(0) | probably_damaging(0.999) | TCGA-B5-A3FA-01 | Endometrium | uterine corpus endometrioid carcinoma | Female | >=65 | I/II | Unknown | Unknown | SD |
| ANKRD54 | SNV | Missense_Mutation | rs763605893 | c.620N>A | p.Arg207Gln | p.R207Q | Q6NXT1 | protein_coding | deleterious(0.04) | possibly_damaging(0.876) | TCGA-B5-A3FC-01 | Endometrium | uterine corpus endometrioid carcinoma | Female | <65 | I/II | Unknown | Unknown | SD |
| ANKRD54 | SNV | Missense_Mutation | novel | c.745N>A | p.Leu249Met | p.L249M | Q6NXT1 | protein_coding | tolerated(0.05) | probably_damaging(0.974) | TCGA-BS-A0UF-01 | Endometrium | uterine corpus endometrioid carcinoma | Female | >=65 | I/II | Unknown | Unknown | SD |
| Page: 1 2 |
Top |
Related drugs of malignant transformation related genes |
| Identification of chemicals and drugs interact with genes involved in malignant transfromation |
| (DGIdb 4.0) |
| Entrez ID | Symbol | Category | Interaction Types | Drug Claim Name | Drug Name | PMIDs |
| Page: 1 |

Copyright 2023-Present -The University of Texas Health Science Center at Houston |