
|
|||||
|
 | |
| |
| |
| |
| |
| |
|
Gene: ANKRD50 |
Gene summary for ANKRD50 |
| Gene information | Species | Human | Gene symbol | ANKRD50 | Gene ID | 57182 |
| Gene name | ankyrin repeat domain 50 | |
| Gene Alias | ANKRD50 | |
| Cytomap | 4q28.1 | |
| Gene Type | protein-coding | GO ID | GO:0006810 | UniProtAcc | Q8TB46 |
Top |
Malignant transformation analysis |
| Identification of the aberrant gene expression in precancerous and cancerous lesions by comparing the gene expression of stem-like cells in diseased tissues with normal stem cells |
| Entrez ID | Symbol | Replicates | Species | Organ | Tissue | Adj P-value | Log2FC | Malignancy |
| 57182 | ANKRD50 | LZE4T | Human | Esophagus | ESCC | 1.18e-05 | 2.19e-01 | 0.0811 |
| 57182 | ANKRD50 | LZE5T | Human | Esophagus | ESCC | 4.10e-02 | 5.35e-01 | 0.0514 |
| 57182 | ANKRD50 | LZE8T | Human | Esophagus | ESCC | 1.12e-06 | 2.40e-01 | 0.067 |
| 57182 | ANKRD50 | LZE24T | Human | Esophagus | ESCC | 4.09e-08 | 1.62e-01 | 0.0596 |
| 57182 | ANKRD50 | P1T-E | Human | Esophagus | ESCC | 1.53e-02 | 2.65e-01 | 0.0875 |
| 57182 | ANKRD50 | P2T-E | Human | Esophagus | ESCC | 3.01e-16 | 1.50e-01 | 0.1177 |
| 57182 | ANKRD50 | P4T-E | Human | Esophagus | ESCC | 1.01e-13 | 2.17e-01 | 0.1323 |
| 57182 | ANKRD50 | P5T-E | Human | Esophagus | ESCC | 2.34e-05 | -1.43e-04 | 0.1327 |
| 57182 | ANKRD50 | P8T-E | Human | Esophagus | ESCC | 3.50e-12 | 2.56e-01 | 0.0889 |
| 57182 | ANKRD50 | P9T-E | Human | Esophagus | ESCC | 3.04e-06 | 5.87e-02 | 0.1131 |
| 57182 | ANKRD50 | P10T-E | Human | Esophagus | ESCC | 1.39e-10 | 1.14e-01 | 0.116 |
| 57182 | ANKRD50 | P11T-E | Human | Esophagus | ESCC | 1.43e-02 | 1.77e-01 | 0.1426 |
| 57182 | ANKRD50 | P12T-E | Human | Esophagus | ESCC | 3.29e-19 | 4.77e-01 | 0.1122 |
| 57182 | ANKRD50 | P15T-E | Human | Esophagus | ESCC | 2.75e-15 | 2.79e-01 | 0.1149 |
| 57182 | ANKRD50 | P16T-E | Human | Esophagus | ESCC | 1.19e-06 | 7.61e-02 | 0.1153 |
| 57182 | ANKRD50 | P20T-E | Human | Esophagus | ESCC | 4.40e-07 | 6.07e-02 | 0.1124 |
| 57182 | ANKRD50 | P21T-E | Human | Esophagus | ESCC | 1.07e-08 | 8.52e-02 | 0.1617 |
| 57182 | ANKRD50 | P22T-E | Human | Esophagus | ESCC | 3.91e-25 | 3.51e-01 | 0.1236 |
| 57182 | ANKRD50 | P23T-E | Human | Esophagus | ESCC | 1.20e-07 | 1.67e-01 | 0.108 |
| 57182 | ANKRD50 | P24T-E | Human | Esophagus | ESCC | 2.75e-03 | 9.14e-03 | 0.1287 |
| Page: 1 2 3 4 |
| Tissue | Expression Dynamics | Abbreviation |
| Esophagus | 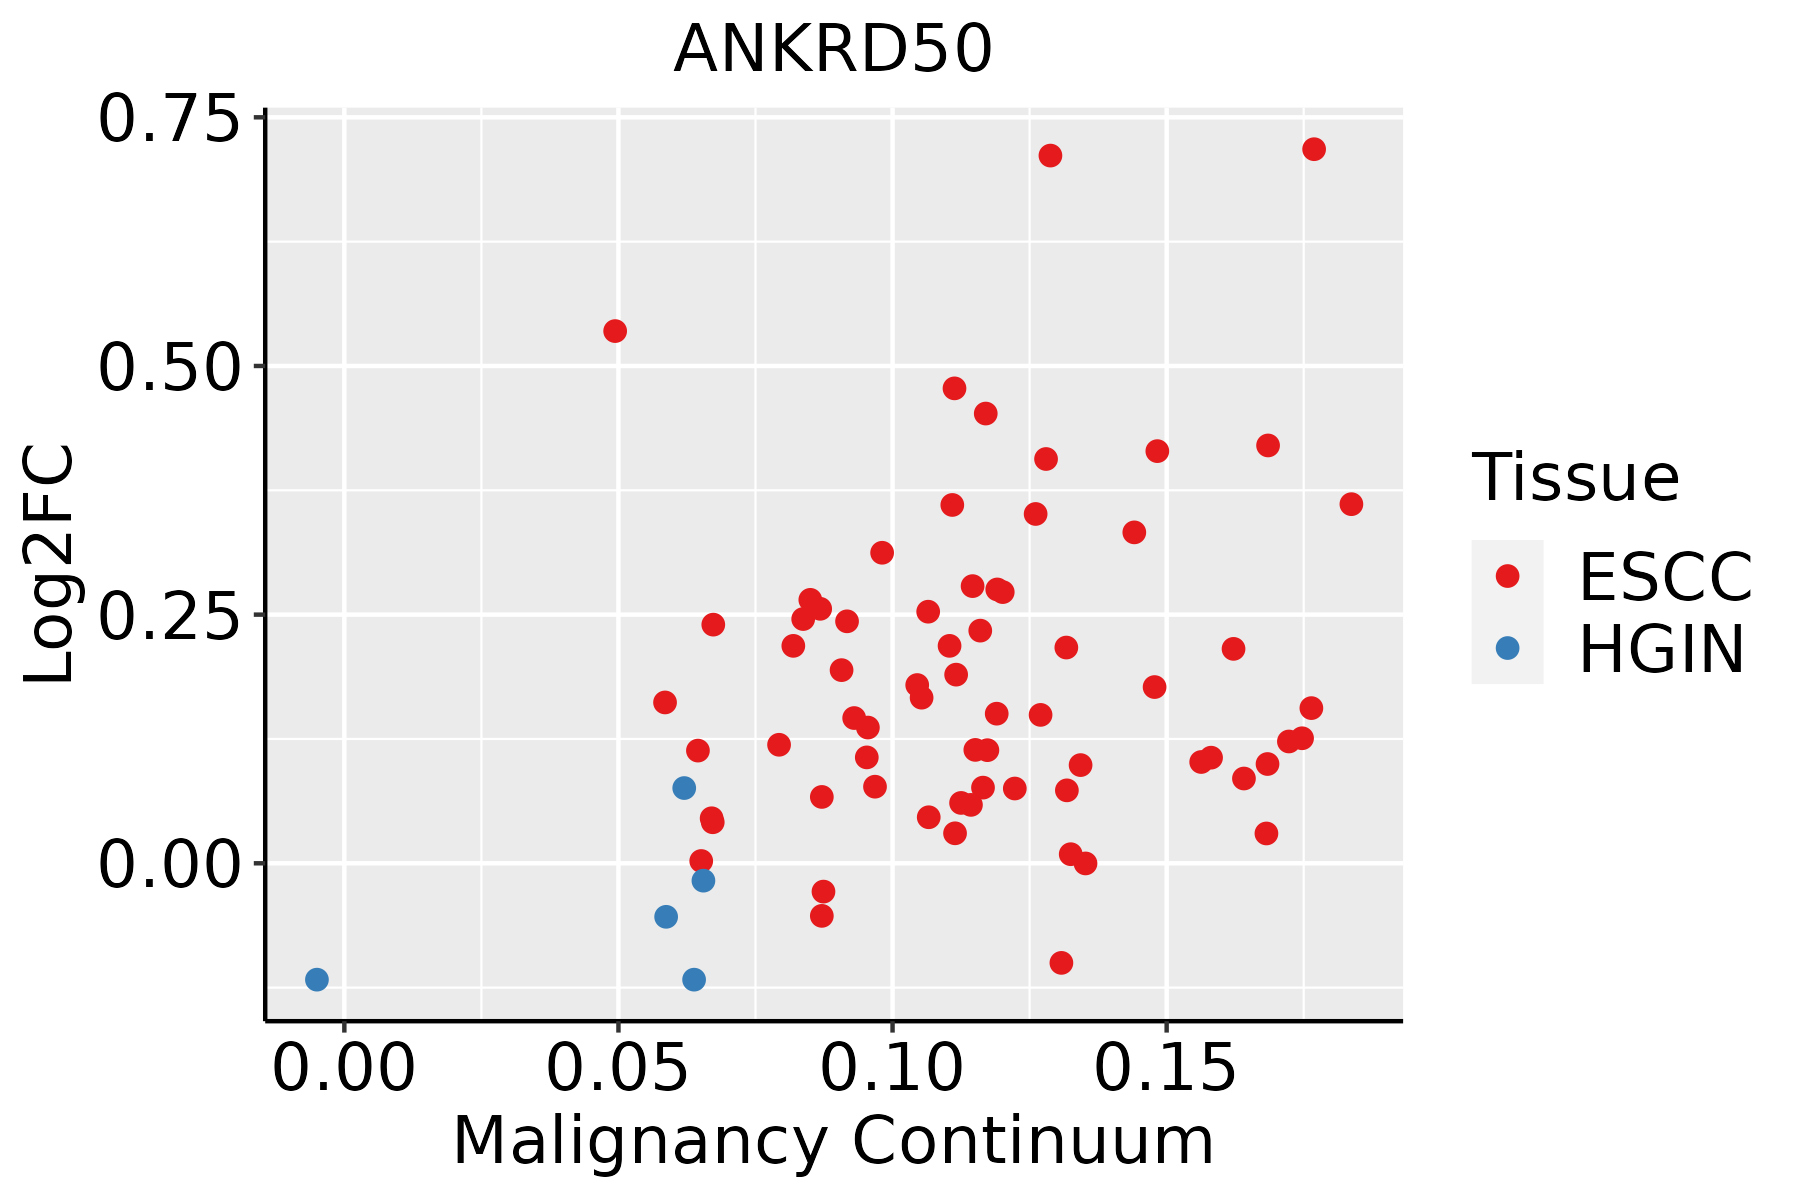 | ESCC: Esophageal squamous cell carcinoma |
| HGIN: High-grade intraepithelial neoplasias | ||
| LGIN: Low-grade intraepithelial neoplasias | ||
| Prostate | 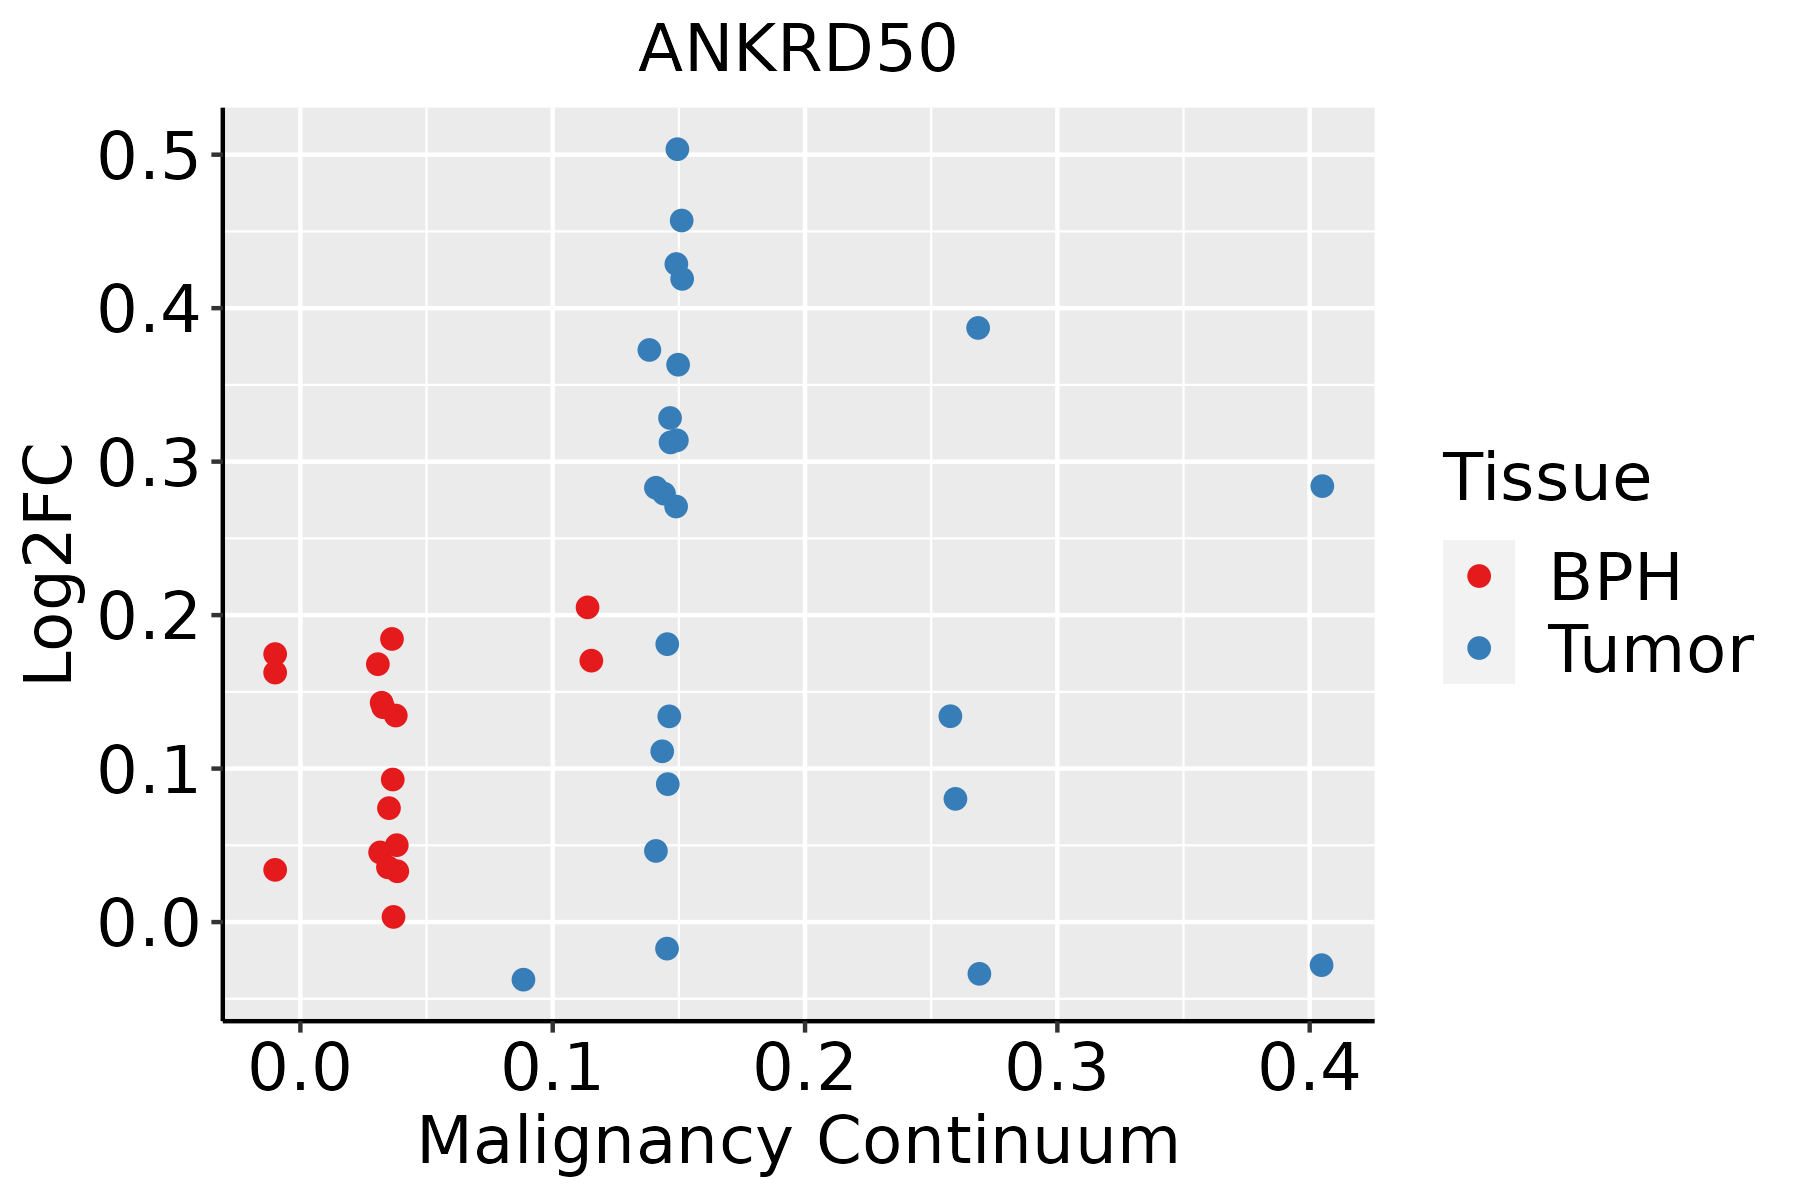 | BPH: Benign Prostatic Hyperplasia |
| ∗log2FC in expression of this searched gene in stem-like cells from each diseased tissue sample relative to stem-like cells in normal samples in each tissue plotted against the malignancy continuum. Samples are colored based on if they are from different disease stage. |
Top |
Malignant transformation related pathway analysis |
| Find out the enriched GO biological processes and KEGG pathways involved in transition from healthy to precancer to cancer |
| Tissue | Disease Stage | Enriched GO biological Processes |
| Colorectum | AD |  |
| Colorectum | SER |  |
| Colorectum | MSS |  |
| Colorectum | MSI-H |  |
| Colorectum | FAP |  |
| ∗Top 15 enriched GO BP terms are showed in the bar plot of each disease state in each tissue. Each row represents a significant GO biological process which is colored according to the -log10(p.adjust). |
| Page: 1 2 3 4 5 6 7 8 9 |
| GO ID | Tissue | Disease Stage | Description | Gene Ratio | Bg Ratio | pvalue | p.adjust | Count |
| GO:001619715 | Esophagus | ESCC | endosomal transport | 168/8552 | 230/18723 | 2.28e-17 | 1.93e-15 | 168 |
| GO:009887615 | Esophagus | ESCC | vesicle-mediated transport to the plasma membrane | 99/8552 | 136/18723 | 1.13e-10 | 3.39e-09 | 99 |
| GO:00324565 | Esophagus | ESCC | endocytic recycling | 51/8552 | 73/18723 | 2.47e-05 | 2.10e-04 | 51 |
| GO:00988768 | Prostate | BPH | vesicle-mediated transport to the plasma membrane | 43/3107 | 136/18723 | 1.11e-05 | 1.51e-04 | 43 |
| GO:00161978 | Prostate | BPH | endosomal transport | 62/3107 | 230/18723 | 4.54e-05 | 4.77e-04 | 62 |
| GO:00324563 | Prostate | BPH | endocytic recycling | 21/3107 | 73/18723 | 6.45e-03 | 2.91e-02 | 21 |
| GO:009887613 | Prostate | Tumor | vesicle-mediated transport to the plasma membrane | 42/3246 | 136/18723 | 7.47e-05 | 7.84e-04 | 42 |
| GO:001619713 | Prostate | Tumor | endosomal transport | 62/3246 | 230/18723 | 1.65e-04 | 1.47e-03 | 62 |
| Page: 1 |
| Pathway ID | Tissue | Disease Stage | Description | Gene Ratio | Bg Ratio | pvalue | p.adjust | qvalue | Count |
| Page: 1 |
Top |
Cell-cell communication analysis |
| Identification of potential cell-cell interactions between two cell types and their ligand-receptor pairs for different disease states |
| Ligand | Receptor | LRpair | Pathway | Tissue | Disease Stage |
| Page: 1 |
Top |
Single-cell gene regulatory network inference analysis |
| Find out the significant the regulons (TFs) and the target genes of each regulon across cell types for different disease states |
| TF | Cell Type | Tissue | Disease Stage | Target Gene | RSS | Regulon Activity |
| ∗The dot plots of a searched regulon are shown for all cell subpopulations in each disease state of each tissue based on the regulon specific score inferred using pySCENIC and by calculating the average expression. |
| Page: 1 |
Top |
Somatic mutation of malignant transformation related genes |
| Annotation of somatic variants for genes involved in malignant transformation |
| Hugo Symbol | Variant Class | Variant Classification | dbSNP RS | HGVSc | HGVSp | HGVSp Short | SWISSPROT | BIOTYPE | SIFT | PolyPhen | Tumor Sample Barcode | Tissue | Histology | Sex | Age | Stage | Therapy Types | Drugs | Outcome |
| ANKRD50 | SNV | Missense_Mutation | c.251C>G | p.Thr84Arg | p.T84R | Q9ULJ7 | protein_coding | deleterious(0) | probably_damaging(0.97) | TCGA-A2-A0T0-01 | Breast | breast invasive carcinoma | Female | <65 | I/II | Chemotherapy | taxotere | SD | |
| ANKRD50 | SNV | Missense_Mutation | c.1072C>A | p.Leu358Ile | p.L358I | Q9ULJ7 | protein_coding | deleterious(0.01) | probably_damaging(0.973) | TCGA-AN-A046-01 | Breast | breast invasive carcinoma | Female | >=65 | I/II | Unknown | Unknown | SD | |
| ANKRD50 | SNV | Missense_Mutation | novel | c.3895T>C | p.Tyr1299His | p.Y1299H | Q9ULJ7 | protein_coding | tolerated_low_confidence(0.53) | probably_damaging(0.987) | TCGA-AR-A0U0-01 | Breast | breast invasive carcinoma | Female | >=65 | I/II | Unknown | Unknown | SD |
| ANKRD50 | SNV | Missense_Mutation | novel | c.3893A>T | p.Glu1298Val | p.E1298V | Q9ULJ7 | protein_coding | tolerated_low_confidence(0.06) | possibly_damaging(0.5) | TCGA-AR-A0U0-01 | Breast | breast invasive carcinoma | Female | >=65 | I/II | Unknown | Unknown | SD |
| ANKRD50 | SNV | Missense_Mutation | rs759373215 | c.1312N>G | p.Met438Val | p.M438V | Q9ULJ7 | protein_coding | deleterious(0.02) | benign(0.339) | TCGA-BH-A0DL-01 | Breast | breast invasive carcinoma | Female | <65 | I/II | Chemotherapy | cytoxan | CR |
| ANKRD50 | SNV | Missense_Mutation | novel | c.4073N>T | p.Arg1358Ile | p.R1358I | Q9ULJ7 | protein_coding | deleterious(0.02) | probably_damaging(0.979) | TCGA-D8-A1JG-01 | Breast | breast invasive carcinoma | Female | <65 | I/II | Chemotherapy | doxorubicin | SD |
| ANKRD50 | SNV | Missense_Mutation | novel | c.3572N>G | p.Ser1191Cys | p.S1191C | Q9ULJ7 | protein_coding | deleterious(0.01) | probably_damaging(0.99) | TCGA-D8-A27V-01 | Breast | breast invasive carcinoma | Female | <65 | I/II | Hormone Therapy | tamoxiphen | SD |
| ANKRD50 | insertion | Frame_Shift_Ins | novel | c.2474_2475insTTTTAAAATGATATGTAGCTGTATAATACAATGTAGA | p.Asn826PhefsTer15 | p.N826Ffs*15 | Q9ULJ7 | protein_coding | TCGA-A8-A06P-01 | Breast | breast invasive carcinoma | Female | <65 | III/IV | Unspecific | SD | |||
| ANKRD50 | insertion | Nonsense_Mutation | novel | c.3589_3590insAGAGGGCATCAGGAAGTGTTGGAGGGATACCCTTCCTCAGAGACA | p.Ser1197delinsTer | p.S1197delins* | Q9ULJ7 | protein_coding | TCGA-A8-A07J-01 | Breast | breast invasive carcinoma | Female | <65 | I/II | Chemotherapy | 5-fluorouracil | CR | ||
| ANKRD50 | insertion | Frame_Shift_Ins | novel | c.1100_1101insAGAA | p.Leu369GlyfsTer31 | p.L369Gfs*31 | Q9ULJ7 | protein_coding | TCGA-A8-A07J-01 | Breast | breast invasive carcinoma | Female | <65 | I/II | Chemotherapy | 5-fluorouracil | CR |
| Page: 1 2 3 4 5 6 7 8 9 10 11 12 13 14 15 16 17 18 19 20 |
Top |
Related drugs of malignant transformation related genes |
| Identification of chemicals and drugs interact with genes involved in malignant transfromation |
| (DGIdb 4.0) |
| Entrez ID | Symbol | Category | Interaction Types | Drug Claim Name | Drug Name | PMIDs |
| Page: 1 |

Copyright 2023-Present -The University of Texas Health Science Center at Houston |