
|
|||||
|
 | |
| |
| |
| |
| |
| |
|
Gene: ANKRD42 |
Gene summary for ANKRD42 |
| Gene information | Species | Human | Gene symbol | ANKRD42 | Gene ID | 338699 |
| Gene name | ankyrin repeat domain 42 | |
| Gene Alias | PPP1R79 | |
| Cytomap | 11q14.1 | |
| Gene Type | protein-coding | GO ID | NA | UniProtAcc | A1XPJ0 |
Top |
Malignant transformation analysis |
| Identification of the aberrant gene expression in precancerous and cancerous lesions by comparing the gene expression of stem-like cells in diseased tissues with normal stem cells |
| Entrez ID | Symbol | Replicates | Species | Organ | Tissue | Adj P-value | Log2FC | Malignancy |
| 338699 | ANKRD42 | male-WTA | Human | Thyroid | PTC | 1.05e-08 | 7.01e-02 | 0.1037 |
| 338699 | ANKRD42 | PTC01 | Human | Thyroid | PTC | 1.24e-09 | 8.56e-02 | 0.1899 |
| 338699 | ANKRD42 | PTC04 | Human | Thyroid | PTC | 5.08e-14 | 1.21e-01 | 0.1927 |
| 338699 | ANKRD42 | PTC05 | Human | Thyroid | PTC | 2.65e-06 | 2.89e-01 | 0.2065 |
| 338699 | ANKRD42 | PTC06 | Human | Thyroid | PTC | 3.23e-16 | 2.66e-01 | 0.2057 |
| 338699 | ANKRD42 | PTC07 | Human | Thyroid | PTC | 3.17e-15 | 2.38e-01 | 0.2044 |
| 338699 | ANKRD42 | ATC09 | Human | Thyroid | ATC | 1.03e-09 | 3.25e-01 | 0.2871 |
| 338699 | ANKRD42 | ATC12 | Human | Thyroid | ATC | 8.07e-04 | -1.45e-02 | 0.34 |
| 338699 | ANKRD42 | ATC13 | Human | Thyroid | ATC | 1.66e-19 | 1.78e-01 | 0.34 |
| 338699 | ANKRD42 | ATC1 | Human | Thyroid | ATC | 2.51e-10 | 3.76e-01 | 0.2878 |
| 338699 | ANKRD42 | ATC2 | Human | Thyroid | ATC | 2.96e-05 | 2.29e-01 | 0.34 |
| 338699 | ANKRD42 | ATC4 | Human | Thyroid | ATC | 3.21e-02 | 1.81e-02 | 0.34 |
| 338699 | ANKRD42 | ATC5 | Human | Thyroid | ATC | 1.02e-20 | 2.02e-01 | 0.34 |
| Page: 1 |
| Tissue | Expression Dynamics | Abbreviation |
| Thyroid | 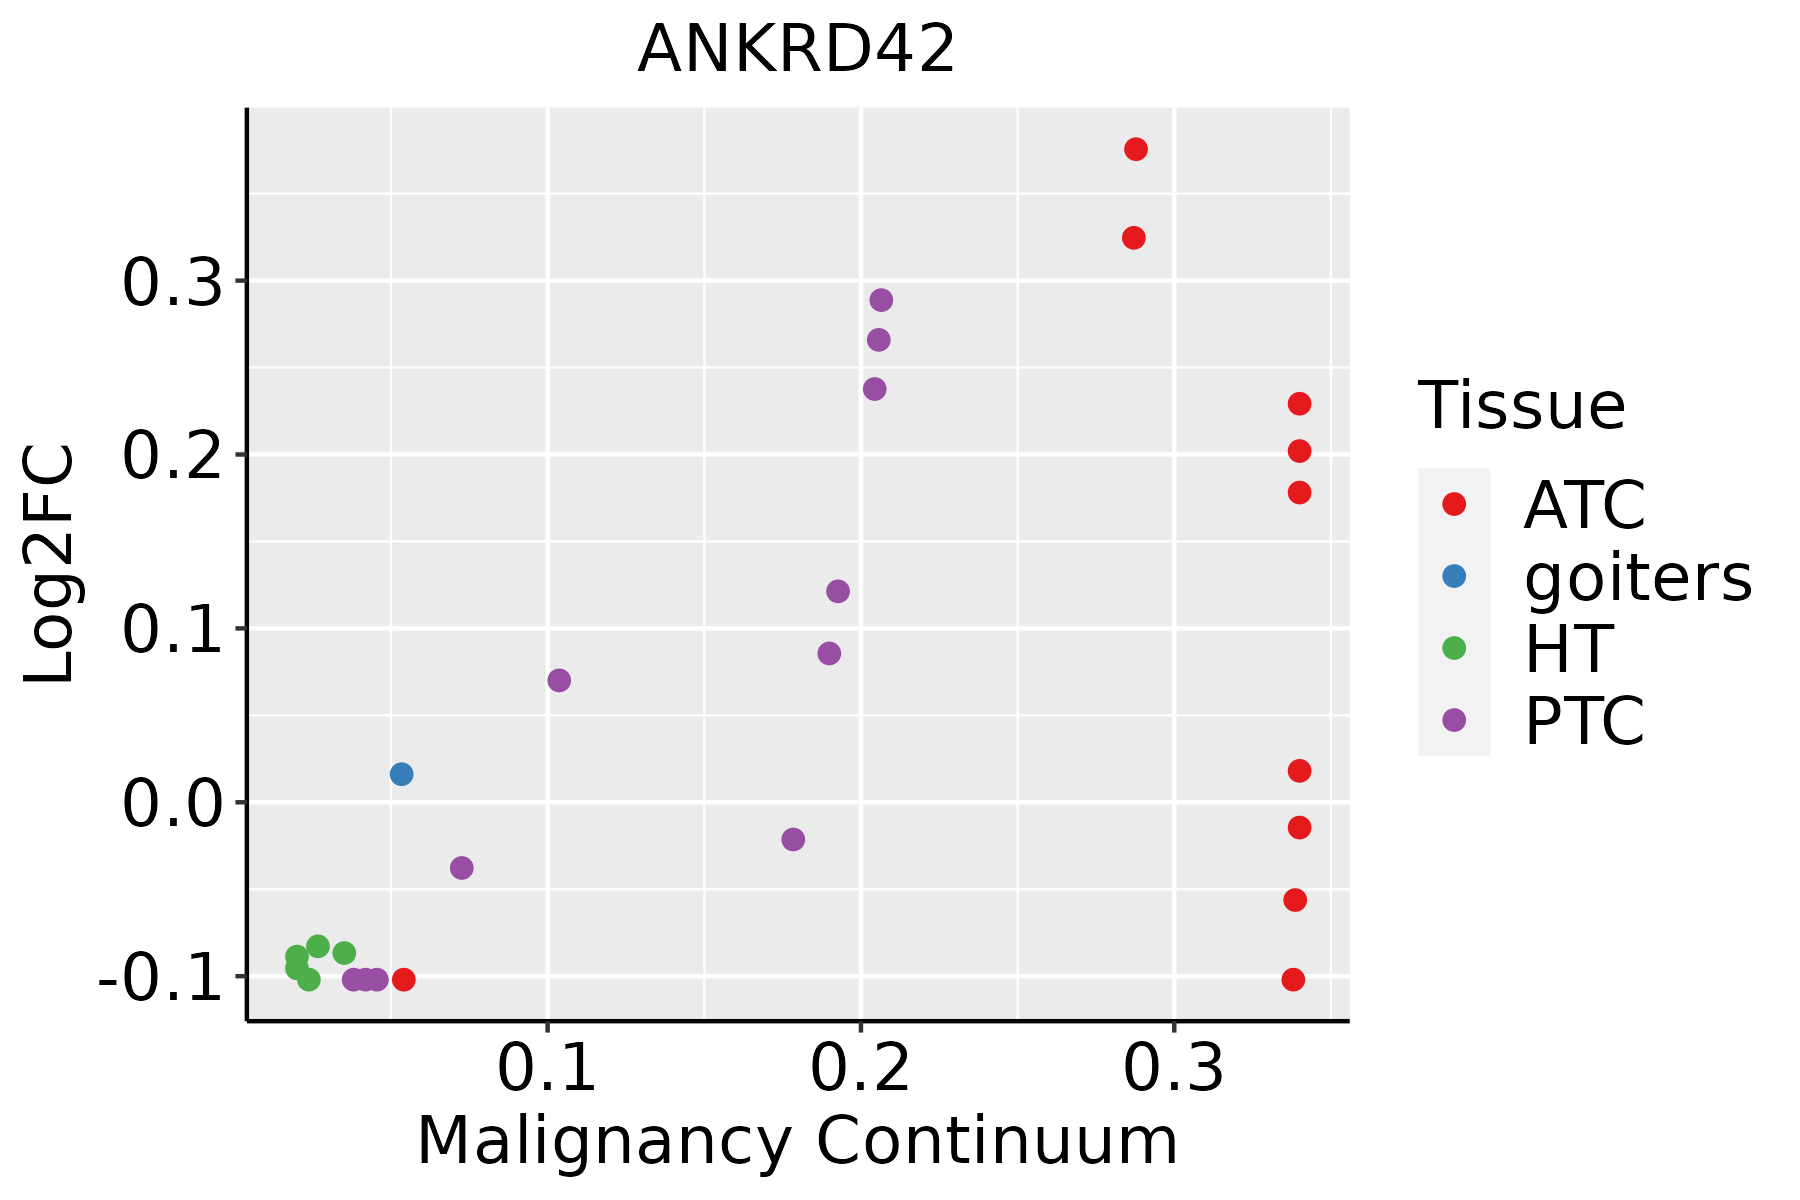 | ATC: Anaplastic thyroid cancer |
| HT: Hashimoto's thyroiditis | ||
| PTC: Papillary thyroid cancer |
| ∗log2FC in expression of this searched gene in stem-like cells from each diseased tissue sample relative to stem-like cells in normal samples in each tissue plotted against the malignancy continuum. Samples are colored based on if they are from different disease stage. |
Top |
Malignant transformation related pathway analysis |
| Find out the enriched GO biological processes and KEGG pathways involved in transition from healthy to precancer to cancer |
| Tissue | Disease Stage | Enriched GO biological Processes |
| Colorectum | AD |  |
| Colorectum | SER |  |
| Colorectum | MSS |  |
| Colorectum | MSI-H |  |
| Colorectum | FAP |  |
| ∗Top 15 enriched GO BP terms are showed in the bar plot of each disease state in each tissue. Each row represents a significant GO biological process which is colored according to the -log10(p.adjust). |
| Page: 1 2 3 4 5 6 7 8 9 |
| GO ID | Tissue | Disease Stage | Description | Gene Ratio | Bg Ratio | pvalue | p.adjust | Count |
| Page: 1 |
| Pathway ID | Tissue | Disease Stage | Description | Gene Ratio | Bg Ratio | pvalue | p.adjust | qvalue | Count |
| Page: 1 |
Top |
Cell-cell communication analysis |
| Identification of potential cell-cell interactions between two cell types and their ligand-receptor pairs for different disease states |
| Ligand | Receptor | LRpair | Pathway | Tissue | Disease Stage |
| Page: 1 |
Top |
Single-cell gene regulatory network inference analysis |
| Find out the significant the regulons (TFs) and the target genes of each regulon across cell types for different disease states |
| TF | Cell Type | Tissue | Disease Stage | Target Gene | RSS | Regulon Activity |
| ∗The dot plots of a searched regulon are shown for all cell subpopulations in each disease state of each tissue based on the regulon specific score inferred using pySCENIC and by calculating the average expression. |
| Page: 1 |
Top |
Somatic mutation of malignant transformation related genes |
| Annotation of somatic variants for genes involved in malignant transformation |
| Hugo Symbol | Variant Class | Variant Classification | dbSNP RS | HGVSc | HGVSp | HGVSp Short | SWISSPROT | BIOTYPE | SIFT | PolyPhen | Tumor Sample Barcode | Tissue | Histology | Sex | Age | Stage | Therapy Types | Drugs | Outcome |
| ANKRD42 | SNV | Missense_Mutation | c.871N>T | p.Ile291Phe | p.I291F | protein_coding | deleterious(0.05) | benign(0.144) | TCGA-A1-A0SK-01 | Breast | breast invasive carcinoma | Female | <65 | I/II | Unknown | Unknown | PD | ||
| ANKRD42 | SNV | Missense_Mutation | novel | c.374N>T | p.Arg125Leu | p.R125L | protein_coding | deleterious(0.03) | probably_damaging(0.974) | TCGA-A7-A0DB-01 | Breast | breast invasive carcinoma | Female | <65 | I/II | Hormone Therapy | arimidex | SD | |
| ANKRD42 | SNV | Missense_Mutation | novel | c.1393G>C | p.Asp465His | p.D465H | protein_coding | deleterious(0) | probably_damaging(0.999) | TCGA-AN-A0FL-01 | Breast | breast invasive carcinoma | Female | <65 | I/II | Unknown | Unknown | SD | |
| ANKRD42 | SNV | Missense_Mutation | novel | c.65N>T | p.Arg22Met | p.R22M | protein_coding | deleterious_low_confidence(0) | possibly_damaging(0.533) | TCGA-2W-A8YY-01 | Cervix | cervical & endocervical cancer | Female | <65 | I/II | Chemotherapy | cisplatin | CR | |
| ANKRD42 | SNV | Missense_Mutation | novel | c.1484N>C | p.Asn495Thr | p.N495T | protein_coding | tolerated_low_confidence(0.11) | benign(0.003) | TCGA-2W-A8YY-01 | Cervix | cervical & endocervical cancer | Female | <65 | I/II | Chemotherapy | cisplatin | CR | |
| ANKRD42 | SNV | Missense_Mutation | c.886G>A | p.Asp296Asn | p.D296N | protein_coding | tolerated(0.48) | benign(0.015) | TCGA-EK-A2RA-01 | Cervix | cervical & endocervical cancer | Female | >=65 | I/II | Unknown | Unknown | SD | ||
| ANKRD42 | SNV | Missense_Mutation | c.219G>T | p.Leu73Phe | p.L73F | protein_coding | deleterious(0) | probably_damaging(0.989) | TCGA-AA-3697-01 | Colorectum | colon adenocarcinoma | Male | >=65 | I/II | Unknown | Unknown | SD | ||
| ANKRD42 | SNV | Missense_Mutation | rs367680833 | c.1403G>A | p.Arg468Gln | p.R468Q | protein_coding | deleterious(0) | probably_damaging(0.949) | TCGA-AA-3949-01 | Colorectum | colon adenocarcinoma | Female | >=65 | III/IV | Unknown | Unknown | SD | |
| ANKRD42 | SNV | Missense_Mutation | c.872N>G | p.Ile291Ser | p.I291S | protein_coding | deleterious(0) | possibly_damaging(0.896) | TCGA-AA-A010-01 | Colorectum | colon adenocarcinoma | Female | <65 | I/II | Chemotherapy | folinic | CR | ||
| ANKRD42 | SNV | Missense_Mutation | rs780800417 | c.440N>A | p.Arg147Gln | p.R147Q | protein_coding | deleterious(0.05) | benign(0.319) | TCGA-CA-6717-01 | Colorectum | colon adenocarcinoma | Male | <65 | I/II | Chemotherapy | oxaliplatin | CR |
| Page: 1 2 3 4 5 6 |
Top |
Related drugs of malignant transformation related genes |
| Identification of chemicals and drugs interact with genes involved in malignant transfromation |
| (DGIdb 4.0) |
| Entrez ID | Symbol | Category | Interaction Types | Drug Claim Name | Drug Name | PMIDs |
| Page: 1 |

Copyright 2023-Present -The University of Texas Health Science Center at Houston |